Economics 9708/23 — October/November 2017
Cambridge AS Level · AS Level Data Response and Essays · worked solutions for every part, with the mark scheme
Topics Price Stability · Methods of Government Intervention in Markets · International Trade and Comparative Advantage · Protectionism · Elasticities of Demand · Production Possibility Curves · +3 more
The world market for rice
Table 1: The World Price of Rice
(World average price index, 2004 = 100)
| Year | Rice Price Index |
|---|---|
| 2011 | 242 |
| 2012 | 231 |
| 2013 | 233 |
| 2014 | 235 |
| 2015 | 211 |
Source: F.A.O.
The market for rice is more distorted than that for any other basic food.
Content removed due to copyright restrictions
more rice. Rice-exporting countries should encourage this by dismantling controls of their own.
Source: adapted from The Economist, 14 November 2015
Using Table 1, calculate the percentage change in the price of rice from 2014 to 2015.
Working
Price in 2014 = 235, Price in 2015 = 211.
Change = 211 - 235 = -24.
Percentage change = (-24/235) × 100 = -10.2% (approx).
Answer
The price of rice fell by 10.2% from 2014 to 2015.
The price of rice fell by 10.2%.
Background Concept
Percentage change is a standard measure of the relative change in a variable over time. It is calculated as (new value - old value) / old value × 100%. A negative result indicates a fall.
Understanding the Question
The question provides a table of rice price index values for 2011–2015. It asks for the percentage change from 2014 to 2015. The index is set at 100 in 2004, so values are relative to that base year. The calculation is purely arithmetic.
Approach
Identify the values for 2014 and 2015, compute the change, divide by the base (2014) and multiply by 100. Then state whether the price rose or fell.
Step-by-Step Reasoning
- From Table 1, index in 2014 = 235, in 2015 = 211.
- Change = 211 - 235 = -24.
- Percentage change = (-24/235) × 100 = -10.2127...% ≈ -10.2%.
- The negative sign indicates a fall. So the price of rice fell by about 10.2%.
Key Takeaways
- Percentage change formula: (new - old) / old × 100.
- Always include the sign to show direction of change.
- Round appropriately; here one decimal place is sufficient.
Common Mistakes
- Forgetting to state that the price fell (only giving the number loses a mark).
- Using the wrong base year (e.g., dividing by 235 instead of 235? Actually division by 235 is correct; using 211 would be wrong).
- Misreading the table (e.g., using 2011 and 2015).
Things to Be Careful About
- Ensure you use the correct years (2014 and 2015).
- The percentage change is negative; the word 'fell' or 'decrease' must be in the answer.
- Rounding: 10.2% is acceptable; 10.21% is also fine but not necessary.
Explain how rice farmers in Japan benefit from subsidies on fertilisers, power and water. Use a diagram to support your answer.
Answer
A subsidy on fertilisers, power and water reduces the costs of production for rice farmers. This shifts the supply curve to the right from S1 to S2, as shown in the diagram. The equilibrium price falls from P1 to P2 and the quantity traded increases from Q1 to Q2. Farmers benefit from lower input costs, which increase their profit margins, and the increased output raises their total revenue.
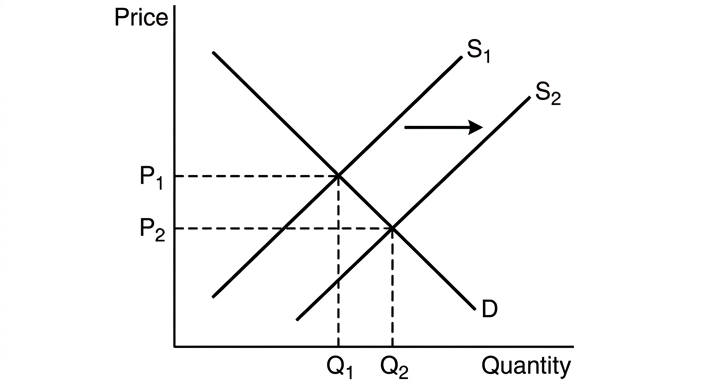
Japanese rice farmers benefit from lower input costs, which increase profit margins and total revenue as the supply curve shifts right.
Background Concept
A subsidy is a payment by the government to producers that reduces their costs of production. This shifts the supply curve to the right (increase in supply) because at every price, producers are willing to supply more. The new equilibrium has a lower price and higher quantity.
Understanding the Question
The question asks how Japanese rice farmers benefit from subsidies on inputs (fertilisers, power, water). The answer must use a diagram and explain the causal chain: subsidy → lower costs → supply shift → lower price → higher output → benefit to farmers. The benefit is primarily through lower costs (higher profit per unit) and possibly higher total revenue if demand is elastic enough, but the main point is cost reduction.
Approach
Draw a standard supply and demand diagram. Label axes, initial equilibrium, then shift supply right. Explain the shift, the new equilibrium, and how farmers gain from lower costs and increased output.
Step-by-Step Reasoning
- The subsidy directly reduces the cost of producing rice. This means at any given price, farmers are willing to supply more rice. The supply curve shifts right (from S1 to S2).
- In the diagram, the demand curve D remains unchanged. The new equilibrium is at the intersection of D and S2, with a lower price (P2) and higher quantity (Q2) compared to the original equilibrium (P1, Q1).
- Farmers benefit because their input costs are lower, so their profit per unit (price minus cost) may increase despite the lower price. Also, the higher quantity sold increases total revenue (price × quantity), provided the price fall is not too large. Typically, with a subsidy, producers' surplus increases.
- The diagram shows the rightward shift, the fall in price, and the rise in quantity. All axes and curves must be labelled.
Key Takeaways
- Subsidies shift supply right.
- The equilibrium price falls and quantity rises.
- Producers benefit from lower costs and higher output.
Common Mistakes
- Confusing subsidy with a tax (which shifts supply left).
- Drawing a shift in demand instead of supply.
- Not labelling the diagram axes and curves.
- Not explaining how the farmers benefit (just stating the diagram is not enough).
Things to Be Careful About
- The diagram must be fully explained in the text.
- The subsidy is on inputs, not on output, but the effect is the same: lower costs shift supply.
- Ensure the shift is to the right, not left.
Explain how minimum prices will protect the interests of rice farmers. Consider whether the minimum price can be sustained in the long run.
Answer
A minimum price set above the equilibrium price raises the price received by farmers, increasing their revenue and protecting their incomes. However, at the higher price, quantity supplied exceeds quantity demanded, creating a surplus. The government must purchase the surplus to maintain the minimum price. In the long run, sustaining the minimum price is difficult because the government faces increasing costs of purchasing and storing the surplus, and the surplus may lead to black markets. Therefore, the minimum price is unlikely to be sustainable indefinitely unless the government is willing to commit substantial resources.
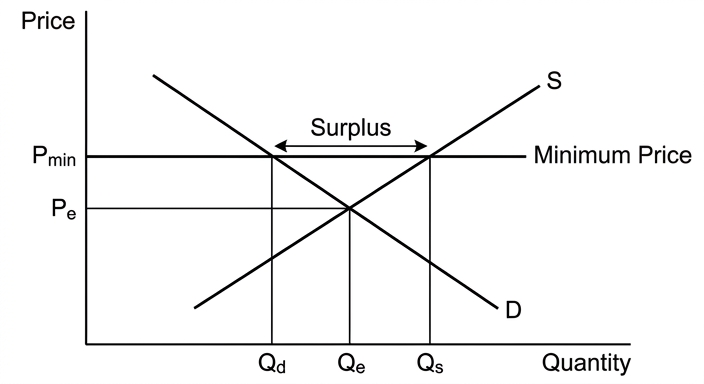
Minimum prices protect farmers' incomes in the short run but are unlikely to be sustainable in the long run due to the costs of managing the surplus.
Background Concept
A minimum price (price floor) is a government-imposed price set above the market equilibrium. It is intended to protect producers by ensuring they receive a price at least as high as the floor. At the floor price, quantity supplied exceeds quantity demanded, leading to a surplus. To maintain the floor, the government must buy the excess supply.
Understanding the Question
The question requires explaining how minimum prices protect rice farmers and then considering whether the minimum price can be sustained in the long run. The explanation should include a diagram showing the price floor, the surplus, and the need for government purchase. The evaluation should discuss the costs and feasibility of maintaining the floor.
Approach
Draw a demand and supply diagram with a horizontal line at the minimum price above equilibrium. Show the surplus. Explain that the higher price increases farmers' revenue. Then discuss the government's role in buying the surplus and the long-run difficulties: rising costs, storage, black markets, and political pressure.
Step-by-Step Reasoning
- Without intervention, the market equilibrium is at price Pe and quantity Qe.
- The government sets a minimum price Pmin above Pe.
- At Pmin, quantity supplied (Qs) is greater than quantity demanded (Qd), creating a surplus of Qs - Qd.
- Farmers benefit because they receive a higher price per unit, increasing their total revenue (Pmin × Qs) compared to the free market (Pe × Qe). This protects their incomes.
- To maintain Pmin, the government must purchase the surplus Qs - Qd, otherwise the excess supply would push the price back down to equilibrium.
- In the long run, sustaining the minimum price is challenging. The government incurs large costs buying and storing the surplus. If the surplus is stored, it may deteriorate or become costly to maintain. The existence of a surplus may encourage black markets where rice is sold below the minimum price. Also, the policy may attract more producers, increasing the surplus further. Ultimately, unless the government is prepared to spend heavily and possibly restrict supply, the minimum price is unlikely to be sustainable.
Key Takeaways
- A minimum price above equilibrium creates a surplus.
- Government must buy the surplus to maintain the price.
- Long-run sustainability depends on the government's ability to finance and manage the surplus.
Common Mistakes
- Confusing minimum price with maximum price (price ceiling).
- Not showing the surplus on the diagram.
- Failing to provide an evaluative comment on sustainability (the question explicitly asks for it).
- Simply stating that the surplus will exist without discussing the government's role.
Things to Be Careful About
- The diagram must clearly show the minimum price line, the surplus, and the axes.
- The evaluation should consider both sides: the short-term protection and long-term difficulties.
- The conclusion should be a justified judgement, not just a summary.
Explain how the principle of comparative advantage might be used to justify Thailand and Vietnam specialising in rice production and Japan specialising in some other product.
Answer
Comparative advantage occurs when a country can produce a good at a lower opportunity cost than another country. Thailand and Vietnam have favourable factor endowments (climate, land) for rice production, giving them a lower opportunity cost in rice compared to Japan. Therefore, according to the principle of comparative advantage, Thailand and Vietnam should specialise in rice production and trade with Japan, which should specialise in other products where it has a comparative advantage. This leads to higher total output and mutual gains from trade.
Thailand and Vietnam have a comparative advantage in rice due to lower opportunity cost, so they should specialise in rice production and trade with Japan.
Background Concept
Comparative advantage is the ability of a country to produce a good at a lower opportunity cost than another country. Opportunity cost is the value of the next best alternative forgone. Specialisation according to comparative advantage and trade allows both countries to consume beyond their production possibility curves, increasing global welfare.
Understanding the Question
The question asks to explain how the principle of comparative advantage might justify Thailand and Vietnam specialising in rice and Japan specialising in something else. The extract mentions that Thailand and Vietnam have favourable factor endowments (climate, land) for rice, while Japan does not. This implies that Japan's opportunity cost of producing rice is higher than that of Thailand and Vietnam.
Approach
Define comparative advantage and opportunity cost. Explain that factor endowments determine opportunity costs. Use the extract to argue that Thailand and Vietnam have a lower opportunity cost in rice, so they should specialise in rice. Japan should specialise in products where it has a lower opportunity cost (e.g., manufactured goods). Conclude with the benefits of trade.
Step-by-Step Reasoning
- Comparative advantage is based on differences in opportunity cost. A country has a comparative advantage in a good if it can produce it at a lower opportunity cost than its trading partner.
- The extract states that Thailand and Vietnam have favourable climate and land for rice cultivation, which means they can produce rice with relatively little sacrifice of other goods. Japan, with less suitable land, must give up more of other goods to produce rice, so its opportunity cost of rice is higher.
- Therefore, Thailand and Vietnam have a comparative advantage in rice. Japan has a comparative advantage in other products (e.g., electronics, cars).
- According to the principle of comparative advantage, each country should specialise in the product where it has the lowest opportunity cost. This leads to specialisation: Thailand and Vietnam produce rice, Japan produces other goods.
- Trade between them will allow each country to consume more of both goods than if they tried to be self-sufficient. This is the gain from trade.
Key Takeaways
- Comparative advantage is about opportunity cost, not absolute advantage.
- Factor endowments (climate, land, capital) influence opportunity costs.
- Specialisation and trade based on comparative advantage increase global output.
Common Mistakes
- Confusing comparative advantage with absolute advantage (e.g., saying Japan cannot produce rice at all).
- Not mentioning opportunity cost explicitly.
- Failing to apply the theory to the specific countries in the extract.
Things to Be Careful About
- Use the extract's information to support the argument (favourable endowments for Thailand and Vietnam).
- Clearly state that Japan should specialise in 'some other product' – you don't need to specify which.
- The answer should be concise but include the key chain of reasoning: opportunity cost → specialisation → trade gains.
Discuss the advantages and disadvantages of rice-importing countries removing their controls on the rice market. Consider whether on balance the controls should be kept.
Answer
Removing controls on rice imports would have several advantages. Consumers in importing countries would benefit from lower rice prices, increasing their real income. Resources would be reallocated to more efficient uses, raising global welfare. It would also reduce government expenditure on maintaining controls.
However, there are disadvantages. Domestic rice farmers in importing countries would face increased competition, leading to job losses and lower incomes. Food security may be compromised if reliance on imports increases. The adjustment costs of moving resources out of rice farming could be high.
On balance, the advantages of removing controls likely outweigh the disadvantages in the long run, as the gains from trade and efficiency improvements are substantial. However, the transition may require support for affected farmers. Therefore, controls should be removed gradually, with appropriate safety nets.
On balance, the advantages of removing controls likely outweigh the disadvantages, but the transition should be managed with support for affected farmers.
Background Concept
Protectionist controls (tariffs, quotas, subsidies) distort trade and can lead to inefficiency. Free trade allows countries to specialise according to comparative advantage, increasing total output and lowering prices for consumers. However, removal of protection can cause short-term adjustment costs such as unemployment and loss of income for protected industries.
Understanding the Question
The question asks to discuss the advantages and disadvantages of rice-importing countries removing their controls on the rice market, and then consider whether on balance the controls should be kept. The extract provides context: the world rice market is distorted, and exporting countries encourage dismantling controls. The answer must be two-sided and include a conclusion.
Approach
List advantages (lower prices, efficiency, reduced government spending) and disadvantages (job losses, food security, adjustment costs). Then weigh them against each other and reach a justified conclusion. Use the extract to support points (e.g., rice farmers in Japan may be affected).
Step-by-Step Reasoning
- Advantages:
- Lower rice prices for consumers in importing countries increase real income and reduce cost of living.
- Resources (land, labour) can move to more productive uses, increasing overall economic efficiency.
- Government no longer needs to spend on enforcing controls (e.g., administering tariffs or quotas).
- Global welfare increases due to specialisation according to comparative advantage.
- Disadvantages:
- Domestic rice farmers face competition from cheaper imports, leading to loss of income and unemployment.
- Food security may be reduced if the country becomes heavily dependent on imports, especially in times of global supply shocks.
- Adjustment costs: retraining workers, moving capital, and possible regional economic decline.
- If the country has a comparative disadvantage in rice, the long-run benefits may take time to materialise.
- Evaluation:
- The long-run gains from trade (efficiency, lower prices) are likely to be larger than the short-run adjustment costs.
- However, the distributional effects matter: farmers lose while consumers gain. A government might implement transitional support (e.g., retraining, temporary income support) to ease the pain.
- Food security concerns can be mitigated by maintaining strategic reserves or diversifying sources.
- On balance, removing controls is beneficial, but the process should be gradual to allow adjustment.
- Conclusion: The controls should be removed, but with safety nets for affected farmers.
Key Takeaways
- Free trade brings efficiency gains but can harm specific groups.
- A balanced evaluation must consider both efficiency and equity.
- A justified conclusion weighs the arguments and provides a clear recommendation.
Common Mistakes
- One-sided answer (only advantages or only disadvantages) – loses marks for evaluation.
- No conclusion or a vague conclusion (e.g., 'it depends') without justification.
- Not using the extract context (e.g., mentioning Japanese rice farmers explicitly).
- Simply listing points without developing them (e.g., 'lower prices for consumers' without explaining why that is good).
Things to Be Careful About
- The question specifically asks about rice-importing countries removing controls, so focus on the importing country's perspective.
- The conclusion must be a clear judgement, not a summary of both sides.
- Use the extract if possible: the text mentions that rice-exporting countries encourage dismantling controls, so that can be used to support the advantage of free trade.
The rest of this paper
3 more questions- Q2Elasticities of Demand20M
- Q3Production Possibility Curves · Economic Growth · Supply-Side Policy20M
- Q4Exchange Rates20M