Economics 9708/22 — May/June 2017
Cambridge AS Level · AS Level Data Response and Essays · worked solutions for every part, with the mark scheme
Topics Price Stability · Production Possibility Curves · Exchange Rates · Balance of Payments · Factors of Production · Market Equilibrium and the Price Mechanism · +6 more
The miraculous story of Iceland
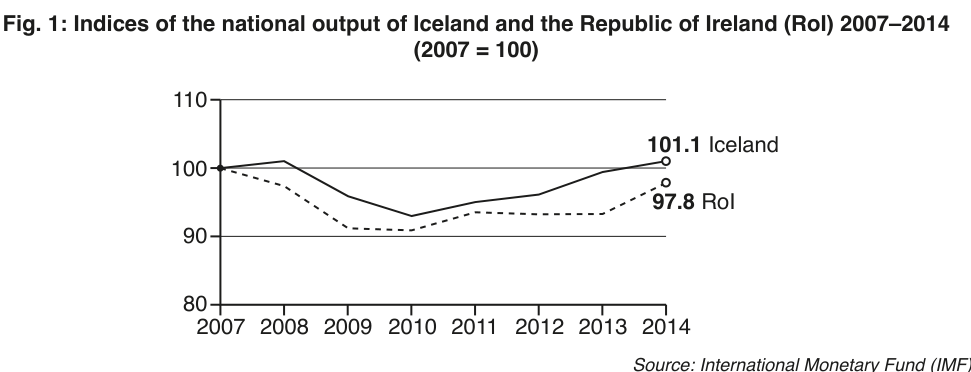
Fig. 1: Indices of the national output of Iceland and the Republic of Ireland (RoI) 2007–2014 (2007 = 100)
Source: International Monetary Fund (IMF)
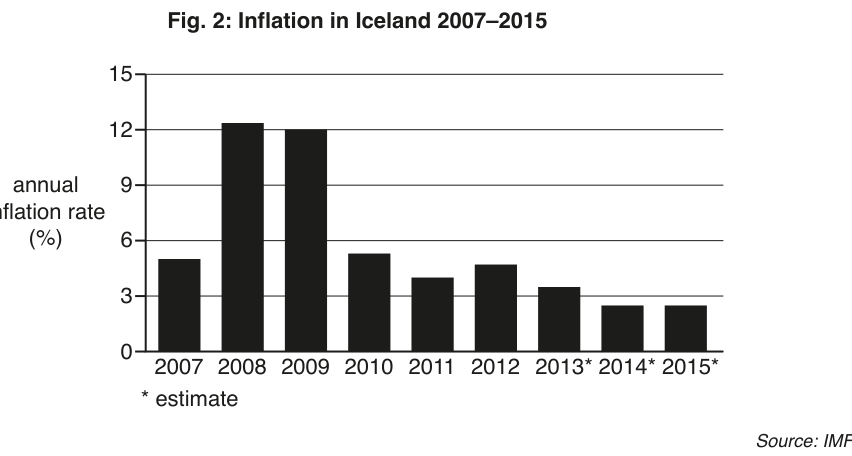
Fig. 2: Inflation in Iceland 2007–2015
Source: IMF
As a result of the financial crisis of 2007–2008 both Iceland and the Republic of Ireland (RoI) had to seek help from the International Monetary Fund (IMF). In total, Iceland borrowed US$4.6 billion, with US$2.1 billion of that coming from the IMF and the other US$2.5 billion from neighbouring Scandinavian countries. In exchange for help, Iceland was forced to sharply reduce government spending – introducing more austerity than the RoI did. Not only that, but Iceland also increased interest rates to 18% in the immediate aftermath of the crisis to reduce inflation. It gradually cut interest rates afterward, but it was not until 2011 that they fell to 4.25%.
The biggest difference between the two economies is that Iceland has its own currency, the krona. Iceland manages its foreign exchange rate through intervention in the foreign exchange market and through interest rate changes. Insufficient foreign exchange reserves meant that the value of the krona fell by nearly 60% between the end of 2007 and the end of 2008. The RoI, on the other hand, did not have its own currency that it could devalue. It is part of the eurozone, where each country uses the euro, and the RoI authorities have no control over its value.
Iceland’s recovery has been better than the RoI’s despite the fact that Iceland’s recession was much more serious than the RoI’s. The Icelandic economy has recovered surprisingly strongly since 2010. The large devaluation of the krona against both the US dollar and the euro helped. There has been a big boost from tourism. Unemployment, which peaked at 9% of the workforce at the worst of the crisis, is now back down to 5%. In the RoI, unemployment is falling but is still 9.8% of the workforce. Iceland’s economy has now recovered roughly to its pre-crisis peak. The IMF predicts that Iceland’s output will grow by 3.5% this year. The current account deficit, which was 25% of national income in 2009, has been eliminated and there is now a current account surplus. The government also ran a budget surplus last year for the first time since the crisis.
Source: Matt O’Brien, The Washington Post, 17 June 2015
Use production possibility curves to compare the changes in the output of the RoI and Iceland shown in Fig. 1.
Use Fig. 2 to compare the general price level in Iceland in 2007 and 2015.
Explain two ways in which the fall in the value of the krona between the end of 2007 and the end of 2008 might have caused the rise in the rate of inflation shown in Fig. 2.
Explain the factors that determine whether the devaluation of a currency such as the Icelandic krona would turn a current account deficit into a surplus.
Consider whether the costs to an economy of managing its exchange rate outweigh the benefits of such a system.
The rest of this paper
3 more questions- Q2Factors of Production · Market Equilibrium and the Price Mechanism · Classification of Goods and Services · Methods of Government Intervention in Markets20M
- Q3Elasticities of Demand20M
- Q4Fiscal Policy · Monetary Policy · Supply-Side Policy · Price Stability20M