Economics 9708/21 — May/June 2017
Cambridge AS Level · AS Level Data Response and Essays · worked solutions for every part, with the mark scheme
Topics Demand and Supply · Exchange Rates · Methods of Government Intervention in Markets · Price Stability · Production Possibility Curves · Aggregate Demand and Aggregate Supply · +5 more
Fall in price of oil but Colombia can look forward to growth
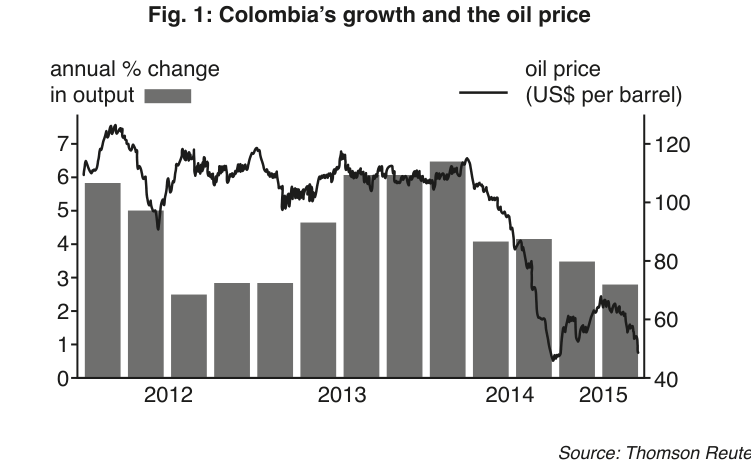
Fig. 1: Colombia’s growth and the oil price
Source: Thomson Reuters Datastream
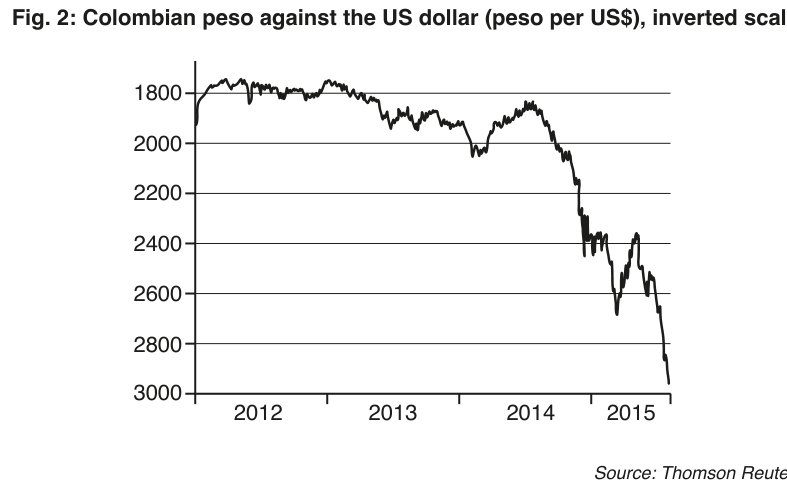
Fig. 2: Colombian peso against the US dollar (peso per US$), inverted scale
Source: Thomson Reuters Datastream
Over the past year, the halving of crude oil prices has hit Colombia and much of South America hard. Venezuela’s economy, for example, is expected to shrink by 7% this year. Colombia’s national oil production was running at 1 million barrels a year, accounting for half of its exports and a fifth of government revenues. In Puerto Gaitan, which only a year ago was the centre of Colombia’s oil industry, the town’s population had tripled to 45 000 in just a few years. Property prices had soared and hotels overflowed. Today, though, business profits have fallen, leading to a fall in spending by entrepreneurs. “For Sale” signs now hang over Puerto Gaitan’s closed stores, car parks in shopping malls are empty and 10 000 people have left the town. Towns throughout Colombia are experiencing similar problems.
Colombia’s government is feeling the effects as well. Every US$1 drop in the oil price per barrel cuts an estimated US$200 million from government revenues. As a result, the government has cut spending and raised taxes to keep its budget deficit down. More worryingly, the collapse in the price of oil has opened a large current account deficit equivalent to 7% of national income. Yet not all is bleak. Colombia’s economy is forecast to grow this year. And unlike in neighbouring Venezuela, where oil accounts for more than 90% of exports, there is concern but no panic.
Firstly, the peso’s depreciation could reverse Colombia’s current account problems, boosting traditional exports such as coffee, textiles, car parts and flowers — if not to its immediate neighbours, then to the United States. Colombia produces oil, but it is not only an oil-producing country. Secondly, Colombia’s government is having peace talks with Marxist rebels to end the country’s five decades of unrest. The government’s military expenditure will be reduced and estimates suggest that this ‘peace dividend’ could add as much as 2 percentage points to growth.
Source: The Financial Times, 2015
With the help of a diagram, explain one possible cause of the fall in the price of oil shown in Fig. 1.
Answer
One possible cause is an increase in the supply of oil. For instance, increased production by oil-producing countries or new extraction technologies could shift the supply curve to the right. This increase in supply leads to a lower equilibrium price.
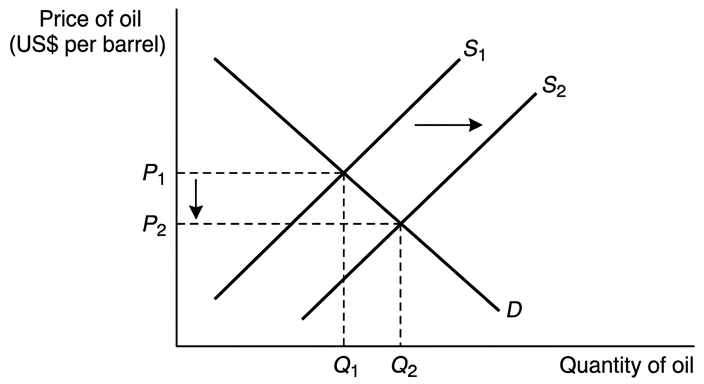
The diagram shows the market for oil. The supply curve shifts rightward from S1 to S2, causing the equilibrium price to fall from P1 to P2.
An increase in supply (or decrease in demand) shifting the curve rightward (or leftward), lowering the equilibrium price.
Background Concept
The price of a good in a market is determined by the interaction of demand and supply. A fall in price can be caused either by a decrease in demand (a leftward shift of the demand curve) or by an increase in supply (a rightward shift of the supply curve). In the context of global oil markets, factors such as increased production by OPEC or non-OPEC countries, technological advances in extraction (such as shale oil fracking), or changes in global economic growth can shift these curves.
Understanding the Question
The question asks for one possible cause of the fall in the oil price shown in Fig. 1, using a diagram. Fig. 1 shows the oil price collapsing from around $100–120 per barrel in mid-2014 to around $40 by 2015. The candidate must identify whether this was caused by a demand-side or supply-side shift, illustrate it with a demand and supply diagram, and explain the reason for the shift.
Approach
The best approach is to choose one clear cause—either a supply increase or a demand decrease—draw the corresponding diagram showing the shift and the resulting lower price, and explain the real-world reason. Since the extract mentions the halving of crude oil prices without specifying the cause, either shift is acceptable. An increase in supply due to increased production or new technology is a standard explanation for the 2014–15 oil price collapse.
Step-by-Step Reasoning
- Identify the market: the global market for crude oil.
- Choose the cause: an increase in supply. This could be due to increased production by non-OPEC countries (such as the US shale oil industry) or OPEC's decision not to cut production.
- Draw the diagram: price on the vertical axis, quantity on the horizontal axis. Draw a downward-sloping demand curve (D) and an upward-sloping initial supply curve (S1). Shift supply right to S2.
- Show the outcome: the intersection moves down along the demand curve, resulting in a lower equilibrium price (P2 < P1) and a higher quantity.
- Explain: the increase in supply means more oil is available at every price, so producers compete by lowering prices to clear the market.
Key Takeaways
- A fall in price can be caused by either a demand decrease or a supply increase.
- The diagram must show the shift and the new lower equilibrium price.
- Always label curves and axes, and state the direction of the shift.
Common Mistakes
- Drawing a movement along the curve instead of a shift.
- Forgetting to label the diagram (axes and curves).
- Explaining the shift incorrectly (for example, saying supply increased because price fell, which confuses cause and effect).
- Quoting figures from the extract without linking them to the diagram.
Things to Be Careful About
- Ensure the diagram clearly shows the shift (S1 to S2 or D1 to D2) and the new equilibrium price.
- The explanation must give a reason for the shift, not just describe the diagram.
- Either supply increase or demand decrease is acceptable; do not mix them in a single answer.
Explain how the fall in the price of oil has resulted in the fall in the value of the peso shown in Fig. 2.
Answer
The fall in the oil price has reduced Colombia's export revenues because oil accounts for half of its exports. With lower export earnings, there is less demand for the Colombian peso from foreign importers who need pesos to pay for Colombian goods. This reduction in demand for the peso causes its value to fall (depreciate) against the US dollar.
Fall in oil export revenues reduces demand for the peso, causing its depreciation.
Background Concept
In a floating exchange rate system, the value of a currency is determined by the demand for and supply of that currency in the foreign exchange market. Demand for a currency comes primarily from foreigners who need to buy the country's exports, while supply comes from residents who need to buy foreign imports and assets. When a country's export revenues fall, there is less foreign currency flowing into the country and less demand for the domestic currency, causing it to depreciate.
Understanding the Question
The question asks how the fall in the oil price caused the fall in the value of the Colombian peso shown in Fig. 2. Fig. 2 shows the peso depreciating from around 1800–1900 pesos per US$ in 2012–2014 to nearly 3000 pesos per US$ by 2015. The candidate must explain the causal chain: oil price fall leads to lower export revenues, which reduces demand for the peso, causing depreciation.
Approach
Use a step-by-step chain of reasoning. Start with the fact that oil is half of Colombia's exports. A fall in oil price reduces the total value of exports. This means fewer US dollars are earned from exports, so there is less demand for pesos in the foreign exchange market. The reduced demand for pesos shifts the demand curve left, lowering the peso's value.
Step-by-Step Reasoning
- Oil accounts for half of Colombia's exports. When the oil price halves, the value of oil exports falls sharply even if the quantity exported remains stable.
- Exporters receive fewer US dollars for their oil. When they convert these dollars back to pesos, there is less demand for pesos in the foreign exchange market.
- Alternatively, foreign buyers need fewer pesos to purchase Colombian oil because the total value of purchases has fallen.
- This reduction in demand for the peso shifts the demand curve for pesos to the left.
- The result is a lower equilibrium exchange rate (more pesos per US$), meaning the peso has depreciated against the dollar.
- Fig. 2 confirms this: the line trends downwards on the inverted scale, meaning the peso buys fewer dollars.
Key Takeaways
- Exchange rates are determined by currency demand and supply.
- Export revenues directly affect currency demand.
- A fall in export earnings causes currency depreciation in a floating exchange rate system.
Common Mistakes
- Confusing the inverted scale in Fig. 2 (a downward trend represents depreciation).
- Saying the supply of pesos increased rather than demand decreased (both are valid mechanisms, but demand decrease is more direct here).
- Forgetting to link the oil price specifically to Colombia's export revenue.
Things to Be Careful About
- The question asks specifically about the mechanism from oil price to peso value, not just general exchange rate determination.
- Use the extract's data: oil is half of exports, so the effect is large.
- Fig. 2 uses an inverted scale; explain that a downward movement represents depreciation.
With the help of production possibility curve diagram(s), explain how the ‘peace dividend’ might lead to the growth of Colombia’s economy.
Answer
The peace dividend enables the Colombian government to reduce military expenditure and reallocate resources towards the production of capital goods (such as machinery and infrastructure) or towards human capital development (education and training). This increases the economy's productive capacity.
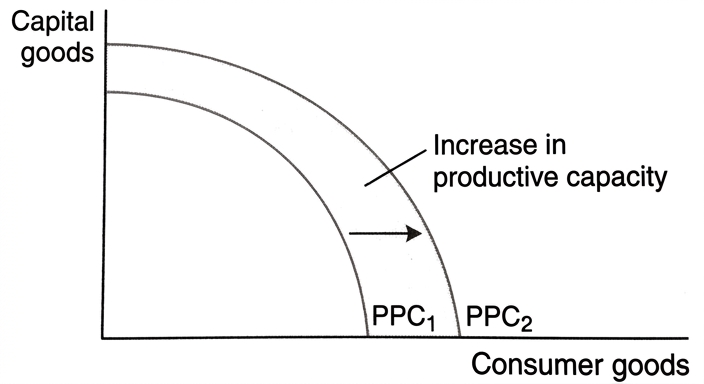
The diagram shows a production possibility curve. The horizontal axis represents consumer goods and the vertical axis represents capital goods. The initial PPC (PPC1) is bowed out from the origin. The outward shift to PPC2 represents the increased productive capacity resulting from the peace dividend. The economy can now produce more of both types of goods, indicating economic growth.
Resources reallocated from military to capital goods/human capital shift the PPC outward, increasing productive capacity and enabling higher output (economic growth).
Background Concept
A production possibility curve (PPC) shows the maximum possible output combinations of two goods an economy can produce when all resources are fully and efficiently employed. Economic growth occurs when the economy's productive capacity increases, shifting the PPC outward. This can be caused by an increase in the quantity or quality of resources, or by technological improvement. The reallocation of existing resources from one use to another—such as from military to civilian production—can increase the output of specific goods, though sustained growth requires an increase in overall capacity through capital accumulation or human capital improvement.
Understanding the Question
The question asks how the 'peace dividend' might lead to the growth of Colombia's economy, using PPC diagram(s). The peace dividend refers to the economic benefit from reduced military spending as the government ends its conflict with rebels. The candidate must explain how resources previously used for military purposes can be reallocated to produce capital goods or improve human capital, thereby shifting the PPC outward and enabling higher output.
Approach
Draw a PPC showing the trade-off between military goods (or current consumption) and capital goods (or future consumption). Show how reduced military spending frees resources that can be used to produce more capital goods. Explain that increased capital goods production or better education and training raises productive capacity, shifting the PPC outward. This represents economic growth because the economy can now produce more of all goods than before.
Step-by-Step Reasoning
- Define the PPC: it illustrates the maximum output combinations given current resources and technology.
- Identify the resource reallocation: the peace dividend means the government spends less on the military. The resources (labour, capital, raw materials) previously employed in the military sector become available for other uses.
- Show the diagram: draw a PPC with, for example, 'Consumer goods' on the horizontal axis and 'Capital goods' on the vertical axis. Show the initial curve PPC1.
- Explain the shift: the freed resources allow increased production of capital goods (machinery, infrastructure) or human capital (education, training). This increases the economy's productive capacity.
- Draw PPC2 shifted outward from PPC1.
- Link to growth: the outward shift means the economy can now produce higher quantities of both consumer and capital goods than before. This is economic growth—an increase in the economy's potential output.
- Clarify: while the immediate effect is a movement along the PPC toward more capital goods, the subsequent accumulation of capital shifts the entire PPC outward.
Key Takeaways
- The PPC illustrates productive capacity and opportunity cost.
- Economic growth is represented by an outward shift of the PPC.
- Resource reallocation from military to productive uses can increase capital formation and shift the PPC.
- Human capital investment (education) also shifts the PPC outward.
Common Mistakes
- Drawing a movement along the PPC and calling it growth (growth is a shift of the curve).
- Forgetting to label axes and curves.
- Not explaining the link between reduced military spending and increased productive capacity.
- Using a PPF without showing the outward shift.
Things to Be Careful About
- The diagram must show an outward shift, not just a movement along the curve.
- Explain that the peace dividend provides resources for capital goods or human capital, which raises future productive capacity.
- Ensure the diagram is clearly labelled with PPC1 and PPC2 and the direction of shift.
Use the information to explain how each of the components of aggregate demand in Colombia has been affected by the fall in the price of oil.
Answer
-
Consumption (C): Has fallen because the collapse in oil prices has reduced business profits and household incomes in oil-dependent areas such as Puerto Gaitan. The fall in spending by entrepreneurs and the departure of 10,000 people indicate reduced consumer spending. Additionally, the government has raised taxes to maintain its budget, further reducing disposable income.
-
Investment (I): Has fallen due to the sharp decline in economic activity in the oil industry. The text describes how business profits have fallen in Puerto Gaitan, leading to closed stores and empty car parks, indicating a reduction in planned capital expenditure by firms.
-
Government expenditure (G): Has fallen because oil accounts for a fifth of government revenues. The text states that every US$1 drop in the oil price cuts an estimated US$200 million from revenues, forcing the government to cut spending to keep the budget deficit down.
-
Net exports (X - M): Have fallen because oil accounts for half of Colombia's exports. The halving of crude oil prices has drastically reduced export revenues, contributing to a current account deficit of 7% of national income. Although the depreciation of the peso may eventually boost other exports, the immediate effect of the oil price fall has been a reduction in net exports.
C, I, G and (X-M) have all fallen due to reduced oil revenues, lower profits/incomes, higher taxes, and reduced government spending respectively.
Background Concept
Aggregate demand (AD) represents the total demand for an economy's output at different price levels. It is composed of four components: Consumption (C) by households, Investment (I) by firms, Government expenditure (G), and Net exports (X - M), where AD = C + I + G + (X - M). A fall in any of these components will shift the AD curve to the left, reducing real output and the price level in the economy.
Understanding the Question
The question asks how each component of AD in Colombia has been affected by the fall in the oil price. The extract provides specific evidence: falling business profits and spending in Puerto Gaitan (affecting C and I), reduced government revenues and spending cuts (affecting G), and the collapse in oil exports (affecting X-M). The candidate must link each piece of evidence to the relevant AD component.
Approach
Systematically address each of the four AD components in turn, using specific evidence from the extract to explain the direction and magnitude of the change. Ensure each explanation clearly links the oil price fall to the component.
Step-by-Step Reasoning
- Consumption (C): The fall in oil prices has reduced incomes in oil-dependent regions. The text states that business profits have fallen in Puerto Gaitan, leading to reduced spending by entrepreneurs. With 10,000 people leaving the town, consumer spending has clearly declined. Additionally, the government raised taxes to maintain its budget, reducing disposable income. Both factors shift AD leftward.
- Investment (I): Investment has fallen because the oil industry contraction has reduced business confidence and expected profitability. The closure of stores and empty car parks in Puerto Gaitan indicate that firms are not investing in new capital. This reduction in planned investment shifts AD leftward.
- Government expenditure (G): The government has cut spending because oil revenues (a fifth of total revenues) have fallen. The extract quantifies this: every US$1 drop cuts US$200 million from revenues. This forced austerity reduces G, shifting AD leftward.
- Net exports (X - M): Since oil accounts for half of Colombia's exports, the halving of oil prices has drastically reduced export revenues. Even if non-oil exports rise due to peso depreciation, the immediate effect is a large fall in X. The current account deficit has widened to 7% of national income, confirming that net exports have fallen. This shifts AD leftward.
Key Takeaways
- AD has four components: C, I, G, and (X-M).
- External shocks (like commodity price falls) can affect all components simultaneously.
- Always use extract data to support each point.
Common Mistakes
- Explaining only two or three components when all four are required for full marks.
- Describing the components without linking them to the oil price fall.
- Quoting figures without interpreting them (for example, saying exports fell without linking to oil price).
- Confusing the current account deficit with the trade balance.
Things to Be Careful About
- The question asks how each component has been affected; address all four separately.
- Note that while the peso depreciation may eventually boost non-oil exports, the immediate effect of the oil price fall on net exports is negative.
- Use specific evidence: Puerto Gaitan for C and I, the US$200 million figure for G, and the 7% deficit for (X-M).
The fall in the value of the Colombian peso shown in Fig. 2 is expected to reduce Colombia’s current account deficit.
Discuss any factors that will determine whether the fall in the value of the peso will have this effect.
Answer
The effect of the peso's depreciation on the current account deficit depends on several factors:
Price elasticity of demand (Marshall-Lerner condition): The depreciation will only reduce the current account deficit if the sum of the price elasticity of demand for Colombia's exports and imports exceeds 1. If demand for Colombia's exports (e.g., coffee, textiles) and imports is price inelastic, the fall in the value of exports and the rise in the cost of imports could initially worsen the trade balance.
Time period (J-curve effect): In the short run, the current account may deteriorate because trade volumes are fixed by existing contracts and consumers cannot immediately switch to alternative goods. Over time, as quantities adjust to the new prices, the trade balance may improve. The text notes that the depreciation "could reverse" the deficit, suggesting a longer-term improvement.
Reaction of competitors: If Colombia's competitors also devalue their currencies or maintain low prices, Colombia may not gain a significant price advantage in world markets, limiting the boost to export volumes.
In conclusion, the depreciation is likely to reduce the current account deficit only if the Marshall-Lerner condition is satisfied and sufficient time is allowed for the J-curve adjustment. If demand is inelastic or competitors match the depreciation, the effect may be negligible or even adverse in the short run.
The depreciation will reduce the current account deficit only if the Marshall-Lerner condition is satisfied and the time period is sufficiently long for the J-curve effect to wear off; otherwise it may be ineffective or worsen the deficit in the short run.
Background Concept
The balance of payments records a country's transactions with the rest of the world. The current account balance equals exports minus imports of goods and services, plus net income and transfers. A depreciation of the exchange rate makes exports cheaper and imports more expensive, which should improve the current account—but only under certain conditions. The Marshall-Lerner condition states that depreciation improves the trade balance only if the sum of the price elasticity of demand for exports and imports is greater than 1. Additionally, the J-curve effect suggests that the trade balance may initially deteriorate after depreciation because import contracts are fixed in the short run and export volumes take time to adjust.
Understanding the Question
The question asks the candidate to discuss factors determining whether the fall in the peso's value will reduce Colombia's current account deficit (which is 7% of national income). The candidate must evaluate the conditions under which exchange rate depreciation improves the current account, using economic theory and the context of Colombia's economy.
Approach
Identify the key factors that determine the effectiveness of depreciation:
- Price elasticities of demand for exports and imports (Marshall-Lerner condition).
- Time period (J-curve effect).
- Price elasticity of supply of exports (ability to increase output).
- Reactions of trading partners or competitors.
Then weigh these factors to reach a judgement about whether the depreciation is likely to succeed.
Step-by-Step Reasoning
- Marshall-Lerner condition: For depreciation to reduce the deficit, the percentage rise in export volume plus the percentage fall in import volume must exceed the percentage rise in import prices and fall in export prices. If Colombia's exports (coffee, textiles, flowers) have elastic demand and imports have elastic demand, the condition is met. If demand is inelastic, the effect is uncertain.
- Time period (J-curve): In the short run, the value of imports may rise (because contracts are fixed in dollars and quantities do not adjust immediately) while export values fall, worsening the deficit. Over time, as Colombian exporters gain price competitiveness and importers switch to domestic substitutes, the trade balance improves. The text says the depreciation "could reverse" the deficit, implying a longer-term view.
- Price elasticity of supply of exports: Even if demand is elastic, if Colombian producers cannot quickly increase output of coffee, textiles, and so on due to capacity constraints, the export volume may not rise enough to improve the trade balance.
- Competitor reactions: If other Latin American countries also experience currency depreciation, Colombia may not gain a competitive advantage. The text mentions exporting to the United States "if not to its immediate neighbours," suggesting regional competitors might limit the benefit.
Judgement: The depreciation is likely to reduce the current account deficit in the medium term if the Marshall-Lerner condition is satisfied (which is plausible for non-oil exports like textiles and flowers) and if the J-curve effect is allowed to work through. However, in the short run, the deficit may worsen. The effectiveness also depends on whether Colombia's competitors devalue simultaneously.
Key Takeaways
- Exchange rate depreciation does not automatically improve the current account.
- The Marshall-Lerner condition is the key theoretical constraint.
- The J-curve effect distinguishes short-run from long-run outcomes.
- Competitor reactions and supply-side capacity matter in open economies.
Common Mistakes
- Assuming depreciation always improves the current account (ignoring Marshall-Lerner).
- Forgetting the J-curve effect and the short-run deterioration.
- Discussing only one side (for example, only the benefits of depreciation).
- Not reaching a justified conclusion.
Things to Be Careful About
- The question asks about the current account deficit, not just the trade balance. Include services and income if relevant, though the extract focuses on goods.
- Use the extract's context: Colombia's main exports are diversifying beyond oil, which may have different elasticity characteristics.
- Ensure the conclusion is justified and specific to the question.
The rest of this paper
3 more questions- Q2Classification of Goods and Services · Methods of Government Intervention in Markets · Demand and Supply · Elasticities of Demand20M
- Q3Demand and Supply · Market Equilibrium and the Price Mechanism · Methods of Government Intervention in Markets · Price Stability20M
- Q4Exchange Rates · Price Stability · Supply-Side Policy20M