Economics 9708/22 — October/November 2016
Cambridge AS Level · AS Level Data Response and Essays · worked solutions for every part, with the mark scheme
Topics Elasticities of Demand · Supply-Side Policy · Balance of Payments · Protectionism · Demand and Supply · Market Equilibrium and the Price Mechanism · +6 more
Free Trade and Protectionism
The US wins World Trade Organisation (WTO) trade enforcement disputes
The US has won a major victory at the WTO on behalf of the nation’s farmers and the poultry industry. The WTO found in favour of the US in a dispute challenging India’s ban on agricultural imports from the US such as poultry, meat, eggs and live pigs, allegedly to protect India from the spread of disease. The panel agreed that India’s ban broke international trade rules and was imposed without sufficient scientific evidence.
This is the fourth major WTO victory that the US has announced this year. The US government is determined to extend economic opportunity for US workers, farmers and businesses.
Earlier US victories at the WTO in 2014 were:
- In June, the WTO found that China broke rules by imposing unjustified extra import duties on US cars. In 2013, an estimated US$5.1 billion of US car exports were covered by those duties.
- In August, the WTO found that China broke WTO rules by imposing quotas on Chinese exports of tungsten and molybdenum. These are important raw material inputs used by US manufacturers of products such as car batteries, wind turbines, energy-efficient lighting, steel, petroleum and chemicals.
- Also in August, the WTO agreed with the US that Argentina’s import-licensing requirement and other import restrictions broke international trade rules. The Argentine measures unfairly restricted imports of US goods, potentially affecting billions of dollars of US exports, including computers, industrial and agricultural chemicals, transport equipment, machine tools, parts for oilfield rigs and refined fuel oil.
Source: The Prairie Star, 19 October 2014
Table 1: US Trade in Goods with India 2009–2014
| 2009 | 2010 | 2011 | 2012 | 2013 | 2014 | |
|---|---|---|---|---|---|---|
| Exports (US$ millions) | 16 441 | 19 249 | 21 542 | 22 106 | 21 842 | 23 600 |
| Imports (US$ millions) | 21 166 | 29 533 | 36 155 | 40 513 | 41 845 | 45 228 |
Source: US Census Bureau
Compare the US balance of trade with India in 2009 with that in 2014.
Answer
The US had a trade deficit with India in both years. The deficit was $4,725 million in 2009 (exports $16,441 million minus imports $21,166 million) and increased to $21,628 million in 2014 (exports $23,600 million minus imports $45,228 million).
The US trade deficit with India increased from $4,725 million in 2009 to $21,628 million in 2014.
Background Concept
The balance of trade in goods is the value of exports of goods minus the value of imports of goods. A negative balance is called a trade deficit. The question requires comparing the US balance of trade with India in two years using the data in Table 1.
Understanding the Question
The question asks you to compare the US balance of trade with India in 2009 and 2014. It is essential to use the term 'deficit' and to state that the deficit has grown or worsened. Simply showing figures with a negative sign without mentioning 'deficit' will not earn marks, as per the mark scheme.
Approach
Calculate the trade balance for 2009 and 2014 by subtracting imports from exports. Then compare the two balances, noting the direction of change.
Step-by-Step Reasoning
- 2009: Exports = $16,441 million, Imports = $21,166 million. Balance = 16,441 - 21,166 = -$4,725 million (a deficit).
- 2014: Exports = $23,600 million, Imports = $45,228 million. Balance = 23,600 - 45,228 = -$21,628 million (a larger deficit).
- The deficit has increased by $16,903 million.
Key Takeaways
- Always calculate the balance accurately.
- Use the correct economic terminology: 'deficit' or 'surplus'.
- State the direction of change (increased, decreased, worsened).
Common Mistakes
- Not using the term 'deficit' and just giving numbers.
- Only stating the figures without a comparison.
- Confusing exports and imports.
Things to Be Careful About
- Ensure you subtract imports from exports, not the other way around.
- Use the correct units ($ millions).
- The mark scheme clearly states that without the word 'deficit' no marks are awarded, even if the figures are correct.
Explain two factors, other than India’s ban on US agricultural products, that could explain the change in the US balance of trade that you have identified.
Answer
Factor 1: Depreciation of the Indian rupee against the US dollar. A weaker rupee makes Indian exports cheaper in the US, increasing US imports from India, and makes US exports more expensive in India, reducing US exports to India. This worsens the US trade deficit.
Factor 2: Faster economic growth in the US relative to India. Higher US income leads to a greater increase in demand for imports from India, while slower Indian income growth limits demand for US exports. The resulting faster growth of US imports than exports worsens the deficit.
Two factors that explain the worsening US trade deficit with India are: depreciation of the Indian rupee and faster US economic growth relative to India.
Background Concept
The balance of trade is affected by factors that change the demand for exports and imports. The exchange rate and income levels are key determinants. A depreciation of the importing country's currency makes its exports cheaper and imports more expensive. Higher income in one country increases its demand for imports.
Understanding the Question
The question asks for two factors, other than India's ban on agricultural products, that could explain the change in the US balance of trade (i.e., the worsening deficit). The factors must explain why the deficit has grown, not just why there is a deficit. The mark scheme awards up to 2 marks per factor: 1 mark for identifying the factor, 1 mark for explaining how it contributes to the worsening deficit.
Approach
Choose two distinct factors. For each, clearly state the factor and then explain the causal chain that leads to a larger deficit. Avoid factors that only explain the existence of a deficit without showing an increase.
Step-by-Step Reasoning
Factor 1: Depreciation of the Indian rupee
- If the rupee depreciates, Indian goods become cheaper in US dollars (since US dollars buy more rupees). This increases US demand for Indian imports, raising the value of US imports from India.
- At the same time, US goods become more expensive in rupees, so Indian demand for US exports falls, reducing US exports to India.
- The combined effect is a larger trade deficit (or smaller surplus) for the US.
- The extent of the change depends on the price elasticities of demand for imports and exports.
Factor 2: Faster economic growth in the US than in India
- As US income rises, US consumers spend more on all goods, including imports from India. This increases the value of US imports.
- If Indian income grows more slowly, Indian demand for US exports grows less rapidly.
- The result is that US imports rise faster than US exports, worsening the trade deficit.
Key Takeaways
- Factors must be linked to the change in the deficit, not just the level.
- Use a clear chain of reasoning: factor -> effect on exports/imports -> impact on trade balance.
- The mark scheme allows factors such as exchange rates, income growth, changes in tastes, efficiency improvements, or tariffs.
Common Mistakes
- Identifying a factor that only explains the deficit in one year, not the change (e.g., just saying 'India has a comparative advantage' without explaining why the deficit grew).
- Not explaining the mechanism clearly.
- Using a factor that also applies to the ban (e.g., 'other trade restrictions' without specifying how they changed).
Things to Be Careful About
- The factors must be 'other than India's ban on US agricultural products', so avoid that.
- Ensure the explanation shows how the factor has worsened the deficit over time, not just why the deficit exists.
- The mark scheme warns that if the factor only explains the deficit but not the change, maximum 1+1 marks (i.e., 1 mark for each factor without the explanation of the change).
In addition to the balance of trade in goods, what other balances would you require to calculate the US current account balance with India?
Answer
The other balances required to calculate the US current account balance with India are:
- Balance on trade in services
- Balance on primary income (or income from investments and employment)
- Balance on secondary income (or current transfers)
(Any two of these are sufficient.)
Balance on trade in services and balance on primary income (or secondary income).
Background Concept
The current account of the balance of payments records all transactions in goods, services, primary income (e.g., profits, interest, dividends, and wages earned by residents abroad), and secondary income (e.g., transfers, remittances, foreign aid). The balance of trade in goods is only one part.
Understanding the Question
The question asks for the other balances needed to calculate the current account balance, given the balance of trade in goods. The mark scheme awards 1 mark for each correct component, up to 2 marks. Acceptable answers include: balance on services, balance on income, balance on current transfers, or references to primary and secondary income.
Approach
List the two other main components of the current account.
Step-by-Step Reasoning
- The current account balance = (balance on trade in goods) + (balance on trade in services) + (balance on primary income) + (balance on secondary income).
- Therefore, besides the goods balance, we need the services balance, primary income balance, and secondary income balance. Any two of these are sufficient for the marks.
Key Takeaways
- The current account includes more than just goods.
- 'Invisibles' is a broad term that covers services and income, but is only worth 1 mark if not further elaborated.
Common Mistakes
- Listing only different types of services (e.g., banking, transport) instead of the broad categories.
- Forgetting to include income or transfers.
- Confusing the current account with the capital/financial account.
Things to Be Careful About
- The mark scheme allows 'primary and secondary income' as alternatives.
- Do not list the capital account or financial account; they are not part of the current account.
Use a diagram to show how an import duty on a product affects its price.
Answer
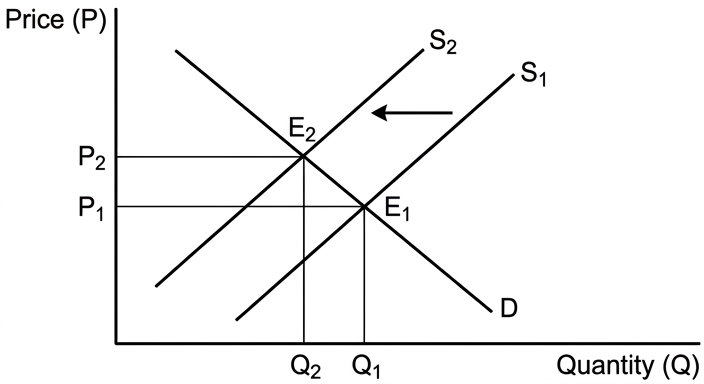
The diagram shows a supply and demand diagram. The import duty shifts the supply curve leftwards from S1 to S2, increasing the equilibrium price from P1 to P2 and reducing the quantity from Q1 to Q2.
The diagram shows the supply curve shifting left due to the import duty, raising the price from P1 to P2.
Background Concept
An import duty (tariff) is a tax on imported goods. In a standard supply and demand diagram for a domestic market, the supply curve represents the domestic supply plus imports. The duty increases the cost of imports, effectively shifting the supply curve leftwards (or upwards) by the amount of the duty. This raises the equilibrium price and reduces the quantity traded.
Understanding the Question
The question explicitly asks to use a diagram to show how an import duty affects price. The mark scheme accepts either a standard supply/demand diagram with a leftward shift of supply (like an indirect tax) or a trade diagram showing world supply and demand. No explanation is required, but the diagram must be accurate. If the diagram shows a price rise without a shift in supply, it scores 0 marks.
Approach
Draw a standard supply and demand diagram. Label axes: Price (P) and Quantity (Q). Draw a downward-sloping demand curve D and an upward-sloping supply curve S1. Indicate equilibrium at P1, Q1. Then draw a new supply curve S2 shifted left (or upwards) by the amount of the duty. The new equilibrium is at P2 (higher price) and Q2 (lower quantity).
Step-by-Step Reasoning
- Start with the initial equilibrium: D and S1 intersect at P1, Q1.
- The import duty increases the cost of supplying the good, so the supply curve shifts left to S2 (the vertical distance between S1 and S2 equals the duty per unit).
- The new equilibrium is at a higher price P2 and lower quantity Q2.
- The diagram should clearly show the shift and the new equilibrium.
Key Takeaways
- The import duty reduces supply, raising price and reducing quantity.
- The diagram must show a shift of the supply curve, not just a movement along it.
Common Mistakes
- Drawing a diagram that shows a price rise but no shift in supply (e.g., just moving along the demand curve).
- Not labelling axes or curves.
- Confusing a tariff with a quota (quota would shift the supply curve differently).
Things to Be Careful About
- The mark scheme says 'no explanation needed', but the diagram must be accurate. In the solution, we include a brief description to ensure the diagram is clear, but in the exam, the candidate would just draw the diagram.
- Ensure the shift is leftwards (or upwards), and the new equilibrium price is higher.
What is likely to determine the extent of the change in sales when an import duty is imposed on US cars in China?
Answer
The extent of the fall in sales depends on the price elasticity of demand (PED) for US cars in China. If demand is elastic (PED > 1), the price rise from the duty will cause a proportionally larger fall in quantity demanded, so sales fall significantly. If demand is inelastic (PED < 1), the fall in sales will be smaller. The size of the duty also matters: a larger duty causes a greater price increase and a larger fall in sales, ceteris paribus.
The fall in sales depends on the price elasticity of demand and the size of the import duty.
Background Concept
Price elasticity of demand (PED) measures the responsiveness of quantity demanded to a change in price. PED = % change in quantity demanded / % change in price. If PED > 1, demand is elastic; if PED < 1, demand is inelastic. An import duty increases the price of the good, so the quantity demanded falls. The extent of the fall depends on how sensitive consumers are to price changes.
Understanding the Question
The question asks what is likely to determine the extent of the change in sales when an import duty is imposed on US cars in China. The mark scheme awards 1 mark for recognising that it depends on PED, and 1 mark for explaining that the fall is greater if demand is elastic (or less if inelastic). Alternatively, the size of the duty is also acceptable for 1 mark.
Approach
Identify PED as the key determinant. Explain the relationship between elasticity and the change in sales. Also mention the size of the duty as a secondary factor.
Step-by-Step Reasoning
- The import duty raises the price of US cars in China.
- The change in quantity demanded (sales) = PED * % change in price, approximately.
- If PED is high (elastic), consumers are very responsive to price increases, so sales fall a lot.
- If PED is low (inelastic), consumers are less responsive, so sales fall only a little.
- The size of the duty also matters: a larger duty causes a larger price increase, leading to a larger fall in sales, regardless of elasticity.
Key Takeaways
- PED is crucial in determining the impact of a tariff on sales.
- The relationship is proportional: more elastic demand -> larger fall in sales.
Common Mistakes
- Only stating 'depends on PED' without explaining the relationship.
- Confusing PED with other elasticities (YED, XED).
- Not mentioning the size of the duty as a factor.
Things to Be Careful About
- The mark scheme allows 1 mark for mentioning the size of the duty, but the main factor is PED.
- Ensure the explanation is clear: 'greater fall if demand is elastic' or 'smaller fall if demand is inelastic'.
Explain a possible reason why China imposed export quotas on tungsten and molybdenum.
Answer
One possible reason is to increase the export price and earn higher revenue. By restricting the quantity of tungsten and molybdenum exported, China reduces the supply to the world market, raising the world price. If demand for these materials is relatively inelastic, total export revenue can increase. Additionally, raising the price of these raw materials increases costs for foreign manufacturers, giving Chinese producers a competitive advantage in downstream products such as car batteries and wind turbines.
China likely imposed export quotas to raise export prices, increase revenue, and benefit domestic downstream industries.
Background Concept
An export quota is a restriction on the quantity of a good that can be exported. It reduces the supply of the good on the world market, which tends to increase the world price. This can benefit the exporting country if it has market power and if demand is inelastic, as total revenue may rise. It can also give domestic industries access to cheaper inputs (if the quota is on raw materials) and protect domestic users from high prices.
Understanding the Question
The question asks to explain a possible reason why China imposed export quotas on tungsten and molybdenum. The mark scheme awards 2 marks for a valid reason that is explained. Acceptable reasons include: to raise export prices and increase revenue, to preserve scarce resources for domestic industry, to reduce production due to environmental impact, or to give an advantage to domestic manufacturers.
Approach
Choose the most straightforward reason: to increase export revenue. Explain the chain: quota reduces supply -> price rises -> revenue increases if demand is inelastic. Also mention the competitive advantage for domestic industry.
Step-by-Step Reasoning
- China is a major producer of tungsten and molybdenum, so it has market power.
- By limiting the quantity exported, the supply on the world market falls, which pushes up the world price.
- If the demand for these materials is price inelastic (they are essential inputs), the percentage increase in price exceeds the percentage decrease in quantity, so total export revenue rises.
- Additionally, the higher price of these inputs raises costs for foreign manufacturers (e.g., US car battery makers), making Chinese manufacturers who have access to the materials at home more competitive.
Key Takeaways
- Export quotas can be used to increase revenue if the country has market power.
- The effect on revenue depends on price elasticity of demand.
- Quotas can also be used to protect domestic industries.
Common Mistakes
- Confusing export quotas with import quotas.
- Not explaining the mechanism, just stating a vague reason like 'to protect domestic industry' without showing how.
- Ignoring the condition of inelastic demand for the revenue argument.
Things to Be Careful About
- The reason must be plausible and well explained.
- The mark scheme also accepts preserving scarce resources, but the revenue reason is strong.
- Use the extract's context: the materials are used in car batteries, wind turbines, etc., so the downstream advantage is relevant.
Consider whether the protectionist measures adopted by countries such as India, China and Argentina regarding trade with the US could ever be justified.
Answer
Arguments for protectionism: The infant industry argument suggests that temporary protection can help new domestic industries develop economies of scale and become competitive. India could argue its ban protects food safety and farmers from disease, though the WTO found insufficient scientific evidence. China may argue that export quotas on tungsten and molybdenum preserve scarce resources for domestic industry, supporting industrialisation. Argentina might argue that import restrictions protect domestic employment and address balance of payments problems.
Arguments against protectionism: Protectionism reduces consumer choice and raises prices, harming consumers. It leads to inefficient allocation of resources, as countries produce goods they do not have a comparative advantage in. It risks retaliation and trade wars, which reduce overall trade and harm all countries involved. The WTO rulings in the extract show that these measures were deemed unjustified, lacking scientific evidence, and breaking trade rules, undermining the rules-based trading system.
Conclusion: Protectionist measures can sometimes be justified in specific circumstances, such as for infant industries or to protect health, but only if they are temporary, transparent, and based on sound evidence. In the cases described, the measures were imposed without sufficient justification and were found to break WTO rules, suggesting they were not justified. Therefore, on balance, these particular protectionist measures are not justified, but protectionism can be justified under certain conditions.
The protectionist measures adopted by India, China, and Argentina are not justified in these specific cases because they lacked evidence and broke WTO rules, but protectionism can be justified in other circumstances such as infant industry protection.
Background Concept
Protectionism refers to government policies that restrict international trade to protect domestic industries from foreign competition. Common arguments for protectionism include: infant industry protection, protecting domestic employment, preserving national security, correcting balance of payments deficits, and retaliating against unfair trade practices. Arguments against protectionism include: loss of consumer welfare, inefficient resource allocation, retaliation, and reduced global trade and income.
Understanding the Question
The question asks to consider whether the protectionist measures (India's ban, China's export quotas, Argentina's import restrictions) could ever be justified. The mark scheme allocates up to 3 marks for arguments in favour, up to 3 marks for arguments against, with a maximum of 5 marks for the combined arguments, and 1 mark reserved for a reasoned conclusion. The answer must be two-sided and include a conclusion that specifically addresses the question of whether these measures could ever be justified.
Approach
Present both sides: first, the arguments that could be used to justify the measures (e.g., infant industry, health protection, resource preservation, employment). Then, present the counterarguments (e.g., loss of consumer welfare, inefficiency, retaliation, WTO illegality). Finally, reach a conclusion that weighs the arguments and gives a judgement. Use the extract's examples to support the arguments.
Step-by-Step Reasoning
Arguments for:
- Infant industry: new industries in developing countries may need temporary protection to compete with established foreign firms. India's agricultural sector might need protection to develop.
- Health and safety: India's ban was ostensibly to protect against disease, though the WTO disagreed. If there were genuine scientific evidence, it could be justified.
- Resource preservation: China's export quotas conserve scarce tungsten and molybdenum for domestic use, ensuring long-term supply for its own industries.
- Employment and balance of payments: Argentina's import restrictions could protect domestic jobs and reduce trade deficits.
Arguments against:
- Consumer welfare: tariffs and quotas raise prices, reducing consumer surplus.
- Inefficiency: protectionism shelters inefficient domestic industries, distorting resource allocation and reducing global output.
- Retaliation: other countries may retaliate, leading to trade wars that harm everyone. The US won multiple WTO cases, showing that these measures provoked legal action.
- WTO rules: the measures were found to break trade rules, undermining the rules-based system that promotes global trade.
Conclusion:
The question asks 'could ever be justified'. The answer must acknowledge that in principle, protectionism can be justified under certain conditions (e.g., infant industry, genuine health risks). However, in the specific cases described, the measures were not justified because they lacked evidence and violated WTO rules. Therefore, the answer is: these particular measures are not justified, but protectionism can be justified in other contexts.
Key Takeaways
- A two-sided evaluation is required; a one-sided answer will lose marks.
- The conclusion must be reasoned and directly answer the question.
- Use the extract's evidence to support the arguments (e.g., WTO rulings, the products involved).
Common Mistakes
- Only presenting arguments for or against, not both.
- Providing a conclusion that is a simple summary without a judgement.
- Not using the extract's examples to ground the discussion.
- Not reserving a mark for the conclusion (i.e., not including a clear conclusion).
Things to Be Careful About
- The question asks 'could ever be justified', so the answer should consider both the possibility of justification in general and the specific cases.
- The mark scheme reserves 1 mark for a reasoned conclusion, so it must be explicit and justified.
- Ensure the arguments are developed and explained, not just listed.
The rest of this paper
3 more questions- Q2Demand and Supply · Market Equilibrium and the Price Mechanism · Elasticities of Demand · Classification of Goods and Services20M
- Q3Price Elasticity of Supply · Supply-Side Policy20M
- Q4(Legacy) - Money · Price Stability · Fiscal Policy · Monetary Policy · Supply-Side Policy20M