Economics 9708/23 — May/June 2016
Cambridge AS Level · AS Level Data Response and Essays · worked solutions for every part, with the mark scheme
Topics International Trade and Comparative Advantage · Balance of Payments · Exchange Rates · Elasticities of Demand · Price Stability · Aggregate Demand and Aggregate Supply · +2 more
China’s economy and Australia’s trade
Extract 1: China’s record trade surplus is bad news for Australian miners
China had an overall trade surplus of almost US$50 billion in August 2014, a record balance. However, that is bad news for countries such as Australia, which exports large amounts of raw materials and whose biggest trading partner is China. China’s surplus came not only from a 9.4% annual rise in exports, but also from a 2.4% fall in its imports. This has created a problem for Australia’s balance of payments.
Of particular relevance to Australia, the fall in China’s imports was a cause of a steep decline in iron ore prices, with the price hitting a five-year low of US$83.60 a tonne. Australia’s iron ore exports dropped 9.3% in August compared with July. There was also an 18.1% slump in China’s imports of coal between July and August.
Meanwhile, a construction industry slowdown in China is starting to reduce demand for building materials such as steel, and this is reducing the demand for iron ore and hence its price. It is not expected that the situation will change soon, but some analysts are hopeful that China will introduce some stimulus to maintain growth near its 7.5% target.
This represents an interesting dilemma for China’s policymakers: the situation calls for more expansionary policies, for example lower interest rates, but, at the same time, strong exports and a record current account surplus will put pressure on policymakers to let the currency rise.
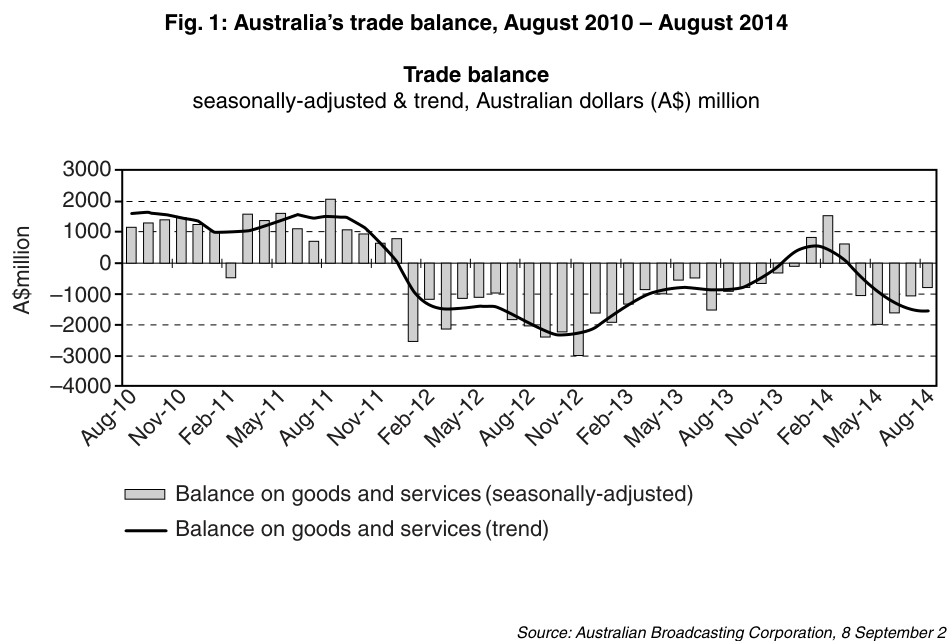
Fig. 1: Australia’s trade balance, August 2010 – August 2014
Source: Australian Broadcasting Corporation, 8 September 2014
Table 1: Australia’s terms of trade, July 2011 – July 2014
| Year | Terms of Trade Index |
|---|---|
| 2011 qtr* 3 | 106.5 |
| qtr 4 | 102.0 |
| 2012 qtr 1 | 96.8 |
| qtr 2 | 96.3 |
| qtr 3 | 91.1 |
| qtr 4 | 88.5 |
| 2013 qtr 1 | 91.3 |
| qtr 2 | 90.4 |
| qtr 3 | 87.5 |
| qtr 4 | 88.2 |
| 2014 qtr 1 | 87.0 |
| qtr 2 | 83.4 |
*quarter
Source: Australian Bureau of Statistics
Calculate the approximate change in Australia’s trade balance between August 2010 and August 2014.
Use a supply and demand diagram to show how the trend in Australia’s trade balance over this period would be expected to influence the value of Australia’s exchange rate.
What other information would be required to measure the change in Australia’s current account on the balance of payments over this period?
Suggest a change in the prices of exports and imports that might account for the change in the Australian terms of trade between 2011 quarter 3 and 2014 quarter 2.
Explain who in China would lose and who in China would benefit if China’s exchange rate were allowed to rise.
Discuss whether lower interest rates in China or a rise in China’s exchange rate is more likely to help solve Australia’s balance of payments problems.
The rest of this paper
3 more questions- Q2Elasticities of Demand20M
- Q3Price Stability · Aggregate Demand and Aggregate Supply20M
- Q4Production Possibility Curves · International Trade and Comparative Advantage · Protectionism20M