Economics 9708/22 — May/June 2015
Cambridge AS Level · AS Level Data Response and Essays · worked solutions for every part, with the mark scheme
Topics Exchange Rates · Production Possibility Curves · Supply-Side Policy · Economic Methodology · Elasticities of Demand · Classification of Goods and Services · +3 more
Economic prospects reverse in Latin America
Over the past decade, Brazil boomed and grew rich by selling raw materials to China. Brazil’s economy averaged 3.6% annual growth, peaking at a rate of 7.5% in 2010. Its currency, the Brazilian Real, substantially increased in value.
By comparison, Mexico saw lower growth, partly because it was tied to a faltering United States (US) economy. Mexico also suffered from deep problems of its own, for example, a poor education system and a rise in violent crime, deterring tourists and investors. Mexico’s economy averaged 2.6% annual growth over the past decade, while its currency, the Mexican Peso, fell slightly in value.
From 2011, it was Brazil’s turn to struggle as China’s demand for its raw materials decreased. In 2013 alone, Brazil’s currency depreciated by more than 10%. The Brazilian Government largely wasted the boom years, investing little in roads and other infrastructure that could have supported its development. In addition, many households borrowed money to finance a consumer boom including a rapid rise in imports of luxuries from the US. As a result, a significant trade deficit in goods and services developed.
Meanwhile, the Mexican Government used the past decade to significantly strengthen its economy, improving the education system and making its telecommunications, financial and energy sectors more efficient. Economists now expect the country to grow more rapidly when Mexico’s biggest trading partner, the US, recovers economically. Also, Mexico exports manufactured goods to a growing European market. At the same time, Mexico has maintained a relatively small trade deficit that can be financed easily by long-term foreign investment in its companies and factories.
Source: The Wall Street Journal, September 2013
Fig. 1: A Tale of Two Countries
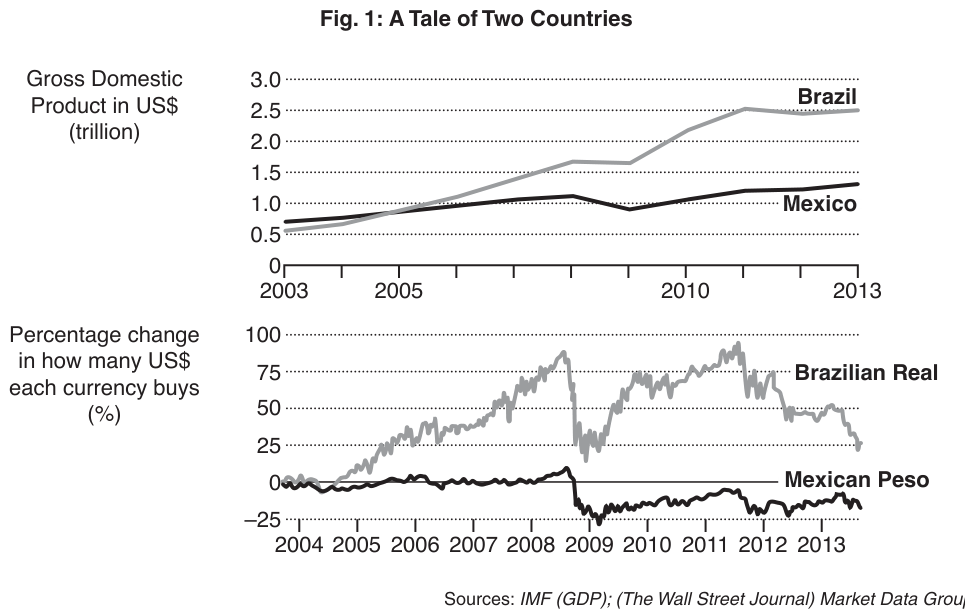
Sources: IMF (GDP); (The Wall Street Journal) Market Data Group
Use production possibility curves to compare Brazil’s economy in 2013 with its economy in 2003.
Using Fig. 1, explain what has happened to the value of the Brazilian Real in 2013 compared with 2004.
Explain one possible reason for the stability of the Mexican Peso from 2004 to 2008 shown in Fig. 1.
With the help of diagrams, explain how the different economic experiences of Brazil and Mexico after 2011 mentioned in the text could explain the changes in currency values shown in Fig. 1.
Explain how the approach of the Mexican Government ‘during the past decade’ is more likely to generate an expansion of the economy than the approach of the Brazilian Government during this period.
Identify and evaluate the usefulness of any further information that might be helpful in assessing the future prospects of the Brazilian and Mexican economies.
The rest of this paper
3 more questions- Q2Elasticities of Demand20M
- Q3Classification of Goods and Services · Methods of Government Intervention in Markets20M
- Q4International Trade and Comparative Advantage · Exchange Rates · Price Stability20M