Economics 9708/21 — May/June 2015
Cambridge AS Level · AS Level Data Response and Essays · worked solutions for every part, with the mark scheme
Topics Supply-Side Policy · Demand and Supply · Market Equilibrium and the Price Mechanism · Elasticities of Demand · Aggregate Demand and Aggregate Supply · Price Elasticity of Supply · +5 more
United States reduces dependence on foreign oil
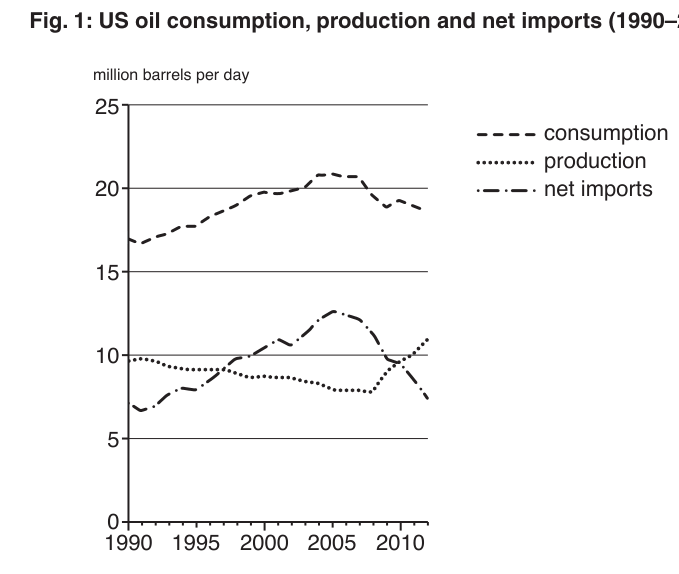
In 2001, a United States (US) energy report warned that by 2020 the US could be importing two-thirds of its oil. If US oil consumption continued rising and production continued falling, imports would increase from 10 million barrels per day to about 17.5 million per day.
The forecasts were both wrong. US oil production has soared while consumption has fallen. It now looks more likely that the US will have only limited, if any, net oil imports by the end of the decade. China has now replaced the US as the world’s largest oil importing economy.
A new technique, known as hydraulic fracturing (fracking), has allowed access to new sources of oil in the US. As a result, US crude oil production has risen by 50% since 2008. In addition, the US now produces significant quantities of biofuel from corn ethanol. This is a substitute for gasoline (petrol) obtained from crude oil and its production has increased by more than 300% in recent years.
In addition to new US oil supplies, what has been happening to demand is just as important. Falling enthusiasm for cars among younger Americans has reduced the country’s need for oil. Fewer young people are learning to drive and there have been declines in vehicle ownership per household and the total distance driven. At the same time, US cars are now more fuel-efficient.
Fig. 1: US oil consumption, production and net imports (1990–2012)
Source: Adapted from the US Energy Information Administration ‘Energy Review’
Table 1: Annual average price of gasoline (petrol) in US
| Year | US$ per gallon including taxes |
|---|---|
| 2007 | 2.85 |
| 2008 | 3.32 |
| 2009 | 2.40 |
| 2010 | 2.84 |
| 2011 | 3.58 |
| 2012 | 3.70 |
| 2013 (March) | 3.79 |
Source: US Energy Information Administration
With reference to Fig. 1, explain the trend in US net imports of oil after 2005.
With the help of a diagram(s), explain how the new sources of crude oil from hydraulic fracturing and the ‘falling enthusiasm for cars among younger Americans’ might be expected to cause a fall in the price of gasoline (petrol) in the US.
Suggest and explain one factor that might have caused the price of gasoline (petrol) to rise in the US after 2009 despite these changes.
Explain the value that you would expect to find if you measured the relationship between gasoline (petrol) and biofuel using the concept of cross elasticity of demand.
Discuss how reducing dependence on foreign oil might affect aggregate demand in the US economy and the impact of this on prices and employment in the US.
The rest of this paper
3 more questions- Q2Price Elasticity of Supply · Methods of Government Intervention in Markets · Supply-Side Policy20M
- Q3Factors of Production · Supply-Side Policy20M
- Q4(Legacy) - Money · Price Stability · Balance of Payments20M