Economics 9708/41 — October/November 2025
Cambridge A-Level · A Level Data Response and Essays · worked solutions for every part, with the mark scheme
Topics Economic Growth and Sustainability · Equity, Poverty and Redistribution · Demand for and Supply of Labour · Wage Determination and Labour Market Intervention · Components of Aggregate Demand · The Multiplier and National Income Determination · +10 more
Working overseas
Many low-income countries have large proportions of the population below the World Bank’s absolute poverty level of $2.15 per day (United States dollars, 2022). One way in which these countries try to reduce their poverty is by the migration of workers to richer countries. The migrants send a portion of their incomes, known as remittances, back home to support their families.
These overseas workers are a link between migration and development. The flow of remittance money is greater than the foreign direct investment and official development aid received by middle-income and low-income countries. Total remittances received by those countries in 2022 was $650 billion, of which 45% ($293 billion) was received by only five countries.
About 50% of migrants from low-income countries went to high-income countries.
Migrants can find their incomes increase significantly. A nurse may make seven times more in Australia than in the Philippines, adjusted for purchasing power parity (PPP).
Unlike official aid, remittances flow directly to their receivers and are a stable source of income. They can buy extra food and they may provide savings for the receiver. They may reduce child labour in disadvantaged families and allow for higher spending on education through higher enrolments and more years of completed schooling.
Migration can reduce unemployment and raise wages in home countries. Migration may lead to larger benefits for the home country by increasing the rates of return on human capital caused by the creation of better, more productive, and higher paying jobs.
When the flow of migrants goes to a host country whose population is ageing, it may reduce the average age of the population. This can lead to an increase in the size of the labour force, reduce the age dependency ratio and make a positive tax contribution. The migrants increase the demand for host country output and may utilise housing in less popular areas. Those with a high level of education make an even more significant contribution to economic output.
Sources: The Guardian, 23 August 2023
asia.nikkei.com, 3 March 2023
imf.org, March 2020
Answer
Absolute poverty refers to a condition where an individual's income falls below a fixed, universal minimum level required to meet basic needs for survival, such as food, clean water, shelter, and healthcare. In the context of the article, this is defined by the World Bank as living on less than US$2.15 per day (2022 prices). It is distinct from relative poverty, which is defined in relation to the average income of a specific society.
Absolute poverty is a condition of severe deprivation of basic human needs, defined by a fixed income threshold, such as the World Bank's $2.15 per day.
Background Concept
Poverty is generally understood in two main ways: absolute and relative. Absolute poverty uses a fixed, universal standard. The World Bank's international poverty line is the most widely used measure, representing the minimum income needed to afford a basic basket of food, clothing, and shelter. This line is adjusted for purchasing power parity (PPP) to account for price differences between countries. Relative poverty, in contrast, is defined in relation to the economic standards of a particular country. A person is considered to be in relative poverty if their income is below a certain percentage (often 50% or 60%) of the national median income. This means the definition of relative poverty changes from one country to another and over time.
Understanding the Question
The question asks for a simple explanation of the term 'absolute poverty'. The extract provides a specific example: the World Bank's absolute poverty level of $2.15 per day. The answer must define the concept and can use this figure as a concrete illustration. The mark scheme awards 1 mark for the general concept and 1 mark for the specific figure or a comparison with relative poverty.
Approach
- State the core definition: a condition of severe deprivation based on a fixed, universal standard.
- Provide the specific threshold from the extract ($2.15 per day) to contextualise the definition.
- Optionally, briefly contrast it with relative poverty to show a deeper understanding.
Step-by-Step Reasoning
- Step 1: The core of the definition is the idea of a 'fixed' or 'universal' standard. This is the key differentiator from relative poverty. The standard is about survival and meeting basic needs.
- Step 2: The extract gives a concrete example: the World Bank's threshold of $2.15 per day. Using this figure directly from the source material shows you can apply the definition to the context of the question.
- Step 3: A brief comparison with relative poverty is a good way to solidify the definition. It shows the examiner you understand the distinction, which is a common point of confusion. The mark scheme explicitly allows for this comparison.
Key Takeaways
- Absolute poverty is a fixed, universal standard; relative poverty is a comparative standard within a society.
- Always look for specific data or examples in the extract to support your definition.
- A clear, concise definition is sufficient for a 2-mark question; adding a brief contrast can strengthen the answer.
Common Mistakes
- Confusing absolute and relative poverty: Defining absolute poverty as 'being poor compared to others' is incorrect and would lose marks.
- Being too vague: Saying 'not having enough money' is too general. The definition must include the idea of a fixed, minimum standard for survival.
- Not using the extract: The question is part of a data response. Failing to mention the $2.15 figure is a missed opportunity to show application.
Things to Be Careful About
- Do not confuse absolute poverty with the minimum wage. The mark scheme explicitly states 'Do not credit minimum wage'.
- Keep the answer focused. A 2-mark question does not require a long essay on the causes of poverty.
Explain, with the aid of a diagram, how the migration of workers from a low-income country is likely to affect wages in the low-income country.
Answer
Migration of workers from a low-income country reduces the supply of labour available in that country's domestic labour market.
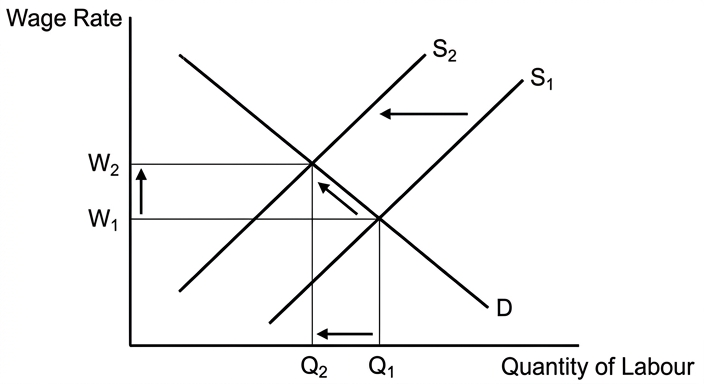
In the diagram, the initial equilibrium is at wage W1 with employment Q1. The outward migration of workers shifts the labour supply curve to the left, from S1 to S2. At the original wage W1, there is now an excess demand for labour. This competition among employers pushes the wage rate up to a new equilibrium at W2. The new equilibrium quantity of labour employed falls to Q2. Therefore, the migration of workers is likely to increase wages but reduce the total number of workers employed in the low-income country.
Migration reduces the supply of labour, increasing the equilibrium wage but decreasing the quantity of labour employed in the low-income country.
Background Concept
This question is about the labour market, which is a factor market. The demand for labour is a 'derived demand', meaning it is derived from the demand for the goods and services that labour produces. The supply of labour comes from the workers in a country. The wage rate is the 'price' of labour, determined by the interaction of supply and demand. A standard supply and demand diagram is used to model this market, with the wage rate on the vertical axis and the quantity of labour on the horizontal axis.
Understanding the Question
The question asks you to explain the effect of emigration (workers leaving) on the wages in the home country (the low-income country). The key mechanism is a change in the supply of labour. The question explicitly requires a diagram. The mark scheme awards marks for correctly labelling the axes and curves, showing the correct shift (supply shifting left), and identifying the new equilibrium. A maximum of 3 marks is available if no diagram is drawn.
Approach
- Identify the shift: Emigration means fewer workers are available in the home country. This is a decrease in the supply of labour, represented by a leftward shift of the supply curve.
- Draw the diagram: Draw a standard labour market diagram. Label the axes (Wage, Quantity of Labour). Draw a downward-sloping demand curve (D) and an initial upward-sloping supply curve (S1). Mark the initial equilibrium (W1, Q1).
- Show the effect: Draw a new supply curve (S2) to the left of S1. The new equilibrium is where S2 intersects D. This will be at a higher wage (W2) and a lower quantity of labour (Q2).
- Explain the reasoning: Explain why the wage rises. At the original wage, the reduced supply creates a shortage (excess demand). Employers compete for the fewer available workers, bidding up the wage until a new equilibrium is reached.
Step-by-Step Reasoning
- Step 1: The Causal Chain. The event is 'migration of workers from a low-income country'. This directly reduces the pool of available labour in that country. This is a change in the supply of labour, not a change in the demand for labour.
- Step 2: The Diagram. The diagram is essential. It must be fully labelled. The initial equilibrium is the starting point. The leftward shift of the supply curve is the key analytical move. The new equilibrium shows the result.
- Step 3: The Explanation. The explanation must link the shift to the change in wage. The shortage at the original wage is the mechanism that drives the wage up. The final outcome is a higher wage but lower employment.
- Step 4: The Assumption. This analysis assumes a competitive labour market. In reality, the effect might be more complex, but for a 5-mark question, this standard model is the expected answer.
Key Takeaways
- Emigration is a supply-side shock to the domestic labour market.
- A decrease in supply leads to a higher equilibrium price (wage) and a lower equilibrium quantity (employment).
- A diagram is a powerful tool for illustrating this cause-and-effect relationship. It must be fully labelled and explained in the text.
Common Mistakes
- Shifting the demand curve: A common error is to think that migration reduces demand for labour. The demand for labour depends on the demand for the country's output, not the number of workers. The shift is on the supply side.
- Poorly labelled diagram: Forgetting to label axes (Wage, Quantity of Labour) or curves (D, S1, S2) loses marks.
- No diagram: The mark scheme explicitly caps the mark at 3 if no diagram is provided. This is a critical error.
- Describing the effect on the host country: The question specifically asks about the effect on the low-income country (the home country). Answering about the host country would be off-topic.
Things to Be Careful About
- Ensure the diagram is neat and clear. Use a ruler for straight lines if possible.
- Explain the diagram in your written answer. Do not just draw it and expect the examiner to infer your reasoning.
- Use the correct terminology: 'supply of labour', 'equilibrium wage', 'excess demand'.
The article states: ‘Total remittances received by those countries in 2022 was $650 billion.’
Analyse how this is likely to benefit the migrants’ home economies.
Answer
Remittances are a significant financial inflow to the migrants' home economies. They are recorded as a credit (positive entry) on the current account of the balance of payments, specifically as secondary income (transfers). This inflow directly increases the net exports (X-M) component of Aggregate Demand (AD).
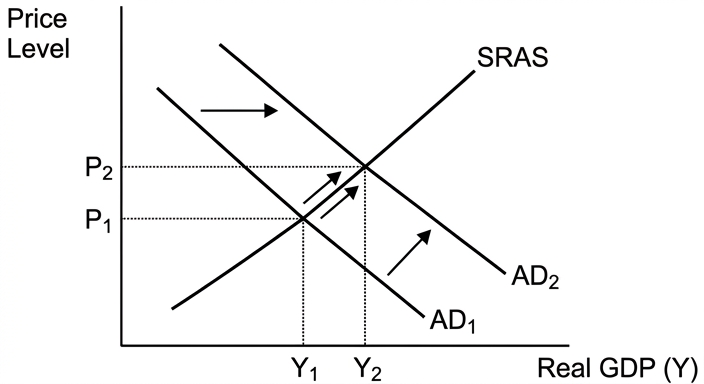
As shown in the AD/AS diagram, the initial equilibrium is at price level P1 and real GDP Y1. The increase in AD, caused by the inflow of remittances, shifts the AD curve to the right, from AD1 to AD2. This leads to a new equilibrium at a higher price level P2 and a higher level of real GDP, Y2. The increase in GDP represents economic growth for the home economy.
Furthermore, the article notes that remittances are a stable source of income that flows directly to households. This can increase household consumption (C), which is another component of AD. The extra income can be spent on food, education, and savings. Higher spending on education can improve human capital, potentially increasing the economy's long-run productive capacity and shifting the LRAS curve to the right over time. The multiplier effect will amplify the initial impact of the remittances on national income.
Remittances increase the home country's national income by boosting aggregate demand (through net exports and consumption) and can also enhance long-run productive capacity through investment in human capital.
Background Concept
This question connects micro-level flows (money sent home by individuals) to macro-level outcomes (national income). The key concepts are:
- Balance of Payments (BoP): A record of all economic transactions between a country and the rest of the world. Remittances are recorded as a credit in the 'Secondary Income' account of the Current Account.
- Aggregate Demand (AD): The total spending in an economy, calculated as AD = C + I + G + (X-M). An increase in remittances is an increase in 'X' (exports of services/income) or a reduction in the deficit, thus increasing the (X-M) component.
- National Income Determination: The AD/AS model shows how changes in AD affect the equilibrium level of real GDP and the price level.
- The Multiplier: An initial injection into the circular flow of income (like remittances) leads to a larger final increase in national income, as the money is re-spent in the economy.
Understanding the Question
The question asks you to 'analyse' how the $650 billion in remittances is likely to benefit the migrants' home economies. 'Analyse' requires you to break down the process and explain the causal links. The mark scheme provides two main lines of analysis: the direct macroeconomic effect via AD and the wider microeconomic effects on households. The answer should use the extract's data ($650 billion) and concepts.
Approach
- Macroeconomic Analysis (BoP and AD): Start by classifying remittances in the BoP. Then, explain how this inflow increases AD. Use an AD/AS diagram to show the resulting increase in real GDP and price level.
- Microeconomic Analysis (Household Impact): Use the extract's details. Remittances increase household income, leading to higher consumption (C). This is a second channel through which AD increases.
- Long-Term Effects: Mention the potential for investment in human capital (education) to increase the economy's productive capacity (LRAS).
- The Multiplier: Briefly explain that the initial impact is amplified as the money circulates through the economy.
Step-by-Step Reasoning
- Step 1: Classify the Flow. Remittances are not payment for goods or services (that would be exports). They are transfers. In the BoP, they are 'secondary income'. This is a credit item, improving the current account balance.
- Step 2: Link to AD. The current account balance (X-M) is a component of AD. An improvement in the current account (e.g., a smaller deficit or a larger surplus) represents an increase in net exports, which is an injection into the circular flow and increases AD.
- Step 3: The AD/AS Diagram. Draw a standard AD/AS diagram. The shift of AD to the right is the core of the analysis. The new equilibrium shows a higher real GDP (Y2) and a higher price level (P2). The increase in GDP is the 'benefit' in terms of economic growth.
- Step 4: The Household Channel. The extract says remittances 'flow directly to their receivers'. This increases disposable income. This leads to higher consumption spending (C), which is another component of AD. This reinforces the rightward shift of AD.
- Step 5: The Multiplier Effect. The initial injection of $650 billion does not just increase GDP by $650 billion. The recipients spend a portion of it (their MPC), which becomes income for others, who then spend a portion, and so on. The final increase in GDP is a multiple of the initial injection.
- Step 6: Long-Run Effects. The extract mentions spending on education. This is an investment in human capital. A more educated workforce is more productive, which can increase the economy's long-run aggregate supply (LRAS), leading to sustainable, non-inflationary growth.
Key Takeaways
- Remittances are a significant source of foreign exchange and income for many developing countries.
- They affect the economy through multiple channels: directly via the BoP and AD, and indirectly via household consumption and investment.
- The AD/AS model is a versatile tool for analysing the macroeconomic impact of various shocks, including financial flows.
- Always consider both short-run (demand-side) and long-run (supply-side) effects for a more complete analysis.
Common Mistakes
- Forgetting the BoP link: Simply saying 'remittances are good' without explaining the mechanism (how they enter the circular flow) is insufficient.
- Ignoring the multiplier: A good analysis should mention that the final impact on GDP is larger than the initial injection.
- Only focusing on AD: A strong answer will also mention the potential supply-side benefits (e.g., investment in education).
- Not using the extract: The $650 billion figure is a key piece of data. The extract also provides specific examples of how remittances are used (food, education), which should be incorporated.
Things to Be Careful About
- The AD/AS diagram is useful but not strictly required by the mark scheme (it is an alternative way to earn marks). However, it is a very effective way to illustrate the macroeconomic effect.
- Ensure the diagram is correctly labelled (Price Level, Real GDP, AD1, AD2, SRAS, Y1, Y2, P1, P2).
- The analysis should be 'developed'. Do not just state the conclusion; explain the chain of reasoning step-by-step.
Consider if the article contains sufficient information to support the view that migrants have only a beneficial economic impact on the host country.
Answer
The article presents several benefits of migration for the host country. It states that migrants can 'reduce the average age of the population', 'increase the size of the labour force', 'reduce the age dependency ratio', and 'make a positive tax contribution'. It also notes they 'increase the demand for host country output' and that highly educated migrants 'make an even more significant contribution to economic output'. These points support the view that migrants have a beneficial economic impact.
However, the article does not contain sufficient information to support the view that the impact is only beneficial. It fails to mention several significant potential costs. For example, it does not discuss the potential for increased demand for public services such as healthcare and education, which can strain government budgets. It also omits the potential for wage suppression in low-skilled sectors of the host economy, as an increased supply of labour can drive down wages for native workers in those sectors. Furthermore, the article does not address potential short-term transitional costs, such as those related to integration, language training, or regional disparities in housing and infrastructure.
Conclusion: While the article provides strong evidence for the economic benefits of migration to the host country, it is one-sided. It lacks information on the potential costs and negative externalities, such as pressure on public services and wage effects for low-skilled native workers. Therefore, the article does not contain sufficient information to support the view that the impact is only beneficial.
No. The article provides evidence of benefits but omits significant potential costs like pressure on public services and wage suppression, making its support for a 'only beneficial' view insufficient.
Background Concept
This question tests the skill of evaluation. It asks you to judge whether a source of information (the article) is sufficient to support a specific claim. This requires you to:
- Identify the evidence for the claim: What does the article say that supports the idea that migrants are beneficial?
- Identify the missing evidence: What information would be needed to make a fully informed judgement? What are the potential negative impacts that the article ignores?
- Reach a justified conclusion: Based on the balance of evidence presented and missing, is the article's support sufficient?
Understanding the Question
The question is 'Consider if the article contains sufficient information to support the view that migrants have only a beneficial economic impact on the host country.' The key words are 'sufficient information' and 'only beneficial'. The article is clearly positive about migration. The task is to critique this one-sidedness. The mark scheme awards up to 3 marks for benefits (from the article), up to 3 marks for disadvantages (not mentioned in the article), and 1 mark for a justified conclusion.
Approach
- Present the 'For' Case (from the article): Systematically list the benefits mentioned in the extract. Use direct references or paraphrases. This shows you can extract and apply evidence.
- Present the 'Against' Case (missing from the article): This is the core of the evaluation. You must identify the potential negative economic impacts that the article overlooks. This demonstrates a deeper understanding of the economics of migration.
- Reach a Judgement: The conclusion must directly answer the question. The article does not contain sufficient information because it is one-sided. The conclusion should state this clearly and justify it by referencing the missing information.
Step-by-Step Reasoning
- Step 1: Identify the Benefits (from the extract). The article explicitly states:
- Reduces the average age of the population.
- Increases the size of the labour force.
- Reduces the age dependency ratio.
- Makes a positive tax contribution.
- Increases demand for host country output.
- Highly educated migrants make a significant contribution to economic output.
- Step 2: Identify the Missing Costs (not in the extract). This requires economic knowledge. Common costs of migration for a host country include:
- Pressure on Public Services: Increased demand for healthcare, education, housing, and welfare benefits can strain government budgets and infrastructure.
- Wage Effects: An increase in the supply of labour, especially for low-skilled jobs, can suppress wages for native workers in those sectors.
- Short-term Unemployment: Migrants may initially struggle to find jobs, leading to a temporary increase in unemployment.
- Integration Costs: Government spending on language training, cultural integration programs, and social services.
- Regional Disparities: Migrants may concentrate in specific urban areas, putting pressure on local housing and infrastructure while other areas are neglected.
- Step 3: Formulate the Conclusion. The conclusion must be a judgement. The article is a promotional piece for migration. It presents a one-sided, positive view. Therefore, it does not contain sufficient information to support the claim that the impact is only beneficial. A balanced analysis would require information on the costs as well.
Key Takeaways
- Evaluation is not just listing pros and cons. It is about weighing them against a specific criterion (in this case, 'sufficiency of information').
- For a 'consider if' question, you must identify what is missing from the argument.
- A justified conclusion is essential for the final mark. It must directly answer the question and be supported by your analysis.
- Always use the extract as your primary source for one side of the argument.
Common Mistakes
- One-sided answer: Only listing the benefits from the article and concluding that the article is correct. This ignores the 'consider if' and 'only beneficial' parts of the question and would score zero for evaluation.
- Not using the extract: Discussing the economics of migration in general without referencing the specific points made in the article. The question is about the article's information.
- Vague conclusion: Saying 'it depends' without a clear judgement. The conclusion must state whether the article's information is sufficient or not.
- Confusing 'host country' with 'home country': The question is about the impact on the host country (where the migrants go), not the home country (where they come from).
Things to Be Careful About
- The question is about the sufficiency of information, not about whether migration is good or bad. Your analysis must focus on what the article does and does not say.
- The mark scheme allocates specific marks for benefits (from the article) and disadvantages (not mentioned). Ensure you cover both to access the full range of marks.
- The conclusion must be a single, clear sentence that answers the question directly.
Market failure is to blame for climate change and the inefficient allocation of resources. The only solution is for governments to intervene to improve resource allocation.
Assess the extent to which you agree with this statement.
Introduction
Market failure occurs when the free market allocates resources inefficiently, leading to a loss of social welfare. Climate change is a classic example of a negative production externality: firms producing goods that emit greenhouse gases impose costs on society (e.g., rising sea levels, extreme weather) that are not reflected in their private costs. The result is an overallocation of resources to polluting activities. The statement asserts that the 'only solution' is government intervention. This essay will analyse the nature of the market failure, assess the effectiveness of possible government policies, and evaluate the extent to which intervention — and only intervention — can improve resource allocation.
Analysis of Climate Change as a Market Failure
In a free market, a firm's supply curve reflects its private marginal cost (MPC). However, production that emits CO₂ also creates external costs — the marginal external cost (MEC). The true social marginal cost (MSC) equals MPC + MEC.
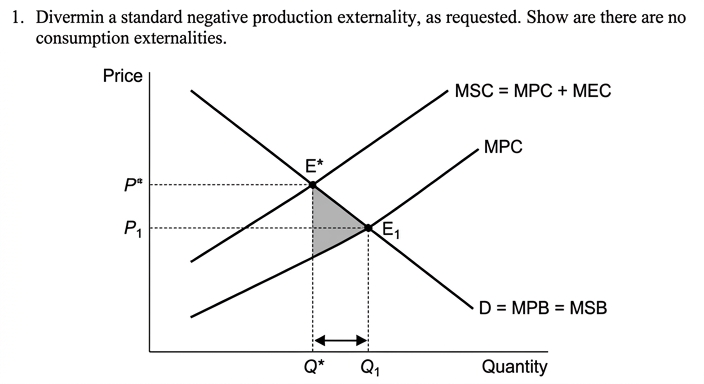
At the market equilibrium, output is Q₁ where demand (MPB = MSB) equals MPC. The socially efficient level is Q* where MSB = MSC. The overproduction Q₁ – Q* creates a deadweight welfare loss (the shaded triangle) because the social cost of each extra unit beyond Q* exceeds the social benefit. This demonstrates that without intervention, the market fails to achieve allocative efficiency.
Government Intervention to Correct the Failure
Governments have several policy tools to internalise the externality:
- Carbon tax: an indirect tax on the carbon content of fuels raises the private cost to equal MSC, shifting the supply curve left from MPC to MPC + tax = MSC, moving equilibrium towards Q*.
- Tradable permits (cap-and-trade): a limit (cap) on total emissions is set, and permits are auctioned or allocated. Firms that can reduce emissions cheaply sell permits to those facing higher costs, achieving the target at minimum cost.
- Subsidies for renewable energy: reduce the cost of clean alternatives, encouraging a shift away from fossil fuels.
- Regulation (emission standards): direct limits on allowable emissions per firm. This can be effective but may be less flexible and more costly than market-based instruments.
- Nudge policies: providing information, default options (e.g., green energy tariffs), or social norms to encourage pro-environmental behaviour.
All these policies aim to align private incentives with social costs and reduce the deadweight loss, thereby improving resource allocation.
Evaluation
While government intervention can theoretically correct the market failure, there are significant challenges.
First, measuring the external cost is extremely difficult — what is the true social cost of a tonne of CO₂? Estimates vary widely, making it hard to set the tax or cap at the correct level. If the policy is set too low, overproduction and welfare loss remain; if too high, output may be reduced excessively, imposing unnecessary costs on consumers and firms.
Second, government failure is a real risk: policies may be captured by vested interests (e.g., fossil-fuel subsidies persist despite their inefficiency), implemented with long time lags, or undone by political cycles. Regulations can be outdated, and subsidies may be wasted on ineffective projects.
Third, global nature of climate change: emissions anywhere affect the entire planet. Unilateral government intervention in one country may be undermined by carbon leakage (production moves to countries with weaker policies). International cooperation (e.g., the Paris Agreement) is needed, which itself suffers from enforcement and free-rider problems.
Fourth, alternatives to government intervention exist. Market-based solutions such as corporate social responsibility, consumer boycotts, and technological innovation from the private sector can play a role. However, without a price on carbon or a regulatory framework, these are unlikely to be sufficient given the scale of the externality. The 'only' in the statement is therefore too strong: government intervention is necessary, but it must be complemented by international coordination, behavioural change, and private-sector initiative.
Conclusion
Climate change is a clear case of market failure that requires government intervention to align private and social costs. Policies such as carbon taxes and tradable permits can, in theory, achieve allocative efficiency. However, practical difficulties of measurement and implementation, the risk of government failure, and the global dimension mean that government intervention alone cannot fully solve the problem. A combination of well-designed domestic policies, international agreements, and voluntary private action is needed. Therefore, I agree that government intervention is essential to a large extent, but disagree that it is the 'only' solution; rather, it is a necessary — but not sufficient — component of an effective response.
Government intervention is essential to correct the market failure of climate change, but it is not the only solution; a combination of well-designed policies, international cooperation, and private- and public-sector action is required.
Background Concept
Market failure occurs when the free market fails to allocate resources efficiently, resulting in a loss of social welfare. One major cause is externalities — costs or benefits that affect third parties not directly involved in a transaction. A negative externality exists when the social cost of an activity exceeds the private cost (e.g., pollution from production). In a competitive market, firms produce where their private marginal cost (MPC) equals the price they receive. But if production imposes external costs, the true social marginal cost (MSC) is higher, so the market overproduces relative to the socially optimal level, creating a deadweight welfare loss.
Climate change is a classic negative production externality: burning fossil fuels emits CO₂, which causes global warming and imposes widespread costs (sea-level rise, extreme weather, health impacts) that are not borne by the producers or consumers of the fuel. This leads to overuse of fossil fuels, too much carbon-intensive output, and underinvestment in clean alternatives.
Government intervention aims to internalise the externality — to make private decision-makers face the full social cost of their actions. Common tools include taxes (which raise the private cost to match social cost), tradable permits (which cap total pollution and let the market allocate reductions efficiently), subsidies (which encourage clean alternatives), and regulations (which mandate specific standards). However, intervention is not perfect; governments may lack information, be captured by interest groups, or cause unintended side-effects (government failure).
Understanding the Question
The question presents a statement: "Market failure is to blame for climate change and the inefficient allocation of resources. The only solution is for governments to intervene to improve resource allocation." You are asked to assess the extent to which you agree. This is an evaluative command — you must develop both sides: the case that government intervention is necessary and effective, and the case that it may be insufficient, flawed, or that other solutions exist. You must reach a justified conclusion that specifically addresses the word 'only' — is government intervention the sole solution, or are other factors also necessary?
The question requires you to demonstrate:
- Knowledge: understanding of market failure, externalities, and government policy tools.
- Analysis: using a diagram to show the welfare loss from the externality and how intervention can correct it, with a chain of reasoning.
- Evaluation: weighing the strengths and weaknesses of intervention, considering government failure, measurement difficulties, and the global dimension, and concluding on the 'only' claim.
Approach
- Begin by defining market failure and explaining how climate change arises as a negative production externality. Introduce the diagram.
- Draw and explain the standard externality diagram: downward-sloping demand (MSB = MPB), upward-sloping private supply (MPC), the higher social supply (MSC). Show the market output Q1 (where MSB = MPC) and the socially optimal Q* (where MSB = MSC). Identify the deadweight loss triangle from overproduction.
- Outline several government intervention options: carbon tax, tradable permits, subsidies, regulation, nudge. Explain how each works to shift the private cost curve or alter behaviour to reduce output towards Q*.
- Transition to evaluation: discuss difficulties in measuring the external cost, problems of government failure, time lags, political feasibility, and the global nature of climate change (free-rider problem). Also consider whether private-sector solutions (e.g., green innovation, CSR) could achieve enough on their own.
- Conclude by stating the extent of agreement: government intervention is necessary and central, but not the 'only' solution — it must be part of a broader mix including international cooperation and behavioural change, and it is subject to significant limitations that prevent it from being a panacea.
Step-by-Step Reasoning
Step 1: Define the market failure
- Private costs: costs directly incurred by producers (labour, raw materials, energy).
- External costs: pollution, health damages, climate impacts — not included in the firm's cost calculation.
- Social costs = private + external costs.
- Profit-maximising firms produce where P = MPC; society would want P = MSC. The gap (MSC – MPC) means overproduction.
Step 2: The diagram
- Axes: Price on vertical, Quantity on horizontal.
- Curves: Downward-sloping D = MSB = MPB (assuming no consumption externality). Upward-sloping S = MPC. Above MPC, a second curve MSC = MPC + MEC (marginal external cost).
- Equilibrium: market equilibrium at E1 (P1, Q1) where D = MPC. Social optimum at E* (P*, Q*) where D = MSC.
- Deadweight loss: triangle between Q1 and Q*, above the MSC curve and below the D curve. This area represents the net welfare loss because the social cost of each unit beyond Q* exceeds the social benefit.
- This shows why resources are misallocated — too much pollution-intensive output.
Step 3: Government intervention options
- Carbon tax: A per-unit tax equal to MEC at Q*. This raises the private supply curve to MPC + tax = MSC. New equilibrium at Q*, tax revenue collected (can be used to offset other taxes). Works well when MEC is relatively stable.
- Tradable permits: Set a cap on total emissions equal to Q* (or some target). Issue permits for that amount. Firms trade permits; market price emerges equal to the marginal abatement cost. Efficient because firms with lowest abatement cost reduce pollution most. Requires accurate cap-setting and enforcement.
- Subsidies: To shift consumption/production away from pollution. For example, subsidies for renewable energy lower their cost, making clean alternatives more attractive. But subsidies require government revenue; may not directly penalise pollution.
- Regulation: Command-and-control standards (e.g., emission limits per plant). Can guarantee a maximum level of pollution, but often higher cost than market instruments because firms cannot trade reductions. May be easier to enforce politically.
- Nudge: Information campaigns, default choices (e.g., green energy as default), social norms. Low cost but uncertain magnitude of effect; may not be sufficient alone.
Step 4: Evaluation
- Measurement difficulty: To set tax or cap correctly, government must know the exact MEC. In reality, the social cost of carbon is hotly debated (e.g., US estimates $50-$200/tonne). Over- or under-correction leads to suboptimal outcomes.
- Government failure: Public choice issues: regulations may be captured by industry (e.g., loopholes), subsidies may persist for mature industries, politicians may prioritise short-term gains over long-term climate action. Bureaucrats may lack information and flexibility.
- Global problem: Climate change is a global commons problem. Any single country's action has limited effect if others free-ride. International agreements (e.g., Paris) are important but suffer from enforcement problems and the prisoner's dilemma. Government intervention at the national level is necessary but insufficient without global cooperation.
- Are there non-government solutions? Private sector innovation (e.g., Tesla, renewable technology) can be driven by profit motives and consumer demand. Corporate sustainability initiatives can reduce emissions. However, without a price incentive (tax or permit price) the extent of private action is unlikely to match the social optimum. So government intervention is necessary to create the framework, but private initiative then complements it.
- The 'only' in the statement: The claim that government intervention is the 'only solution' is too absolute. While government action is essential to correct the market failure, it must be part of a broader approach: international treaties, technological innovation, and changes in consumer behaviour. Moreover, poorly designed intervention may even worsen allocation (government failure). Thus, intervention is necessary but not sufficient; it is not the only element.
Step 5: Conclusion
Weigh the arguments: The market failure is real and severe; without government intervention, the free market will continue to underprice carbon and overproduce pollution. Yet intervention faces considerable practical hurdles and must be complemented by global governance and private effort. The extent of agreement is therefore 'to a large extent' but not completely: I agree that government intervention is crucial, but disagree that it is the only solution. A nuanced judgement is required.
Key Takeaways
- Negative externalities cause overproduction and deadweight welfare loss; diagrams are essential to illustrate this.
- Government intervention can theoretically restore allocative efficiency by internalising external costs, but practical implementation is difficult.
- Evaluation of intervention should consider measurement difficulties, government failure, and the global/international dimension.
- When a statement includes an absolute word like 'only', address it directly in the conclusion.
- A-level essay structure: clear definitions, developed analysis with diagram, two-sided evaluation, justified conclusion.
Common Mistakes
- One-sided answer: Only discussing why government intervention works, ignoring its limitations and alternatives. This loses all evaluation marks. Both sides must be developed.
- No diagram or unexplained diagram: The mark scheme caps at lower levels if the required diagram is missing or not explained. Always explain what the diagram shows and how it supports the analysis.
- Vague or missing conclusion: Even if analysis is good, without a justified conclusion that specifically addresses the question (including the 'only'), top AO3 band is unreachable.
- Generic answer: Describing market failure in general without linking to climate change or using the extract/stimulus. Tailor to the specific question.
- Confusing private and social costs: Mislabeling curves (e.g., calling MPC = social cost). Ensure correct terminology and accurate labels on diagram.
Things to Be Careful About
- Diagram labels: Must include all axes (Price, Quantity), curves (D = MSB = MPB, S = MPC, MSC), equilibrium points (E1, E*), and deadweight loss (shaded area). Use arrows to show shifts if demonstrating tax.
- Chain of reasoning: Explain step by step: overproduction → welfare loss → intervention → change in incentives → move towards optimum. Don't jump.
- Use the stimulus: The question statement mentions 'market failure' and 'inefficient allocation'; engage directly with these phrases.
- Evaluation criteria: Use specific evaluative points (e.g., 'difficulty of measuring external cost leads to risk of under/over-correction') rather than general 'it might not work'.
- Language: Precise economic terminology (allocative efficiency, deadweight loss, marginal external cost, internalising the externality). Avoid vague terms like 'bad for society'.
The degree of competition that a firm experiences is determined only by the barriers to entry into its market.
With the help of a diagram(s), evaluate this statement.
Introduction
Barriers to entry are obstacles that prevent new firms from entering a market, such as legal barriers (patents, licences), cost barriers (economies of scale), and physical barriers (control of key resources). The statement claims that the degree of competition a firm faces is determined only by these barriers. This essay will evaluate that claim by analysing the role of barriers to entry in determining market structure and then considering other significant factors that also influence the degree of competition.
The case that barriers to entry are the primary determinant of competition
Barriers to entry are fundamental because they determine the number of firms in a market, which is a key structural feature. In perfect competition, there are no barriers to entry. This freedom of entry ensures that any short-run supernormal profit attracts new firms, shifting the market supply curve rightwards until price falls to the minimum of the average cost curve, leaving all firms earning only normal profit in the long run. This outcome is the textbook definition of a highly competitive market: firms are price-takers, producing at the point of productive and allocative efficiency.
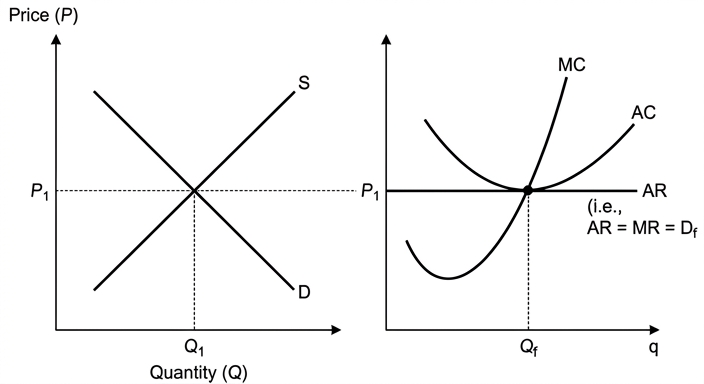
In contrast, a monopoly is characterised by high barriers to entry. These barriers protect the monopolist from potential competition, allowing it to earn persistent supernormal profits in the long run. The monopolist can restrict output and charge a price above marginal cost, leading to allocative inefficiency and a deadweight welfare loss. The absence of potential entrants means the monopolist faces no competitive pressure to reduce price or improve quality.
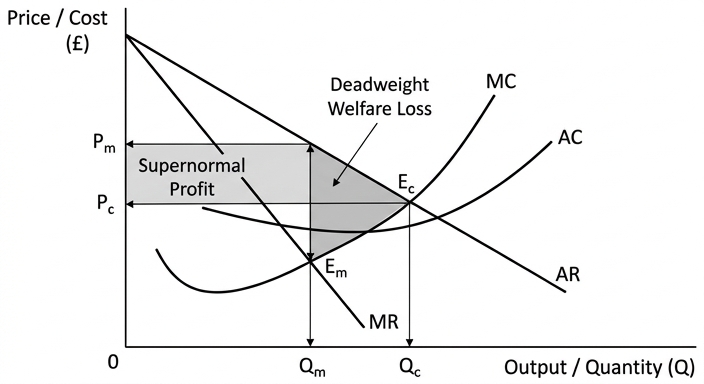
This direct comparison shows that the presence or absence of barriers to entry is the single most important factor distinguishing a highly competitive market from an uncompetitive one. Therefore, the statement has strong validity.
The case that other factors also determine the degree of competition
However, the degree of competition is not determined only by barriers to entry. Several other factors are crucial.
First, product differentiation is a key feature of monopolistic competition. In this market structure, there are very low barriers to entry, yet firms do not face the intense price competition of perfect competition. Each firm has some market power because its product is differentiated from rivals' through branding, quality, or location. Competition takes the form of non-price competition (advertising, product development) rather than pure price competition. Thus, even with low entry barriers, the degree of competition is moderated by product differentiation.
Second, contestability matters. A market can have high barriers to entry (e.g., high sunk costs in the airline industry) but still be highly competitive if it is contestable. A contestable market is one where there is free entry and, crucially, costless exit (no sunk costs). The threat of 'hit-and-run' entry by potential competitors forces incumbent firms to behave competitively, producing at the efficient scale and earning only normal profit, even if the market is a natural monopoly. In this case, the threat of competition, rather than the actual number of firms, determines the degree of competition.
Third, regulation can impose competitive behaviour on firms in markets with high barriers to entry. For example, a regulatory body might force a natural monopoly to set price equal to marginal cost (or average cost) to prevent it from exploiting its market power. Similarly, competition laws can prevent anti-competitive practices like collusion in an oligopoly, thereby increasing the degree of competition.
Fourth, in an oligopoly, the degree of competition is heavily influenced by the strategic interdependence of the few large firms. Even with high barriers to entry, oligopolists may engage in fierce non-price competition (e.g., advertising wars, product innovation) or, alternatively, they may collude to act like a monopoly. The outcome depends on the game-theoretic structure of the market, not just the height of entry barriers.
Evaluation
Barriers to entry are undoubtedly the most important structural determinant of competition. They define the market structure and set the boundaries within which firms operate. A market with zero barriers will, in the long run, tend towards a competitive outcome. However, the statement is an over-simplification. The degree of competition is a spectrum, not a binary state determined by a single factor. Product differentiation, contestability, regulation, and the strategic behaviour of firms all play significant roles. For instance, a contestable natural monopoly can be more competitive than a monopolistically competitive market with low barriers but high product differentiation.
Conclusion
The statement is partially valid but ultimately too absolute. Barriers to entry are the primary determinant of the structure of a market and the potential for competition. However, the actual degree of competition experienced by a firm is also significantly shaped by product differentiation, the threat of entry in contestable markets, and the regulatory environment. Therefore, the statement is rejected as an oversimplification; competition is determined by a combination of structural, behavioural, and regulatory factors, not by barriers to entry alone.
The statement is an oversimplification. While barriers to entry are the primary determinant of market structure and the potential for competition, the actual degree of competition is also significantly influenced by product differentiation, the contestability of the market, and the regulatory environment. Therefore, competition is not determined by barriers to entry alone.
Background Concept
This question tests your understanding of market structures and the factors that determine the degree of competition a firm faces. The core concepts are:
- Barriers to Entry: Obstacles that make it difficult or impossible for new firms to enter a market. These can be legal (patents, licences), natural (economies of scale, control of key resources), or strategic (predatory pricing).
- Market Structure: The organisational characteristics of a market, including the number of firms, the degree of product differentiation, and the ease of entry and exit. The main structures are perfect competition, monopolistic competition, oligopoly, and monopoly.
- Degree of Competition: This refers to how much market power firms have. A highly competitive market is one where firms are price-takers, have no market power, and earn only normal profit in the long run. An uncompetitive market is one where firms have significant market power and can earn supernormal profits.
- Contestable Markets: A market where there is free entry and costless exit (no sunk costs). The threat of 'hit-and-run' entry can force even a monopoly to behave competitively.
- Product Differentiation: The process of distinguishing a product or service from others to make it more attractive to a particular target market. This gives firms some market power even in markets with low entry barriers.
Understanding the Question
The question presents a statement: "The degree of competition that a firm experiences is determined only by the barriers to entry into its market." The command word is "evaluate", which requires you to:
- Analyse (AO1/AO2): Explain the theory behind the statement. Show how barriers to entry do determine market structure and the degree of competition. You must use at least two diagrams to illustrate this.
- Evaluate (AO3): Critically assess the statement. Is it only barriers to entry? What other factors matter? You must reach a justified conclusion.
The statement contains the absolute word "only". This is a clear signal that the counter-argument is the heart of the essay. You must argue that while barriers to entry are important, they are not the sole determinant. The top band for AO3 requires a "justified conclusion or judgement that addresses the specific requirements of the question." Your conclusion must directly answer whether the statement is correct.
The mark scheme also specifies:
- Max L2 if no diagram: You must include at least one diagram, but two (perfect competition and monopoly) are strongly recommended to fully develop the analysis.
- Max L2 if only one type of structure: You must discuss at least two market structures, one with barriers and one without.
Approach
- Introduction: Define key terms (barriers to entry, competition) and state your thesis: the statement is partially valid but an oversimplification.
- First Side (Analysis): Argue for the statement. Use a diagram of perfect competition (no barriers -> competitive outcome) and a diagram of monopoly (high barriers -> uncompetitive outcome). This establishes the strong link between barriers and competition.
- Second Side (Analysis): Argue against the statement. Introduce other factors:
- Product differentiation in monopolistic competition.
- Contestability (the threat of entry).
- Regulation.
- Strategic behaviour in oligopoly.
- Evaluation: Weigh the two sides. Acknowledge that barriers are the most important structural factor, but argue that the actual degree of competition is a more nuanced concept. Use a criterion like 'the spectrum of competition' or 'the difference between potential and actual competition'.
- Conclusion: Deliver a clear, justified judgement. The statement is rejected because it is too absolute.
Step-by-Step Reasoning
Step 1: Define and Explain the Role of Barriers to Entry
- Start by defining barriers to entry. Give examples: legal (patents, licences), natural (economies of scale, high start-up costs), and strategic (predatory pricing, brand loyalty).
- Explain the mechanism: High barriers prevent new firms from entering, protecting existing firms from competition. This allows them to earn supernormal profits and exercise market power. Low barriers allow free entry, which erodes supernormal profits and forces firms to be efficient.
Step 2: Illustrate with a Perfect Competition Diagram
- Draw a diagram for a firm in perfect competition. The firm is a price-taker, so its demand curve (AR) is perfectly elastic (horizontal) at the market price.
- In the long run, the absence of barriers means any supernormal profit attracts new firms. This shifts the market supply curve right, lowering the price until the firm's AR curve is tangent to its AC curve at the minimum point. The firm earns normal profit and produces at the most efficient scale.
- Explain that this outcome (productive and allocative efficiency) is the hallmark of a highly competitive market, and it is directly caused by the lack of barriers to entry.
Step 3: Illustrate with a Monopoly Diagram
- Draw a diagram for a monopoly. The monopolist faces a downward-sloping demand curve (AR).
- The monopolist maximises profit where MC = MR, producing Qm and charging Pm. Because of high barriers to entry, no new firms can enter to compete away the supernormal profit (the shaded rectangle).
- Explain that this outcome (higher price, lower output, allocative inefficiency, deadweight welfare loss) is the hallmark of an uncompetitive market, directly caused by high barriers to entry.
- This comparison strongly supports the statement.
Step 4: Introduce the Counter-Arguments
- Product Differentiation (Monopolistic Competition): Explain that in monopolistic competition, barriers to entry are low, but firms have some market power due to product differentiation. Competition is intense but takes the form of non-price competition (advertising, branding) rather than pure price competition. The degree of competition is therefore different from perfect competition, even though entry barriers are similarly low.
- Contestability: Explain the theory of contestable markets. A market can have high barriers to entry (e.g., high sunk costs) but be highly competitive if exit is costless. The threat of 'hit-and-run' entry forces firms to behave competitively. This shows that the threat of competition, not just the actual number of firms, matters.
- Regulation: Explain how government regulation can impose competitive outcomes. For example, a regulator can force a natural monopoly to set price equal to average cost, eliminating supernormal profit and mimicking a competitive outcome.
- Oligopoly: Explain that in an oligopoly, the degree of competition is determined by strategic interdependence. Firms may collude (acting like a monopoly) or engage in fierce non-price competition. The outcome depends on game theory, not just the height of entry barriers.
Step 5: Evaluate and Conclude
- Weigh the arguments: Acknowledge that barriers to entry are the most important single factor. They define the market structure and set the 'rules of the game'. Without barriers, a market will tend towards a competitive outcome in the long run.
- Critique the absolute claim: The statement is an oversimplification because it ignores other crucial factors. The degree of competition is a spectrum, and it is influenced by product differentiation, contestability, regulation, and strategic behaviour.
- Reach a justified conclusion: The statement is rejected. While barriers to entry are the primary determinant of the potential for competition, the actual degree of competition is determined by a combination of structural, behavioural, and regulatory factors.
Key Takeaways
- The importance of barriers to entry: They are a fundamental concept in industrial economics and are the primary determinant of market structure.
- The spectrum of competition: Competition is not binary. Markets exist on a spectrum from perfect competition to pure monopoly, and many factors influence where a market sits on this spectrum.
- The power of evaluation: The command word 'evaluate' requires a two-sided argument and a justified conclusion. An answer that only explains the role of barriers to entry would be one-sided and would score zero for evaluation.
- The role of diagrams: Diagrams are essential for analysis. They must be correctly labelled and fully explained in the text. A diagram without explanation is a missed opportunity.
- Challenging absolutes: When a question contains an absolute word like 'only', 'always', or 'never', the counter-argument is the core of the evaluation.
Common Mistakes
- One-sided answer: Only explaining how barriers to entry determine competition, without discussing other factors. This would score zero for evaluation (AO3).
- No diagram or a poorly explained diagram: The mark scheme explicitly caps the mark at Level 2 if no diagram is provided. A diagram that is drawn but not explained in the text is also insufficient.
- Only discussing one market structure: The mark scheme caps the mark at Level 2 if only one type of structure is discussed. You must compare at least two (e.g., perfect competition and monopoly).
- A vague or general conclusion: A conclusion that simply says "it depends" without explaining what it depends on and reaching a clear verdict. The top band requires a "justified conclusion or judgement that addresses the specific requirements of the question."
- Confusing market structure with the degree of competition: A market can have a structure that suggests low competition (e.g., monopoly) but still be competitive if it is contestable. Failing to make this distinction is a common error.
- Listing factors without development: Simply listing 'product differentiation', 'contestability', and 'regulation' without explaining how they affect the degree of competition is insufficient. Each point must be developed with a chain of reasoning.
Things to Be Careful About
- Diagram labelling: Ensure all axes, curves, and equilibrium points are clearly labelled (e.g., P, Q, MC, AC, MR, AR, D, S, Pm, Qm, Pc, Qc). Show the direction of any shifts.
- Diagram explanation: In the text, explicitly state what the diagram shows. For example: "The diagram shows that the monopolist produces where MC = MR, leading to a price of Pm and output of Qm. This is higher than the competitive price (Pc) and lower than the competitive output (Qc), illustrating the welfare loss."
- Use of economic terminology: Use precise terms like 'supernormal profit', 'allocative efficiency', 'productive efficiency', 'deadweight welfare loss', 'contestable market', 'product differentiation', 'strategic interdependence'.
- Focus on the question: The question is about the degree of competition, not just the structure of the market. Keep your analysis focused on how each factor affects the competitive pressure on firms.
- The conclusion: Your conclusion must be a direct answer to the statement. Do not just summarise your arguments. State clearly whether you agree or disagree and why.
Evaluate the effect of a rise in the exchange rate on the achievement of the macroeconomic aims of a country.
Introduction
A rise in the exchange rate (an appreciation) makes exports more expensive in foreign currency and imports cheaper in domestic currency. This affects the economy's macroeconomic aims: economic growth, low unemployment, low inflation, and a sustainable balance of payments. The net effect depends on elasticities, the structure of the economy, and the time horizon.
Analysis of the effect on aggregate demand and economic growth
An appreciation reduces the price-competitiveness of exports, so the quantity of exports demanded falls. Imports become cheaper, leading to a rise in import volumes. For the current account, net exports (X-M) fall, which reduces aggregate demand (AD).
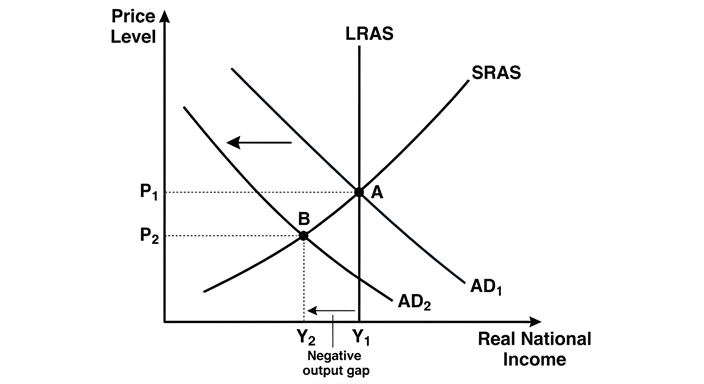
The AD curve shifts leftwards from AD1 to AD2. In the short run, if the economy is operating below full capacity, the price level falls from P1 to P2 and real national income falls from Y1 to Y2. This represents a fall in actual growth and may cause a negative output gap, raising unemployment.
Depending on the marginal propensity to import and export, the fall in AD can be amplified by the multiplier effect. The initial fall in (X-M) causes a larger final fall in national income.
Effect on inflation
A rise in the exchange rate reduces the domestic price of imported raw materials and finished goods. This lowers firms' costs of production, shifting short-run aggregate supply (SRAS) to the right. Additionally, cheaper imports put direct downward pressure on the consumer price index (cost-push inflation falls). Thus, an appreciation helps achieve the aim of low inflation.
Effect on the balance of payments
The current account may worsen in the short run if the Marshall-Lerner condition is not met – that is, if the sum of the price elasticities of demand for exports and imports is less than one. The J-curve effect suggests that in the short run the trade balance deteriorates, but may improve in the long run as volumes adjust. However, if exports and imports are inelastic (e.g., necessary imports and exports with limited substitutes), the depreciation of net exports may be permanent.
Evaluation
The overall effect on macroeconomic aims is not clear-cut.
- Time period: In the short run, the negative impact on output and employment may dominate; in the long run, lower import costs can boost productivity and improve the supply side.
- Elasticities: The magnitude of the trade volume response depends on the price elasticity of demand for exports and imports. For a country that exports price-inelastic goods (e.g., luxury goods with brand strength) the fall in export revenue may be small. For a country reliant on imported necessities (inelastic demand), the fall in import spending is also limited, so the AD effect may be muted.
- Openness of the economy: In a very open economy with a high share of (X-M) in GDP, the contractionary effect is larger. In a relatively closed economy, domestic components of AD dominate and the exchange rate effect is less significant.
- Reserve currency status: If the currency is a reserve currency (like the US dollar), the demand for it remains strong regardless of its value, and the adjustment may be slower.
- Supply-side benefits: Cheaper imported capital goods may improve productivity and shift LRAS to the right over time, offsetting the demand-side contraction.
Conclusion
A rise in the exchange rate helps achieve price stability by reducing import costs and inflation, but it harms economic growth and employment in the short run through the fall in net exports and AD. The balance of payments might improve only in the long run if elasticities are favourable. On balance, appreciation is usually a drag on growth and employment, but its overall desirability depends on which macroeconomic aim the policy-makers prioritise. If inflation is the overriding concern, appreciation can be beneficial; if growth and employment are the main goals, the effects are likely to be adverse.
A rise in the exchange rate reduces net exports and aggregate demand, damaging growth and employment in the short run, while lowering inflation through cheaper imports. The balance of payments effect depends on elasticities and the J-curve. Whether the overall impact helps achieve macroeconomic aims depends on the relative priority of low inflation versus growth and employment; no single policy outcome is guaranteed.
Background Concept
An exchange rate appreciation means the domestic currency becomes stronger relative to foreign currencies. For example, if the US dollar rises from $1 = €0.90 to $1 = €1.00, US exports to the eurozone become more expensive in euros (the foreign-currency price rises), while EU imports to the US become cheaper in dollars. The immediate effect is on the price competitiveness of exports and imports. This changes the volume of trade and thus the current account balance (X-M).
The current account balance is a component of aggregate demand (AD = C + I + G + X - M). A fall in (X-M) reduces AD, shifting the AD curve leftwards. In the short run, with a given SRAS, this lowers real output and the price level. This is the classic Keynesian transmission mechanism.
Additionally, cheaper imports reduce domestic firms' costs (if they use imported inputs) and directly lower the consumer price index. Thus, an appreciation is often anti-inflationary.
Macroeconomic aims typically include: low and stable inflation, low unemployment, sustainable economic growth, and a balanced balance of payments. The question asks to evaluate the effect on the 'achievement' of these aims – implying an assessment of whether appreciation helps or hinders each aim and under what conditions.
Understanding the Question
This is a 20-mark essay requiring both analysis (development of the effects) and evaluation (weighing of competing factors, reaching a justified conclusion). The command word is 'Evaluate', which explicitly demands two sides and a conclusion. The level descriptors confirm that the top band for AO3 (evaluation) requires 'developed, reasoned and well-supported evaluative comment(s)' and a 'justified conclusion that addresses the specific requirements of the question'.
The question is general – it does not specify a country or the cause of the exchange rate rise. This means the candidate can set their own context (e.g., a developed market economy with floating exchange rates) but must keep it realistic. The mark scheme permits analysis using any currency, e.g., US dollar.
Key macroeconomic aims to consider: economic growth, unemployment, inflation, balance of payments (current account). Possibly also income distribution or sustainability, but the core aims are the first four. The evaluation should consider the trade-offs among these aims: e.g., appreciation might reduce inflation but worsen unemployment (a conflict).
Approach
- Begin by defining a rise in the exchange rate (appreciation) and identify the key mechanisms: trade effect (exports/imports) and cost effect (import prices).
- Analyse the demand-side effect: fall in net exports → fall in AD → lower growth, higher unemployment. Support with an AD/AS diagram.
- Analyse the supply-side/cost effect: cheaper imports → lower inflation, possible rightward shift of SRAS (if imported inputs are significant).
- Analyse the balance of payments effect using the Marshall-Lerner condition and J-curve theory to show why the current account may not improve immediately.
- Evaluate by discussing factors that modify the outcomes: price elasticities of demand, openness, time horizon, reserve currency status, supply-side benefits, and the possibility that the appreciation was caused by something (e.g., inward investment) that itself boosts AD.
- Conclude with a balanced judgement that states under which conditions appreciation helps or hinders each aim, and prioritises based on the likely trade-off.
Step-by-Step Reasoning
Step 1: Define appreciation. A rise in the exchange rate means one unit of domestic currency buys more foreign currency. For example, the USD/EUR exchange rate rises from 0.80 to 0.90. This makes US exports more expensive for European buyers (price in euros rises) and European imports cheaper for US buyers (price in dollars falls).
Step 2: Effect on net exports and AD. With more expensive exports, the quantity of US exports demanded falls. With cheaper imports, US consumers and firms buy more imports. Assume volumes respond. Initially, the value of exports falls and the value of imports rises, so net exports (X-M) falls. This is a leakage from the circular flow, reducing injections. AD = C + I + G + (X-M) decreases, shifting the AD curve leftwards.
Step 3: Diagram. Draw the AD/AS diagram as described. Explain that the leftward shift of AD reduces real GDP from Y1 to Y2 and the price level from P1 to P2. The fall in output means the economy is operating below potential, creating a negative output gap. This raises cyclical unemployment as firms reduce labour demand. The fall in output also reduces actual economic growth (or may cause a recession if large enough).
Step 4: Multiplier effect. The initial fall in (X-M) sets off a multiplier process. The size of the multiplier depends on the marginal propensity to withdraw (saving, taxation, imports). In an open economy with high marginal propensity to import, the multiplier is smaller, but the initial leakage is also larger. The net effect is still a multiplied fall in national income.
Step 5: Inflation effect. Cheaper imports directly reduce the price of consumer goods (imported food, electronics) and also lower costs for firms that use imported raw materials, components, and capital equipment. This shifts the SRAS curve to the right (or reduces the price level along the AD curve). The overall effect on the price level is downward. So appreciation helps achieve low inflation. There may be a trade-off: lower inflation but lower output.
Step 6: Balance of payments. The current account initially worsens because the price change leads to a fall in export revenue and a rise in import spending, assuming volumes adjust slowly. The J-curve effect shows that in the short run, low price elasticities mean volumes do not change much, so the trade balance deteriorates. Over time, as consumers and firms adjust, volumes change more, and if the Marshall-Lerner condition holds (PEDX + PEDM > 1), the trade balance improves eventually. However, if elasticities are low, the current account remains worsened. So the effect on the balance of payments objective is uncertain.
Step 7: Evaluation – factors affecting outcomes.
- Price elasticities: If export demand is inelastic (e.g., unique luxury goods), export revenue may rise (because price rises more than quantity falls). If import demand is inelastic (e.g., essential raw materials), import spending may fall only slightly. In such cases, net exports may not fall much. High elasticities worsen the contraction.
- Openness: A country where (X-M) is a large share of GDP (e.g., Singapore) will feel a bigger impact on AD than a large relatively closed economy (e.g., USA).
- Cause of appreciation: If the appreciation is caused by strong inward investment (capital inflows), that investment itself is a component of AD (part of I) and may offset the trade contraction. Also, if the appreciation is due to higher productivity or strong export demand, the underlying fundamentals are positive.
- Time horizon: Short-run contraction in output may reverse if lower import costs lead to higher productivity and investment, shifting LRAS rightwards over time. This could boost potential growth.
- Reserve currency: For countries whose currency is a global reserve (USD, EUR, GBP), demand for the currency stays high even when it appreciates, limiting the fall in exports. Also, many international transactions are invoiced in dollars, so US firms may not see a drop in demand as severe.
- Policy response: A government or central bank may react to the appreciation by cutting interest rates (if inflation is low) or by expansionary fiscal policy, which could offset the AD fall.
Step 8: Conclusion. Synthesise: An appreciation helps achieve low inflation but hinders growth and employment unless the elasticities are low or the economy is very closed. The balance of payments outcome is ambiguous. Overall, the effect on the achievement of macroeconomic aims depends on which aim is prioritised. If inflation is the primary target (as in inflation targeting regimes), appreciation is helpful. If employment and growth are the focus, appreciation is harmful. A fully justified conclusion would state that the net effect is generally negative for growth and employment in the short run, but the anti-inflationary benefit may be valued. The evaluation must weigh the trade-off and give a verdict.
Key Takeaways
- Exchange rate changes affect the macroeconomy through trade volumes and prices.
- An appreciation is contractionary for AD but disinflationary.
- The Marshall-Lerner condition and J-curve are essential for understanding the balance of payments effect.
- The openness of the economy, elasticities, and time horizon are critical evaluative factors.
- Macroeconomic aims often conflict; a single policy rarely helps all aims simultaneously.
Common Mistakes
- Only discussing the trade effect and ignoring the inflation (cost) effect. The question asks about 'macroeconomic aims', which include inflation.
- Forgetting to include an AD/AS diagram or including one but not explaining the curves and shift. The top band requires diagrams to be fully explained.
- Writing a one-sided answer: only describing the negative effects without evaluating that it might help inflation, or vice versa. Evaluation requires both sides.
- Omitting the conclusion or providing a vague conclusion that does not take a stance. The top band requires a justified conclusion.
- Using the wrong curve labels or axes; not labelling the shift direction.
- Overlooking the multiplier effect when discussing the magnitude of the change in AD.
Things to Be Careful About
- The question says 'a rise in the exchange rate' – treat as appreciation, not revaluation (since not assuming fixed rate), but either is acceptable as long as consistent.
- Use the term 'appreciation' and 'depreciation' correctly.
- If mentioning the J-curve, explain it briefly: in the short run volumes are fixed, so trade balance worsens; eventually volumes adjust.
- The 'effect on the achievement' means consider whether the aim is better achieved or not. For example, low inflation is better achieved with appreciation; full employment is worse achieved.
- Do not treat the diagram as optional: it is explicitly expected by the mark scheme and top band descriptor. Ensure the diagram explanation in the solution describes what happens to each curve.
- Watch for confusion between real and nominal exchange rates. The question says 'exchange rate' – usually nominal. But effects on competitiveness relate to real exchange rate. It's acceptable to mention the distinction if helpful.
Economic growth can only occur when an economy is below full employment.
Evaluate this statement.
Introduction
Economic growth refers to an increase in an economy's real GDP over time. Full employment is the situation where all available labour resources are being used efficiently, with only frictional and structural unemployment (the natural rate of unemployment) remaining. The statement claims that growth can only occur when the economy is below full employment, implying that spare capacity is necessary for growth. This essay will evaluate this claim by distinguishing between actual growth (increases in output due to higher aggregate demand) and potential growth (increases in the economy's productive capacity). It will argue that while growth can occur below full employment, it is also possible at full employment through supply-side improvements.
Growth below full employment
When an economy is below full employment, there is a negative output gap and spare capacity. In this situation, an increase in aggregate demand (AD) can lead to a rise in real output with little or no increase in the price level. This is illustrated in the AD-AS diagram.
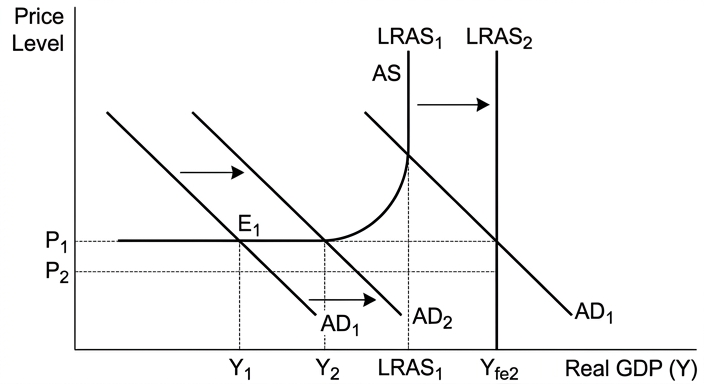
In the Keynesian range of the aggregate supply curve, AD shifts from AD1 to AD2, moving the economy from point E1 to E2, increasing output from Y1 to Y2 while the price level remains at P1. This is actual growth resulting from the utilisation of previously idle resources. Such growth is common during recoveries from recessions, when fiscal or monetary stimulus can boost AD without causing inflation. Therefore, the statement is correct in this context: growth can occur when the economy is below full employment.
Growth at full employment
However, once the economy reaches full employment, the aggregate supply curve becomes vertical (LRAS). In this range, increases in AD cannot raise real output; they only cause inflation, as the economy is at its maximum sustainable output. For growth to occur at full employment, the economy's potential output must increase. This requires a rightward shift of the LRAS curve, driven by improvements in productivity, technological progress, capital accumulation, education, and labour force growth. Such potential growth increases the economy's productive capacity, allowing higher output without inflation. This is illustrated by a shift from LRAS1 to LRAS2 in the diagram, increasing potential output from Yfe to Yfe2. Thus, growth can indeed occur at full employment, contradicting the statement.
Evaluation
The statement is therefore too narrow. It correctly identifies that growth can occur below full employment through demand-side policies, but it ignores the possibility of supply-side growth at full employment. The validity of the statement depends on the time horizon: in the short run, when the economy is in recession, growth is typically demand-led and requires spare capacity. In the long run, however, sustained growth depends on supply-side factors, and the economy can grow even when it is at full employment. Furthermore, the statement assumes that the economy is always below full employment if it is growing, but growth can be accompanied by full employment in the long run. The opportunity cost of focusing solely on demand-side growth is that it may lead to inflationary pressures if the economy is near full capacity. Therefore, a balanced approach incorporating both demand and supply-side policies is necessary for sustainable growth.
Conclusion
In conclusion, the statement that economic growth can only occur when an economy is below full employment is incorrect. Economic growth can take two forms: actual growth below full employment and potential growth at full employment. The statement is partially correct in the short run when the economy has spare capacity, but it fails to account for long-run supply-side growth. Therefore, a more accurate statement would be that growth can occur both below and at full employment, depending on the source of growth.
Economic growth can occur both below full employment (actual growth via AD increases) and at full employment (potential growth via LRAS shifts). The statement is therefore only partially correct; it is too narrow as it ignores the possibility of supply-side-driven growth at full employment.
Background Concept
Economic growth is typically measured as the percentage increase in real GDP over time. It is important to distinguish between two types of growth:
- Actual growth: An increase in the utilisation of existing resources, moving the economy from inside its production possibility frontier (PPF) towards the frontier. This is demand-led and occurs when there is spare capacity.
- Potential growth: An increase in the economy's productive capacity, shifting the PPF outward or the LRAS curve to the right. This is supply-led and driven by factors such as improvements in technology, capital accumulation, labour force growth, and productivity.
Full employment is a situation where the economy is operating at its potential output, with only frictional and structural unemployment (the natural rate of unemployment) present. At full employment, there is no spare capacity; the economy is on its PPF.
The AD-AS model is a key tool. The short-run aggregate supply (SRAS) curve is typically upward-sloping, but in the Keynesian view, it has a horizontal segment at low levels of output due to sticky wages and prices. The long-run aggregate supply (LRAS) is vertical at the potential output level.
Understanding the Question
The question asks you to evaluate the statement: "Economic growth can only occur when an economy is below full employment." This is an absolute claim—it asserts that growth is impossible when the economy is at full employment. To evaluate, you must consider both sides:
- Case for the statement: Growth can occur below full employment (actual growth) through demand-side policies.
- Case against the statement: Growth can also occur at full employment (potential growth) through supply-side policies.
The command word "evaluate" requires a two-sided discussion and a justified conclusion. The top band for AO3 requires a "justified conclusion or judgement that addresses the specific requirements of the question." So you must reach a clear verdict, not just summarise both sides.
Approach
- Define key terms: economic growth, full employment.
- Present the case for the statement: Explain how an increase in AD can raise output when the economy is below full employment, using the AD-AS diagram. Show that this is actual growth and does not cause inflation.
- Present the case against the statement: Explain that at full employment, AD increases only cause inflation, not real growth. To achieve growth at full employment, the LRAS must shift right (potential growth). Use the diagram to illustrate this shift.
- Evaluate the two sides: Compare the short-run vs long-run context, consider the role of inflation, and discuss the opportunity cost of focusing only on demand-side policies.
- Conclude with a justified judgement: The statement is too narrow; growth is possible both below and at full employment.
Use the AD-AS diagram to support both points. Ensure the diagram is fully explained in the text.
Step-by-Step Reasoning
- Define economic growth and full employment: Start with precise definitions. Economic growth is the increase in real GDP over time. Full employment is when the economy is at its potential output, with only the natural rate of unemployment. This sets the stage.
- Explain the AD-AS diagram: Draw the diagram with the Keynesian horizontal segment, upward-sloping segment, and vertical LRAS. Label axes: Price Level (vertical) and Real GDP (horizontal).
- Show actual growth below full employment: Assume the economy is initially at point E1, where AD1 intersects the horizontal SRAS at output Y1 (below full employment, Y1 < Yfe). A rightward shift of AD to AD2 (due to, say, expansionary fiscal policy) moves the economy to point E2, with output Y2 and the same price level P1. This is actual growth. Explain that this occurs because there are idle resources, so firms can increase output without raising prices. This supports the statement.
- Show potential growth at full employment: Now assume the economy is at full employment, with LRAS vertical at Yfe. An increase in AD would only raise the price level, not output (inflation). To achieve growth, the LRAS must shift right from LRAS1 to LRAS2, increasing potential output from Yfe to Yfe2. This can be due to improved technology, education, or capital investment. This is potential growth. The diagram shows this shift, with the new equilibrium at Yfe2 and a lower price level P2 (if AD is unchanged). This contradicts the statement.
- Evaluate: The statement is correct in the short run when the economy is below full employment, but it ignores the long-run possibility of supply-side growth. The context matters: if the economy is in a recession, growth is demand-led and requires spare capacity. If the economy is at full employment, growth must come from supply-side improvements. The opportunity cost of focusing only on demand-side policies is that they may cause inflation if the economy is near full capacity. Therefore, a balanced approach is needed.
- Conclude: The statement is partially correct but too narrow. Economic growth can occur both below full employment (actual growth) and at full employment (potential growth). Therefore, the statement is not universally true.
Key Takeaways
- The distinction between actual and potential growth is crucial.
- Growth can be demand-led (below full employment) or supply-led (at full employment).
- An absolute statement like "only" is often too narrow; evaluation requires considering both sides.
- The AD-AS diagram is a powerful tool for illustrating both scenarios.
- A justified conclusion must weigh the two sides and give a clear judgement.
Common Mistakes
- One-sided answer: Only discussing growth below full employment and ignoring potential growth. This would lose all evaluation marks.
- No diagram or poorly explained diagram: The top band requires accurate use of analytical tools fully explained. A diagram without explanation is insufficient.
- Confusing actual and potential growth: Using the terms interchangeably leads to unclear analysis.
- No conclusion or a vague conclusion: The top band specifically requires a justified conclusion. A summary of both sides without a verdict is not enough.
- Ignoring inflation: At full employment, AD-led growth causes inflation, not real growth. Failing to mention this weakens the analysis.
Things to Be Careful About
- Label the diagram properly: Axes, curves, shifts, and equilibrium points must be clearly labelled. Use the notation from the solution (e.g., AD1, AD2, LRAS1, LRAS2, Y1, Y2, Yfe, Yfe2, P1, P2).
- Define full employment carefully: Note that full employment does not mean zero unemployment; it means the natural rate of unemployment.
- Use the diagram to support both sides: Do not just mention the diagram; explain how it illustrates each scenario.
- Reach a clear verdict: The conclusion should state that the statement is too narrow or partially correct, and justify why.
- Avoid overcomplicating: Stick to the core distinction between actual and potential growth. Additional points like the multiplier or balance of payments could be included but are not necessary for a strong answer.