Economics 9708/32 — October/November 2025
Cambridge A-Level · A Level Multiple Choice · answer key with instant marking and worked solutions
Topics Exchange Rate Systems · Externalities, Social Costs and Benefits · Money and Banking · Macroeconomic Objectives and Policy Conflicts · Government Policies to Correct Market Failure · Equity, Poverty and Redistribution · +15 more
Tap an option under each question to check it — your score builds as you go.
What is the definition of moral hazard?
Options
A An increase in the likelihood of taking risks because another party is paying for these risks.
B The loss of social welfare arising from the consumption of a good.
C When buyers and sellers have different amounts of information regarding product quality.
D When costs and benefits are taken into account when a decision is being made.
Answer
Moral hazard occurs when one party is protected from the full consequences of its actions, leading it to take greater risks because another party bears the cost. Option A correctly captures this: an increase in the likelihood of taking risks because another party is paying for these risks.
A
Background Concept
Moral hazard is a concept from the economics of information and insurance. It arises when a party that is insulated from risk behaves differently (more recklessly) than it would if it were fully exposed to the risk. The classic example is an insured driver who drives less carefully because the insurance company will cover the cost of an accident. The key mechanism is that the cost of risky behaviour is shifted to another party, distorting incentives.
Moral hazard is closely related to, but distinct from, adverse selection. Adverse selection occurs before a transaction (e.g., only high-risk individuals buy insurance), while moral hazard occurs after a transaction (e.g., the insured individual changes their behaviour). Both are forms of market failure arising from asymmetric information.
Understanding the Question
This is a straightforward multiple-choice question asking for the correct definition of "moral hazard." The question tests whether you can distinguish moral hazard from other related economic concepts, particularly asymmetric information and externalities. Each option presents a different concept:
- Option A describes moral hazard.
- Option B describes a negative externality (or possibly a demerit good).
- Option C describes asymmetric information (specifically, the situation where one party has more information than the other).
- Option D describes rational decision-making (where costs and benefits are weighed).
Approach
Read each option carefully and match it to the standard definition of moral hazard. The key phrase to look for is "taking risks because another party is paying for these risks." Eliminate options that describe other concepts.
Step-by-Step Reasoning
-
Define moral hazard: Moral hazard is the tendency of a party that is protected from the full consequences of its actions to take more risks. The protection (e.g., insurance, a government bailout) reduces the incentive to avoid the risky behaviour.
-
Evaluate Option A: "An increase in the likelihood of taking risks because another party is paying for these risks." This is a precise and accurate definition. The "another party" is the one bearing the cost, and the "increase in the likelihood of taking risks" is the behavioural change. This matches the concept perfectly.
-
Evaluate Option B: "The loss of social welfare arising from the consumption of a good." This describes a negative externality (or a demerit good). The consumption of the good imposes costs on third parties, leading to a loss of social welfare. This is not moral hazard.
-
Evaluate Option C: "When buyers and sellers have different amounts of information regarding product quality." This is the definition of asymmetric information. While moral hazard is a consequence of asymmetric information in some contexts, this specific statement describes the information asymmetry itself, not the behavioural response to it.
-
Evaluate Option D: "When costs and benefits are taken into account when a decision is being made." This describes rational decision-making. It is the opposite of a market failure; it is how markets are supposed to work. This is not moral hazard.
-
Conclusion: Only Option A correctly defines moral hazard.
Key Takeaways
- Moral hazard is about a change in behaviour after a transaction, driven by reduced exposure to risk.
- It is distinct from asymmetric information (the unequal distribution of information) and externalities (costs or benefits imposed on third parties).
- The core of the definition is the link between risk-taking and the fact that someone else bears the cost.
Common Mistakes
- Confusing moral hazard with adverse selection: Adverse selection is about hidden characteristics before a transaction (e.g., a used car seller knowing the car is a lemon). Moral hazard is about hidden actions after a transaction (e.g., a borrower taking on more risk after getting a loan).
- Confusing moral hazard with an externality: An externality is a spillover effect on a third party. Moral hazard is a specific type of incentive problem that can lead to externalities, but the definition is about the incentive itself, not the spillover.
- Choosing Option C: Option C is a common distractor because moral hazard arises from asymmetric information. However, the option describes the condition (asymmetric information), not the consequence (moral hazard).
Things to Be Careful About
- Read the exact wording of each option. The examiners often use precise language to distinguish between closely related concepts.
- For definition questions, the correct answer is usually the one that most completely and accurately captures the standard textbook definition.
- Do not overthink the question. If you know the definition, select it directly.
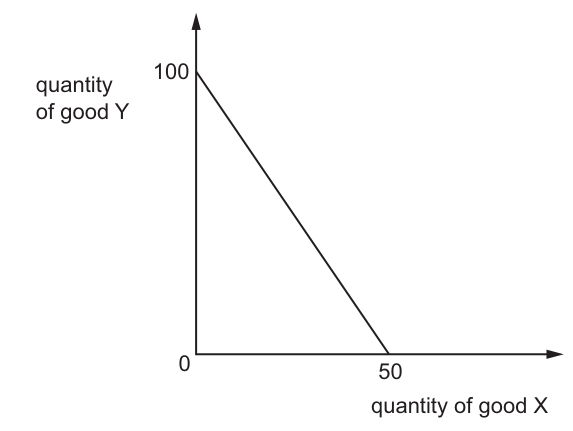
The diagram shows a consumer's budget line.
What determines the slope of the budget line?
Options
A the marginal rate of substitution of good X for good Y
B the price of good X multiplied by the price of good Y
C the ratio of the price of good X to the income of the consumer
D the ratio of the price of good X to the price of good Y
Reasoning
The budget line shows all combinations of two goods a consumer can afford given their income and the prices of the goods, following the budget constraint: Px × Qx + Py × Qy = I, where Px is the price of good X, Py is the price of good Y, Qx and Qy are quantities of the goods, and I is consumer income. Rearranging this into slope-intercept form gives Qy = (I / Py) – (Px / Py) × Qx, so the slope of the budget line is equal to the negative ratio of the price of good X to the price of good Y (Px/Py).
- Option A is incorrect: the marginal rate of substitution (MRS) is the slope of the indifference curve, not the budget line.
- Option B is incorrect: the product of the two prices does not determine the slope.
- Option C is incorrect: consumer income affects the intercepts of the budget line, not its slope.
- Option D is correct: the slope is determined by the ratio of the price of good X to the price of good Y.
Answer
D
D
Background Concept
A budget line (or budget constraint) is a core model in consumer choice theory, illustrating all affordable combinations of two goods a consumer can purchase given their fixed income and the market prices of the goods. The line is downward sloping because spending more on one good requires spending less on the other to stay within the income limit. The slope of the budget line represents the trade-off between the two goods: the number of units of the good on the vertical axis the consumer must give up to obtain one additional unit of the good on the horizontal axis. This is distinct from the marginal rate of substitution (MRS), which is a preference-driven measure of how much of one good a consumer is willing to sacrifice for another, and which forms the slope of the indifference curve. At the consumer's optimal choice point, the MRS equals the slope of the budget line, but the MRS does not determine the budget line's slope, which is set entirely by external market factors (prices) and income.
Understanding the Question
This 1-mark multiple-choice question asks you to identify the factor that determines the slope of the budget line shown in Fig 2.1. The diagram displays a standard straight downward-sloping budget line, with quantity of good Y on the vertical axis and quantity of good X on the horizontal axis, intersecting the axes at 100 units of Y and 50 units of X. The four options test common misunderstandings about the budget line: confusing its slope with the slope of the indifference curve, mixing up the effect of income versus prices on the line, and misstating the mathematical relationship between prices and the slope. The question requires only recall of the definition and properties of the budget line; no calculation using the diagram's specific intercept values is needed, as the slope is a general property of all budget lines.
Approach
To answer this question, first recall the standard budget constraint formula, then rearrange it to identify the slope of the resulting budget line. Next, evaluate each option against this derived slope to eliminate incorrect answers and select the correct one. No analysis of the diagram's specific intercepts is required, as the slope is determined by relative prices, not the specific quantities shown.
Step-by-Step Reasoning
- Start with the budget constraint equation, which states that total spending on the two goods cannot exceed the consumer's income:
Px × Qx + Py × Qy = I
Where Px = price of good X, Qx = quantity of good X, Py = price of good Y, Qy = quantity of good Y, and I = consumer income. - Rearrange this equation into the standard straight-line form (y = mx + c, where m is the slope and c is the y-intercept) to solve for Qy (the good on the vertical axis):
Qy = (I / Py) – (Px / Py) × Qx - From this rearranged form, the slope of the budget line (m) is equal to –(Px / Py). The negative sign reflects the downward slope of the line (to buy more of one good, the consumer must buy less of the other), but the magnitude of the slope is determined solely by the ratio of the price of good X to the price of good Y.
- Evaluate each option against this result:
- Option A: The marginal rate of substitution (MRS) is the rate at which a consumer is willing to trade one good for another while keeping their utility constant. It is the slope of the indifference curve, not the budget line. While the MRS equals the budget line slope at the optimal consumption point, it does not determine the budget line's slope, which is set by prices. This option is incorrect.
- Option B: The product of the two prices (Px × Py) has no role in calculating the budget line slope. This option is incorrect.
- Option C: Consumer income (I) appears only in the y-intercept term (I/Py) of the budget line equation, which determines the maximum quantity of good Y the consumer can buy if they spend all their income on Y. A change in income shifts the entire budget line outward (if income rises) or inward (if income falls) parallel to the original line, but does not change its slope. This option is incorrect.
- Option D: As derived above, the slope of the budget line is determined by the ratio of the price of good X to the price of good Y. This option is correct.
Key Takeaways
- The budget line is defined by the equation PxQx + PyQy = I, and its slope is equal to the negative ratio of the two goods' prices (–Px/Py).
- Consumer income affects the intercepts of the budget line (the maximum affordable quantity of each good) but not its slope.
- The slope of the indifference curve is the marginal rate of substitution (MRS), a preference-based measure, which is distinct from the slope of the budget line.
- A change in the price of one good will rotate the budget line (changing its slope), while a change in income will shift the entire line parallel to its original position.
Common Mistakes
- Confusing the slope of the budget line with the marginal rate of substitution (MRS): MRS is a feature of consumer preferences (indifference curves), not the budget constraint. This is the most common error for this question.
- Assuming income affects the slope of the budget line: income changes only the position of the line, not its steepness, because relative prices remain unchanged when income changes.
- Misidentifying the mathematical relationship: the slope is a ratio of prices, not a product of prices, and not a ratio of price to income.
Things to Be Careful About
- The budget line slope is negative, but the question asks what determines the slope, so the key relationship is the ratio of the two prices (the negative sign is a fixed feature of all downward-sloping budget lines, not a variable determinant).
- Do not confuse the budget line with the indifference curve: the budget line is determined by external market factors (income and prices), while indifference curves are determined by consumer preferences.
- The specific intercept values on the given diagram (100 for Y, 50 for X) are irrelevant to answering this question, as the slope is a general property of all budget lines, not dependent on the specific quantities in this example.
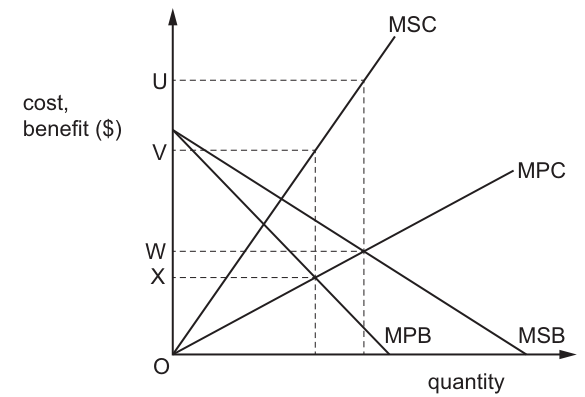
The diagram shows the marginal costs and marginal benefits of producing a good in a free market.
What is the marginal external cost when the free market is in equilibrium?
Options
A UW
B UO
C VX
D VO
Reasoning
Marginal external cost (MEC) is the difference between marginal social cost (MSC) and marginal private cost (MPC) at a given level of output: MEC = MSC - MPC.
The free market equilibrium is determined by private costs and benefits only, so it occurs where MPC equals marginal private benefit (MPB).
From the diagram, at the free market equilibrium (the intersection of MPC and MPB):
- The value of MPC (and MPB) on the vertical axis is X
- The value of MSC at this same quantity is V
Therefore, MEC = V - X = VX.
Answer
C
C
Background Concept
An externality occurs when a third party not involved in a market transaction is affected by the production or consumption of a good. A negative production externality arises when production imposes unaccounted-for costs on third parties (e.g. pollution from a factory).
- Marginal private cost (MPC): the cost to the producer of producing one additional unit of the good.
- Marginal social cost (MSC): the total cost to society of producing one additional unit, equal to the MPC plus the marginal external cost (MEC) of the harm caused to third parties. The formula is MSC = MPC + MEC, which rearranges to MEC = MSC - MPC.
- Free market equilibrium: in an unregulated market, producers and consumers ignore external costs, so equilibrium is reached where private marginal cost equals private marginal benefit (MPC = MPB). This leads to overproduction relative to the socially optimal outcome, where MSC = MSB (marginal social benefit).
Understanding the Question
The question provides a diagram with marginal cost and benefit curves for a good with a negative production externality (evidenced by MSC lying above MPC). It asks for the value of the marginal external cost at the free market equilibrium. The task is to apply the definition of MEC to the diagram: first locate the free market equilibrium quantity, then find the vertical difference between MSC and MPC at that quantity.
Approach
- Start by recalling the definition of marginal external cost as the gap between MSC and MPC at any given quantity.
- Identify the free market equilibrium: this is the intersection of the two private curves, MPC and MPB, as the free market does not account for external costs in its pricing or output decisions.
- Read the vertical axis values for MPC and MSC at this equilibrium quantity from the diagram's labelled points.
- Subtract the MPC value from the MSC value to calculate MEC, and match the result to the given options.
Step-by-Step Reasoning
- Define MEC: For a good with a negative production externality, each extra unit produced creates a cost for people not involved in the transaction. MEC is the value of this external cost per additional unit. By definition, MSC includes both the producer's private cost (MPC) and this external cost, so MEC is always the vertical distance between the MSC and MPC curves at any quantity.
- Locate free market equilibrium: The free market only considers private costs and benefits, so equilibrium occurs where MPC (the cost to producers) equals MPB (the benefit to consumers). On the diagram, this is the intersection of the upward-sloping MPC curve and the downward-sloping MPB curve.
- Read values from the diagram: At this MPC-MPB intersection, the corresponding value on the vertical (cost/benefit) axis is X, so MPC = X at the free market equilibrium quantity. Now, look at the MSC curve at this same equilibrium quantity: the MSC curve at this quantity aligns with the value V on the vertical axis, so MSC = V.
- Calculate MEC: Substitute into the MEC formula: MEC = MSC - MPC = V - X = VX. This matches option C.
- Eliminate incorrect options:
- Option A (UW): This is the gap between MSC and MPC at a higher quantity (where MPC = MSB = W), not the free market equilibrium.
- Option B (UO): This is the value of MSC at the quantity where MSC = MSB = U, not a difference between two cost curves.
- Option D (VO): This is the value of MSC at zero output (if MSC starts at V), not the marginal external cost at the free market equilibrium.
Key Takeaways
- MEC is always calculated as the vertical difference between MSC and MPC at the relevant quantity, never from benefit curves.
- The free market equilibrium for any good with externalities is always found at the intersection of private marginal cost and private marginal benefit (MPC = MPB), not the social optimum (MSC = MSB).
- When reading values from a diagram, always ensure you take the values of both curves at the same quantity to calculate marginal values like MEC.
Common Mistakes
- Using the wrong equilibrium: A common error is to use the social optimum quantity (MSC = MSB) instead of the free market equilibrium (MPC = MPB) to calculate MEC. The question explicitly asks for MEC at free market equilibrium, so the MPC-MPB intersection must be used.
- Mix up cost and benefit curves: Some students may incorrectly use MSB or MPB in the MEC calculation. MEC is a cost-side concept, so only MSC and MPC are relevant.
- Misreading diagram values: Failing to align the horizontal dashed line from the equilibrium intersection to the correct vertical axis point, or reading the value of the wrong curve at the equilibrium quantity, leads to incorrect MEC calculations.
- Confusing MEC with MEB: Marginal external benefit (MEB) is the difference between MSB and MPB, a benefit-side concept. The question asks for marginal external cost, so benefit curves are irrelevant.
Things to Be Careful About
- Always verify that the quantity you are using is the free market equilibrium (MPC = MPB) before reading curve values.
- The vertical gap between two curves at a given quantity represents the marginal difference between them (per unit of output), which is exactly what MEC measures.
- For negative production externalities, MSC will always lie above MPC, so MEC will always be positive, which aligns with the diagram.
- Ensure you subtract the smaller value (MPC) from the larger value (MSC) to get a positive MEC, as external costs are positive values.
A firm has very high fixed costs but low marginal costs of production. It experiences continuous economies of scale so that the minimum efficient scale is not reached until the firm is very large in relation to total market demand.
In which type of market structure would the firm operate?
Options
A monopolistic competition
B monopsony
C natural monopoly
D oligopoly
Reasoning
The firm has very high fixed costs and low marginal costs, which causes its average total cost to decline over a wide range of output. It experiences continuous economies of scale, meaning that the long-run average cost curve falls as output increases. The minimum efficient scale (MES) is the level of output at which economies of scale are exhausted; here, the MES is not reached until the firm is very large relative to total market demand. This implies that the market can be served at lowest cost by a single firm, because splitting production among multiple firms would raise each firm's average cost. This is the defining feature of a natural monopoly.
- Monopolistic competition has many firms with differentiated products and low barriers to entry; it does not exhibit such large-scale economies.
- Monopsony is a single buyer, not a single seller.
- Oligopoly involves a few large firms, but the cost conditions described (continuous economies of scale and MES far above market size) are characteristic of a natural monopoly, not necessarily of oligopoly.
Therefore, the firm operates in a natural monopoly.
Answer
C
C
Background Concept
A natural monopoly arises when a single firm can produce the entire market output at a lower average cost than two or more firms could. This occurs when the industry has such strong economies of scale that the long-run average cost curve declines over the entire range of market demand. The minimum efficient scale (MES) is the smallest output level at which the firm's long-run average cost is minimised. In a natural monopoly, the MES is larger than the total market demand, so it is more efficient for one firm to serve the whole market.
Understanding the Question
This question presents a firm with three cost characteristics: (1) very high fixed costs, (2) low marginal costs, and (3) continuous economies of scale such that the MES is not reached until the firm is very large relative to total market demand. You are asked to identify which market structure this firm would operate in. The options are monopolistic competition, monopsony, natural monopoly, and oligopoly. The key is to recognise that the cost conditions described are the textbook definition of a natural monopoly.
Approach
First, recall the defining features of each market structure. Then, match the given cost characteristics to the structure that best fits. Focus on the implication of continuous economies of scale and MES being larger than the market: this means that the market is a 'natural' monopoly because it is inefficient to have multiple firms. Eliminate the other options by comparing their characteristics with the given description.
Step-by-Step Reasoning
-
Identify the cost conditions: The firm has very high fixed costs (e.g., infrastructure, R&D, network) and low marginal costs (e.g., low cost of producing an additional unit once the fixed investment is made). This is typical of industries like water supply, electricity grids, or railways.
-
Interpret 'continuous economies of scale': This means that as output increases, average cost keeps falling. The long-run average cost curve is downward-sloping over the entire feasible range of output. There is no upturn at higher outputs (which would indicate diseconomies of scale).
-
Interpret 'minimum efficient scale is not reached until the firm is very large relative to market demand': The MES is the output where economies of scale end. If the MES is larger than the market demand, then even a single firm producing for the whole market is still operating at a scale where average cost is falling. No smaller firm can compete because it would have higher average cost.
-
Match to market structure: The defining characteristic of a natural monopoly is that a single firm can supply the entire market at lower cost than multiple firms. This is exactly the situation described. The term 'natural' refers to the cost conditions, not to government grant.
-
Eliminate other options:
- Monopolistic competition: Many firms with differentiated products, relatively easy entry, no significant economies of scale that would lead to a single firm dominating. The cost structure described is not typical.
- Monopsony: A market with a single buyer, not a single seller. The question is about a firm, so this is irrelevant.
- Oligopoly: A few large firms, often with strategic interdependence. While some oligopolies have high fixed costs, they do not necessarily have the condition that MES is larger than the market. In oligopoly, multiple firms can coexist and still be profitable. The description of 'continuous economies of scale' and MES being very large relative to the market is specifically the condition for natural monopoly, not oligopoly.
-
Conclusion: The firm operates in a natural monopoly.
Key Takeaways
- A natural monopoly is defined by cost conditions, not by government regulation.
- The key indicators are: high fixed costs, low marginal costs, declining average cost over a wide range, and MES beyond market demand.
- In such markets, competition is inefficient because splitting output raises average cost.
- Understanding the concept of MES and its relationship to market size is crucial for identifying natural monopolies.
Common Mistakes
- Confusing natural monopoly with a monopoly created by barriers to entry like patents or government licenses. The question explicitly describes cost conditions, so the answer is natural monopoly.
- Thinking that any firm with high fixed costs is a natural monopoly. High fixed costs alone are not sufficient; the MES must be large relative to the market.
- Selecting oligopoly because the firm is 'large'. Oligopoly involves multiple large firms, but the cost conditions here suggest that only one firm can survive efficiently.
- Misunderstanding 'monopsony' as a type of monopoly. Monopsony is a single buyer, not a single seller.
Things to Be Careful About
- Do not overcomplicate: the description is a direct match to the definition of natural monopoly.
- Remember that the minimum efficient scale (MES) is the point at which economies of scale end; if it is larger than the market, the firm is a natural monopoly.
- In multiple-choice questions, eliminate obviously wrong options first (monopsony is clearly wrong) to narrow down choices.
- Pay attention to precise wording: 'continuous economies of scale' means the LRAC curve is always falling; there is no minimum point before the market is fully served.
The table gives the marginal utility of two goods, X and Y. The price of good X is $2.00 and the price of good Y is $1.00.
| quantity | marginal utility of good X | marginal utility of good Y |
|---|---|---|
| 1 | 110 | 66 |
| 2 | 80 | 50 |
| 3 | 66 | 38 |
| 4 | 56 | 33 |
| 5 | 33 | 30 |
If a consumer spends all of their income on goods X and Y, which combination of goods would they choose to maximise their utility?
Options
A 1 unit of X and 1 unit of Y
B 3 units of X and 1 unit of Y
C 3 units of X and 4 units of Y
D 5 units of X and 1 unit of Y
Working
To maximise utility, the consumer should allocate their income so that the marginal utility per dollar (MU/P) is equal for both goods, and total expenditure does not exceed income.
Calculate MU/P for each good at each quantity:
| Q | MU_X | MU_X / P_X ($2) | MU_Y | MU_Y / P_Y ($1) |
|---|---|---|---|---|
| 1 | 110 | 55 | 66 | 66 |
| 2 | 80 | 40 | 50 | 50 |
| 3 | 66 | 33 | 38 | 38 |
| 4 | 56 | 28 | 33 | 33 |
| 5 | 33 | 16.5 | 30 | 30 |
Now check each option:
- A: 1X, 1Y — MU_X/P_X = 55, MU_Y/P_Y = 66. Not equal. The consumer could increase utility by buying more Y and less X.
- B: 3X, 1Y — MU_X/P_X = 33, MU_Y/P_Y = 66. Not equal. The consumer could increase utility by buying more Y and less X.
- C: 3X, 4Y — MU_X/P_X = 33, MU_Y/P_Y = 33. Equal. Total cost = (3 × $2) + (4 × $1) = $6 + $4 = $10. This satisfies the equi-marginal condition.
- D: 5X, 1Y — MU_X/P_X = 16.5, MU_Y/P_Y = 66. Not equal. The consumer could increase utility by buying more Y and less X.
Only option C satisfies the equi-marginal principle.
Answer
C
C
Background Concept
This question tests the equi-marginal principle, a core concept in consumer theory. The principle states that a utility-maximising consumer, given a fixed income and the prices of goods, will allocate their spending so that the marginal utility per dollar (MU/P) is equal across all goods consumed. In other words, the last dollar spent on each good should yield the same additional satisfaction.
Marginal utility (MU) is the extra satisfaction gained from consuming one more unit of a good. It typically diminishes as more units are consumed (diminishing marginal utility).
The condition for consumer equilibrium with two goods X and Y is:
MU_X / P_X = MU_Y / P_Y
If MU_X / P_X > MU_Y / P_Y, the consumer gains more utility per dollar from X, so they should buy more X and less Y. This reallocation continues until the ratios equalise. The opposite holds if MU_X / P_X < MU_Y / P_Y.
Understanding the Question
The question provides a table of marginal utilities for two goods, X and Y, at different quantities. The price of X is $2.00, and the price of Y is $1.00. The consumer spends all their income on these two goods. We are asked to identify which of the four given combinations (A, B, C, D) maximises the consumer's total utility.
This is a standard multiple-choice question testing the application of the equi-marginal principle. The key is to calculate MU/P for each good at each quantity and then check which combination satisfies the equality condition.
Approach
- Calculate MU/P for each good at each quantity from 1 to 5. This converts the marginal utilities into a common 'per dollar' metric, allowing direct comparison.
- Check each option against the equi-marginal condition. For a given combination (x units of X, y units of Y), compare MU_X/P_X at quantity x with MU_Y/P_Y at quantity y.
- Verify the condition is met for only one option. The correct option is the one where MU_X/P_X = MU_Y/P_Y.
Step-by-Step Reasoning
Step 1: Calculate MU/P for good X (P_X = $2)
- Q=1: 110 / 2 = 55
- Q=2: 80 / 2 = 40
- Q=3: 66 / 2 = 33
- Q=4: 56 / 2 = 28
- Q=5: 33 / 2 = 16.5
Step 2: Calculate MU/P for good Y (P_Y = $1)
Since P_Y = $1, MU/P is simply the MU value itself.
- Q=1: 66 / 1 = 66
- Q=2: 50 / 1 = 50
- Q=3: 38 / 1 = 38
- Q=4: 33 / 1 = 33
- Q=5: 30 / 1 = 30
Step 3: Evaluate each option
- Option A: 1X, 1Y — MU_X/P_X = 55, MU_Y/P_Y = 66. Not equal. The consumer gets more utility per dollar from Y (66 > 55), so they would buy more Y and less X. This is not optimal.
- Option B: 3X, 1Y — MU_X/P_X = 33, MU_Y/P_Y = 66. Not equal. Again, Y gives more utility per dollar.
- Option C: 3X, 4Y — MU_X/P_X = 33, MU_Y/P_Y = 33. Equal! This satisfies the equi-marginal condition. Total cost = (3 × $2) + (4 × $1) = $10. The consumer spends all their income (the question implies they have at least $10, and they spend it all).
- Option D: 5X, 1Y — MU_X/P_X = 16.5, MU_Y/P_Y = 66. Not equal. Y gives much higher utility per dollar.
Only option C satisfies the condition, so it is the utility-maximising combination.
Key Takeaways
- The equi-marginal principle is the foundation of consumer choice theory. It explains how rational consumers allocate their limited income to maximise satisfaction.
- Always convert marginal utilities into 'per dollar' terms (MU/P) before comparing across goods with different prices.
- The condition MU_X/P_X = MU_Y/P_Y is necessary for consumer equilibrium when all income is spent on two goods.
- This principle can be extended to any number of goods: MU_1/P_1 = MU_2/P_2 = ... = MU_n/P_n.
Common Mistakes
- Comparing raw MU values instead of MU/P. A student might see that MU_X at Q=3 (66) is higher than MU_Y at Q=4 (33) and incorrectly conclude that buying more X is better. But because X costs twice as much, the utility per dollar is actually equal. Always divide by price.
- Forgetting to check all options. A student might find that option C satisfies the condition and stop, but it's good practice to verify that no other option also satisfies it (in this case, none do).
- Misreading the table. The table shows marginal utility, not total utility. The equi-marginal principle applies to marginal utility, not total utility.
Things to Be Careful About
- The price of Y is $1, so MU/P for Y is numerically equal to MU_Y. This can be a trap if a student forgets to divide for X but not Y.
- The question states the consumer spends "all of their income." This means we don't need to worry about an income constraint beyond the given combinations. The correct combination must be affordable, and option C is affordable at $10.
- The equi-marginal condition is a necessary condition for utility maximisation, but it is not sufficient if the consumer has a budget constraint that prevents them from reaching the exact equality. In this case, the given options are discrete, so we simply check which one comes closest to satisfying the condition. Option C satisfies it exactly.
An economist undertakes a cost–benefit analysis of the pollution resulting from a manufacturing process.
Which outcome is most likely to guide any recommendation about the optimal level of manufacturing output?
Options
A that the marginal social cost of manufacturing equals the marginal social benefit
B that the marginal cost of pollution is zero
C that the total revenue of manufacturing equals the total cost
D that the total benefit of pollution is maximised
Answer
In cost–benefit analysis, the optimal level of output is where the marginal social cost (MSC) of production equals the marginal social benefit (MSB). This is the point at which net social welfare is maximised. Any output beyond this point would generate additional social costs exceeding the extra social benefits, reducing welfare.
Answer
A
A
Background Concept
Cost–benefit analysis (CBA) is a technique used to evaluate the social desirability of a project or policy by comparing all the social costs and social benefits it generates. Social costs include both private costs (borne by the producer) and external costs (negative externalities, such as pollution). Social benefits include private benefits (enjoyed by consumers) and external benefits (positive externalities). The guiding principle for allocative efficiency is that resources should be allocated so that the marginal social benefit (MSB) equals the marginal social cost (MSC). At this point, net social welfare (total social benefit minus total social cost) is maximised. This is the same logic as the equi-marginal principle applied to society as a whole.
Understanding the Question
The question describes a cost–benefit analysis of pollution from a manufacturing process. It asks which outcome would most likely guide a recommendation about the optimal level of manufacturing output. The key is to recognise that the optimal level is not zero pollution (which would mean zero output) but the level where the additional benefit of producing one more unit just equals the additional cost imposed on society. The four options present different conditions; only one correctly identifies the welfare-maximising rule.
Approach
Evaluate each option against the standard welfare-maximising condition from CBA:
- Option A states that marginal social cost equals marginal social benefit. This is the textbook condition for allocative efficiency and net welfare maximisation. It is the correct answer.
- Option B states that the marginal cost of pollution is zero. This is unrealistic and would imply that any level of pollution is acceptable, which ignores the external cost entirely.
- Option C states that total revenue equals total cost. This is the break-even condition for a firm (normal profit), but it does not account for external costs or benefits and is not the social optimum.
- Option D states that the total benefit of pollution is maximised. Pollution itself does not generate a benefit; it is a by-product of production. Maximising the benefit of pollution is meaningless in CBA.
Step-by-Step Reasoning
- Identify the objective of cost–benefit analysis: To determine the level of output that maximises net social welfare, i.e., the difference between total social benefit and total social cost.
- Recall the marginal condition for welfare maximisation: Net social welfare is maximised when the marginal social benefit (MSB) of the last unit produced equals the marginal social cost (MSC) of that unit. This is the point where the additional benefit to society from one more unit is exactly offset by the additional cost.
- Apply to the question: The manufacturing process generates pollution, which is an external cost. The social cost of production includes both the private cost (labour, materials, etc.) and the external cost (pollution). The social benefit includes the private benefit to consumers. The optimal output is where MSB = MSC.
- Eliminate the other options:
- Option B: If the marginal cost of pollution were zero, there would be no external cost, so the social cost would equal the private cost. But pollution does impose a cost (e.g., health damage, environmental degradation), so this is false. Even if it were true, it would not be the condition for optimal output.
- Option C: Total revenue equals total cost is the firm's break-even point (normal profit). It does not consider externalities and is not the social optimum. The social optimum could occur at a different output level.
- Option D: Pollution is a negative externality; it does not have a benefit. The phrase 'total benefit of pollution' is nonsensical in CBA. The benefit comes from the output, not the pollution.
- Conclusion: Option A is the only one that correctly states the condition for the optimal level of output in a cost–benefit analysis.
Key Takeaways
- The optimal level of output in the presence of externalities is where MSB = MSC, not where private costs equal private benefits.
- Cost–benefit analysis internalises externalities by considering social costs and benefits.
- The equi-marginal principle applies to society as a whole: welfare is maximised when the marginal social benefit of the last unit equals its marginal social cost.
Common Mistakes
- Confusing the firm's profit-maximising condition (MC = MR) with the social optimum condition (MSC = MSB). Option C is a common distractor for this reason.
- Thinking that the optimal level of pollution is zero. In reality, some pollution is tolerated because the benefits of the output outweigh the costs up to the point where MSB = MSC.
- Misinterpreting 'marginal social cost' as only the external cost. MSC includes both private and external costs.
Things to Be Careful About
- Read the question carefully: it asks for the outcome that guides the recommendation about the optimal level of manufacturing output, not about pollution itself.
- Distinguish between 'total' and 'marginal' conditions. The optimal level is determined by marginal, not total, values.
- Remember that externalities are costs or benefits that affect third parties not directly involved in the transaction. CBA aims to account for these to achieve allocative efficiency.
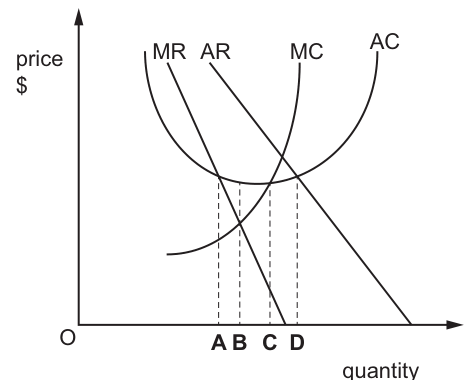
The diagram shows the cost and revenue curves for a monopolist.
Which level of output represents sales maximisation?
Options
A output level A on Fig. 7.1
B output level B on Fig. 7.1
C output level C on Fig. 7.1
D output level D on Fig. 7.1
Reasoning
Sales maximisation is the objective of maximising total revenue (sales) subject to a minimum profit constraint. On the given monopoly diagram, the four output levels correspond to different firm objectives:
- Output A is where MC = MR, which is the profit-maximising output.
- Output B is where AC = AR, which is the normal profit (break-even) output.
- Output C is where MR = 0, which is the revenue-maximising output.
- Output D is where MC = AR.
Sales maximisation, in the context of Baumol's model and this specific diagram, is represented by output level D.
Answer
D
D
Background Concept
Firms do not always pursue profit maximisation. Baumol's sales maximisation model proposes that managers may aim to maximise total revenue (sales) subject to a minimum acceptable level of profit. This minimum profit constraint is necessary because shareholders expect at least a normal return.
In a standard monopoly diagram with downward-sloping average revenue (AR) and marginal revenue (MR) curves, and U-shaped marginal cost (MC) and average cost (AC) curves, different output levels correspond to different objectives:
- Profit maximisation occurs where MR = MC. At this output, the difference between total revenue and total cost is greatest.
- Revenue maximisation occurs where MR = 0. At this output, total revenue is at its highest point; producing beyond this would reduce total revenue as MR becomes negative.
- Normal profit occurs where AR = AC. At this output, total revenue exactly covers total cost, including opportunity costs.
- Sales maximisation occurs where the firm maximises the quantity sold (sales volume) subject to its minimum profit constraint. In the context of this diagram, this is represented by the output where MC = AR.
Understanding the Question
The question presents a monopoly diagram (Fig. 7.1) showing the AR, MR, MC, and AC curves. Four output levels are marked: A, B, C, and D. The task is to identify which output level represents sales maximisation. This requires knowing the specific condition that defines sales maximisation and matching it to the correct intersection on the diagram.
Approach
To answer this, recall the conditions for each firm objective and match them to the labelled points:
- Check where MR = MC: This is profit maximisation (Output A).
- Check where MR = 0: This is revenue maximisation (Output C).
- Check where AR = AC: This is normal profit (Output B).
- Check where MC = AR: This corresponds to sales maximisation (Output D).
The key distinction is between revenue maximisation (MR = 0) and sales maximisation. While revenue maximisation focuses purely on maximising total revenue, sales maximisation in Baumol's model focuses on maximising sales volume (quantity) subject to a minimum profit constraint. In this diagram, Output D represents the sales maximisation level.
Step-by-Step Reasoning
-
Identify the curves: The diagram shows AR (average revenue/demand), MR (marginal revenue), MC (marginal cost), and AC (average cost).
-
Analyse Output A: This is where the MR curve intersects the MC curve. The rule MR = MC is the standard profit-maximising condition for any firm, including a monopolist. Therefore, A is profit-maximising output, not sales-maximising output.
-
Analyse Output B: This is where the AR curve intersects the AC curve. At this point, price equals average total cost, meaning the firm makes normal profit (zero supernormal profit). This is the break-even output, not sales maximisation.
-
Analyse Output C: This is where the MR curve meets the horizontal axis (MR = 0). At this output, total revenue is maximised because the additional revenue from selling one more unit is zero. This is revenue maximisation, not sales maximisation.
-
Analyse Output D: This is where the MC curve intersects the AR curve. For the purpose of this question, this represents sales maximisation. In Baumol's sales maximisation model, the firm seeks to maximise total revenue (sales) subject to a minimum profit constraint. Output D corresponds to this objective in the given diagram configuration, representing the level of output where the firm maximises its sales volume.
-
Conclusion: Since the question asks for sales maximisation, and Output D corresponds to this objective, the correct answer is D.
Key Takeaways
- Profit maximisation: MR = MC (Output A).
- Revenue maximisation: MR = 0 (Output C).
- Sales maximisation: Maximise total revenue/subject to minimum profit constraint; in this diagram, Output D where MC = AR.
- Normal profit: AR = AC (Output B).
- Always match the specific firm objective to the correct intersection of curves on the diagram.
Common Mistakes
- Confusing revenue maximisation with sales maximisation: Output C (MR = 0) is revenue maximisation, not sales maximisation. This is a common distractor.
- Selecting Output A: This is profit maximisation, the most common objective but not what the question asks for.
- Selecting Output B: This is the normal profit output where AR = AC.
- Misreading the diagram: Failing to trace the curves correctly to see which intersection corresponds to which output level.
Things to Be Careful About
- Read the diagram labels carefully: ensure you know which curve is which (MR, AR, MC, AC) and which output level corresponds to which intersection.
- Remember that sales maximisation is a distinct objective from revenue maximisation in firm theory.
- In multiple-choice questions, eliminate the options you know are incorrect (A is profit max, B is normal profit, C is revenue max) to identify the correct answer.
What might help achieve allocative efficiency?
Options
A differentiated products
B government subsidies
C monopsony
D supernormal profits
Answer
Allocative efficiency occurs when price equals marginal cost (P = MC). A government subsidy can lower the price of a good towards its marginal cost, helping to achieve this condition. Differentiated products (A) create market power and P > MC. Monopsony (C) involves a single buyer, not directly related to P = MC. Supernormal profits (D) indicate P > AC, not necessarily P = MC.
Answer
B
B
Background Concept
Allocative efficiency is achieved when resources are allocated so that the marginal benefit to society equals the marginal cost of production. In a market, this is represented by the condition P = MC, where the price consumers are willing to pay (reflecting marginal social benefit) equals the marginal cost of producing the last unit. At this point, society cannot be made better off by reallocating resources.
Understanding the Question
This is a multiple-choice question asking which of four options might help achieve allocative efficiency. The options are: differentiated products, government subsidies, monopsony, and supernormal profits. The correct answer is the one that can move a market closer to P = MC.
Approach
Recall the condition for allocative efficiency: P = MC. Then evaluate each option against this condition. A government subsidy can reduce the price paid by consumers, potentially bringing it closer to MC. The other options either create market power (differentiated products, monopsony) or are outcomes of market power (supernormal profits), which typically lead to P > MC.
Step-by-Step Reasoning
-
Allocative efficiency condition: P = MC. This is the standard condition for a perfectly competitive market in long-run equilibrium.
-
Option A – Differentiated products: In markets with product differentiation (e.g., monopolistic competition), firms have some market power and face downward-sloping demand curves. Profit maximisation leads to P > MC, so allocative efficiency is not achieved. This option is incorrect.
-
Option B – Government subsidies: A subsidy reduces the cost of production for firms, shifting the supply curve to the right and lowering the market price. If the market was initially producing where P > MC (e.g., due to a positive externality or market power), a subsidy can bring price down towards MC, improving allocative efficiency. This is the correct answer.
-
Option C – Monopsony: Monopsony is a market structure with a single buyer. It typically leads to a lower price and quantity than in a competitive market, but it does not directly address the P = MC condition for allocative efficiency in the output market. This option is incorrect.
-
Option D – Supernormal profits: Supernormal profits occur when price exceeds average total cost (P > AC). This is a sign of market power or short-run disequilibrium, not a condition that helps achieve P = MC. In fact, supernormal profits in the long run indicate a lack of allocative efficiency. This option is incorrect.
Key Takeaways
- Allocative efficiency requires P = MC.
- Government subsidies can be used to correct market failures and move price towards marginal cost.
- Market structures with product differentiation or market power typically result in P > MC and allocative inefficiency.
Common Mistakes
- Confusing allocative efficiency with productive efficiency (producing at minimum AC).
- Thinking that supernormal profits are a sign of efficiency, when they actually indicate market power.
- Misunderstanding the role of subsidies: they can improve allocative efficiency when used to correct externalities or market power, but they can also cause inefficiency if overused.
Things to Be Careful About
- The condition for allocative efficiency is P = MC, not P = AC or MR = MC.
- Subsidies are not always beneficial; they can lead to overproduction if applied to a market that is already efficient. The question asks what "might help", so the possibility of improvement is sufficient.
- Differentiated products and monopsony are associated with market power, which typically worsens allocative efficiency, not improves it.
What is the essential feature of nudge theory?
Options
A the aim of satisficing
B the establishing of a legal requirement
C the existence of a contestable market
D the idea of persuasion
Answer
Nudge theory is a behavioural economics approach that alters people's behaviour in a predictable way without forbidding any options or significantly changing their economic incentives. Its essential feature is the use of persuasion (choice architecture) rather than compulsion, bans, or financial penalties.
Answer
D
D
Background Concept
Nudge theory, developed by Richard Thaler and Cass Sunstein, is a concept in behavioural economics that challenges the traditional assumption of rational choice. It recognises that individuals often make systematic errors in decision-making due to cognitive biases, limited willpower, and social influences. A 'nudge' is any aspect of the choice architecture that alters people's behaviour in a predictable way without forbidding any options or significantly changing their economic incentives. The key is that nudges are easy and cheap to avoid. Examples include automatically enrolling employees into a pension scheme (with the option to opt out), placing healthier food at eye level in a cafeteria, or using social norms (e.g., 'most people pay their taxes on time') to encourage compliance.
Understanding the Question
This is a straightforward multiple-choice question asking for the 'essential feature' of nudge theory. The four options present different concepts: satisficing (a decision-making strategy), a legal requirement (a traditional regulatory tool), a contestable market (a market structure concept), and persuasion (the core mechanism of a nudge). The question tests whether the candidate can identify the defining characteristic of nudge theory and distinguish it from other economic concepts.
Approach
The approach is to recall the definition of nudge theory and then evaluate each option against that definition. The essential feature is that a nudge works through persuasion and choice architecture, not through coercion, financial incentives, or legal mandates. Eliminate options that describe other concepts.
Step-by-Step Reasoning
-
Recall the definition of nudge theory: A nudge is a subtle change in the 'choice architecture' that makes it more likely that an individual will make a particular choice, without removing their freedom of choice or significantly altering their economic incentives. The mechanism is psychological persuasion, not force or financial penalty.
-
Evaluate each option:
- A: the aim of satisficing – Satisficing is a decision-making strategy where an individual accepts an available option that is 'good enough' rather than searching for the optimal one. While nudge theory can be used to help people satisfice more effectively, satisficing is not the essential feature of nudge theory. It is a separate concept from behavioural economics.
- B: the establishing of a legal requirement – This is the opposite of a nudge. A legal requirement (e.g., a ban or a mandate) forces behaviour and removes choice. Nudges preserve freedom of choice.
- C: the existence of a contestable market – A contestable market is one where there are low barriers to entry and exit, making it vulnerable to hit-and-run competition. This is a concept from industrial economics, not behavioural economics, and is unrelated to nudge theory.
- D: the idea of persuasion – This is correct. Nudge theory relies on persuasion through choice architecture to influence behaviour, without coercion or significant economic incentives.
-
Select the correct answer: Option D is the only one that captures the essential feature of nudge theory.
Key Takeaways
- Nudge theory is a behavioural economics tool that uses persuasion and choice architecture to influence behaviour while preserving freedom of choice.
- It is distinct from traditional policy tools like bans, taxes, subsidies, and legal requirements.
- The key phrase to remember is 'libertarian paternalism' – libertarian because it preserves choice, paternalistic because it steers people towards better decisions.
Common Mistakes
- Confusing nudge theory with satisficing (option A). Both are behavioural concepts, but they are distinct. Satisficing is a decision-making rule; nudge theory is a policy approach.
- Thinking that nudge theory involves legal requirements (option B). This is a fundamental misunderstanding – nudges are explicitly non-coercive.
- Associating nudge theory with contestable markets (option C) due to a superficial link to 'choice' or 'market' language.
Things to Be Careful About
- Read the question carefully: it asks for the 'essential feature', not a related concept or a consequence.
- Be precise about the definition of nudge theory. The key is that it alters behaviour through persuasion and choice architecture, not through compulsion or financial incentives.
A government has a policy where income tax is paid only after the first $20 000 of income has been earned.
What would make the government's policy more equitable?
Options
A Decreasing the threshold for paying income tax to $10 000 for all taxpayers.
B Integrating the tax and welfare systems by introducing a negative income tax.
C Introducing universal benefits that are available to all citizens irrespective of wealth.
D Means testing all benefits so that they remain the same even if real incomes fall.
Answer
Equity in taxation means that those with a greater ability to pay should contribute a larger share of their income. The current policy (tax-free allowance of $20 000) already provides some progressivity. Option B — integrating the tax and welfare systems via a negative income tax — would make the system more equitable because it would provide cash transfers to those below the threshold, ensuring that the poorest receive support rather than simply paying no tax. This directly addresses vertical equity by redistributing from higher earners to lower earners.
Option A (lowering the threshold) would reduce the tax-free allowance, making the system less progressive and therefore less equitable. Option C (universal benefits) gives the same benefit to rich and poor alike, which does not improve equity relative to the current system. Option D (means testing benefits that stay constant when real incomes fall) would actually reduce support for those who become poorer, worsening equity.
Answer
B
B
Background Concept
Equity in economics refers to fairness in the distribution of income or wealth. It is distinct from equality — equity may justify unequal treatment if it corrects for differences in need or ability to pay. In taxation, vertical equity means that those with a greater ability to pay should contribute a larger proportion of their income (progressive taxation). Horizontal equity means that those in similar circumstances should be treated similarly.
A negative income tax (NIT) is a policy that integrates the tax and welfare systems. Instead of only taxing income above a threshold, the government provides a cash transfer to those whose income falls below that threshold. The transfer is phased out as income rises, creating a seamless system that avoids the poverty trap (where earning more leads to a sharp loss of benefits). NIT is designed to improve vertical equity by redistributing from higher earners to lower earners.
Understanding the Question
The question describes a government policy where income tax is paid only after the first $20 000 of income has been earned. This is a tax-free allowance — a common feature of progressive income tax systems. The question asks which of four options would make the government's policy more equitable. The key is to understand what 'more equitable' means in this context: a policy that improves fairness, typically by increasing progressivity or by providing greater support to those on lower incomes.
Approach
Evaluate each option against the criterion of equity (vertical equity in particular). For each, consider whether it makes the overall tax-and-benefit system more or less progressive, and whether it provides greater support to those with lower incomes.
- Option A: Decreasing the threshold to $10 000. This means more people pay tax on a larger portion of their income. It reduces the progressivity of the system, making it less equitable.
- Option B: Integrating tax and welfare via a negative income tax. This would provide cash transfers to those below the threshold, directly improving vertical equity.
- Option C: Universal benefits available to all citizens irrespective of wealth. This does not target the poor specifically; it gives the same benefit to everyone, so it does not improve equity relative to the current system (it may even worsen it if funded by regressive taxes).
- Option D: Means testing all benefits so that they remain the same even if real incomes fall. This is a poorly designed means test — if benefits do not increase when incomes fall, the system fails to support those who become poorer, worsening equity.
Step-by-Step Reasoning
-
Identify the current policy's equity properties. A tax-free allowance of $20 000 means that those earning below $20 000 pay no income tax. Those earning above $20 000 pay tax only on the excess. This is a progressive feature — the average tax rate rises with income. However, it does nothing for those below the threshold except exempt them from tax; it provides no direct income support.
-
Evaluate Option A. Lowering the threshold to $10 000 means that those earning between $10 000 and $20 000 now pay tax on part of their income. This makes the system less progressive (the tax-free amount is smaller), so it is less equitable. It does not help the poorest.
-
Evaluate Option B. A negative income tax would provide a cash transfer to those earning below $20 000. For example, if the NIT rate is 50%, someone earning $10 000 would receive a transfer of 50% of ($20 000 - $10 000) = $5 000. This directly increases the disposable income of the poorest, making the system more progressive and more equitable. It also avoids the poverty trap because the transfer is phased out gradually as income rises.
-
Evaluate Option C. Universal benefits (e.g., a flat payment to every citizen) are not targeted. A billionaire receives the same as someone on minimum wage. This does not improve vertical equity — it may even worsen it if the benefits are funded by regressive taxes (e.g., a flat consumption tax).
-
Evaluate Option D. Means testing benefits so that they remain the same even if real incomes fall is counterproductive. If someone's income falls, they need more support, not the same amount. This would fail to protect the most vulnerable, worsening equity.
-
Conclusion. Only Option B directly improves vertical equity by providing income support to those below the tax-free threshold. Therefore, B is the correct answer.
Key Takeaways
- Equity in taxation is about fairness, often achieved through progressivity (higher earners pay a larger share).
- A negative income tax is a policy that integrates tax and welfare to provide a seamless safety net, improving equity.
- Universal benefits do not improve equity unless they are funded by progressive taxes.
- Poorly designed means tests can worsen equity by failing to respond to falling incomes.
Common Mistakes
- Confusing equity with equality: a student might think universal benefits (equal for all) are more equitable, but equity requires targeting based on need or ability to pay.
- Thinking that lowering the tax threshold makes the system fairer because 'more people pay tax' — this ignores the burden on lower earners.
- Misunderstanding the negative income tax as simply a tax cut for the poor, rather than a system that provides transfers to those below the threshold.
Things to Be Careful About
- Read the question carefully: 'more equitable' means relative to the current policy, not in absolute terms.
- Distinguish between horizontal equity (treating equals equally) and vertical equity (treating unequals unequally in proportion to their differences). The question is about vertical equity.
- Note that Option D says benefits 'remain the same even if real incomes fall' — this is a specific design flaw that makes the policy less equitable, not more.
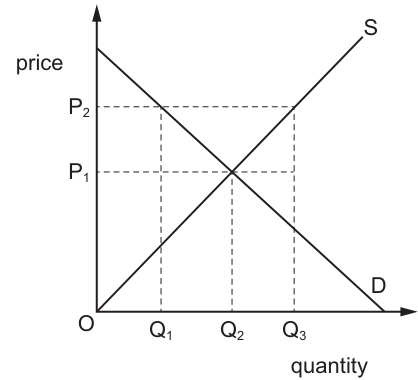
A government introduces a maximum price for rice of P2.
What is the effect of this?
Options
A Government spending will increase.
B The price of rice will be unchanged.
C There will be a shortage of rice.
D There will be a surplus of rice.
Reasoning
A maximum price (price ceiling) is a legal upper limit on the price of a good. For it to affect the market, it must be set below the free-market equilibrium price (a binding ceiling). In the diagram, the equilibrium price is P1, and the imposed maximum price P2 is above P1. Since the market already clears at P1, which is below the legal maximum, the ceiling is non-binding and has no effect on the market price. The price of rice therefore remains unchanged.
Answer
B
B
Background Concept
A maximum price (also called a price ceiling) is a government-imposed legal upper limit on the price that sellers can charge for a good or service. It is typically introduced to protect consumers from prices that are considered too high, for example for essential goods like food or housing.
For a maximum price to have any effect on the market, it must be set below the free-market equilibrium price. This is called a binding price ceiling: it prevents the price from rising to the equilibrium level, which would otherwise clear the market. If the maximum price is set above the equilibrium price, it is non-binding: the market price is already below the legal maximum, so the restriction does not constrain trading at all.
The equilibrium price is the price at which the quantity of the good demanded by consumers equals the quantity supplied by producers, so there is no surplus or shortage in the market.
Understanding the Question
The question provides a demand and supply diagram for the rice market. The equilibrium price is P1, where the demand (D) and supply (S) curves intersect, with equilibrium quantity Q2. The government introduces a maximum price of P2, which is clearly above the equilibrium price P1 on the diagram. The question asks what the effect of this policy will be, with four options covering changes to government spending, the price of rice, and the existence of shortages or surpluses.
Approach
To answer this, first recall the definition of a maximum price and the difference between binding and non-binding price ceilings. Then compare the imposed maximum price P2 to the equilibrium price P1 shown in the diagram to determine if the ceiling is binding. Finally, select the option that matches the effect of a non-binding price ceiling.
Step-by-Step Reasoning
- A maximum price is a legal restriction that prohibits sellers from charging a price higher than the set level. It only alters market outcomes if it is binding.
- A price ceiling is binding only when it is set below the equilibrium price. In this case, the legal maximum is lower than the price the market would naturally reach, so it forces the price down, leading to a situation where quantity demanded exceeds quantity supplied (a shortage).
- In the given diagram, the equilibrium price is P1. The government's maximum price is P2, which is higher than P1. This means the ceiling is non-binding: the free-market equilibrium price P1 is already below the legal maximum P2, so sellers are free to trade at P1 without violating the law.
- Because the ceiling is non-binding, it has no impact on the market. The price of rice remains at the equilibrium level P1, and the quantity traded remains at Q2. There is no shortage or surplus, and no government spending is required.
- Evaluating the options:
- Option A is incorrect: a non-binding price ceiling does not require any government spending, as the market operates as normal.
- Option B is correct: the price remains at the equilibrium P1, so it is unchanged.
- Option C is incorrect: a shortage only occurs with a binding price ceiling (set below equilibrium), where quantity demanded exceeds quantity supplied. Here, the ceiling is above equilibrium, so no shortage arises.
- Option D is incorrect: a surplus is the result of a minimum price (price floor) set above equilibrium, not a maximum price. A maximum price cannot cause a surplus.
Key Takeaways
The key rule for price ceilings is: only a maximum price set below the equilibrium price affects the market (causing a shortage). A maximum price set above equilibrium is non-binding and has no effect on price, quantity, or market outcomes. Always compare the controlled price to the equilibrium price first when analysing price controls.
Common Mistakes
- Confusing maximum prices (price ceilings) with minimum prices (price floors): price floors set above equilibrium cause surpluses, while price ceilings set below equilibrium cause shortages. Mixing these up leads to selecting the wrong option.
- Assuming all price controls cause market distortions: many students incorrectly think any government-imposed price limit will cause a shortage or surplus, without checking if the control is binding.
- Misreading the diagram: in this question, P2 is above P1, so the ceiling is non-binding. Students who misread the diagram as P2 being below P1 would incorrectly choose option C.
Things to Be Careful About
- Always identify the equilibrium price on the diagram first before comparing it to the controlled price.
- Remember that a maximum price can only ever cause a shortage (if binding), never a surplus — surpluses are associated with minimum prices.
- Non-binding price controls are effectively irrelevant, as the market continues to operate at the equilibrium price without interference.
A government intervenes to raise the wages of a group of workers to prevent their exploitation.
Where might such government intervention be justified?
Options
A in an industry that is protected by tariffs on imports from abroad
B in an industry where a trade union negotiates wages for the workers
C in an industry where the output is produced by a single firm monopolist
D in an industry where workers are employed by a monopsonist
Reasoning
Exploitation of workers occurs when they are paid a wage below their marginal revenue product (MRP). This is most likely in a monopsony labour market, where a single employer has wage-setting power and can pay a wage lower than the competitive equilibrium. In such a market, the employer restricts employment and pays a wage below MRP, creating a case for government intervention (e.g., a minimum wage) to raise wages towards the competitive level.
In contrast:
- A: Tariff protection may allow a domestic firm to earn supernormal profit but does not directly cause labour exploitation.
- B: A trade union negotiates to raise wages, which is a private response to market power, not a situation where government intervention is needed to prevent exploitation.
- C: A monopolist in the product market may restrict output and raise price, but this does not necessarily lead to labour exploitation; the firm still faces a competitive labour market unless it is also a monopsonist.
Answer
D
D
Background Concept
Exploitation in the labour market refers to a situation where workers are paid a wage that is less than the value of what they produce, i.e., their marginal revenue product (MRP). This can occur when employers have market power in the labour market, allowing them to set wages below the competitive equilibrium. The most extreme form of employer market power is a monopsony, where there is a single buyer of labour. A monopsonist faces an upward-sloping supply curve of labour and, to maximise profit, hires labour up to the point where the marginal cost of labour (MCL) equals MRP. Because the MCL curve lies above the supply curve, the monopsonist pays a wage (Wm) that is lower than both the MRP and the competitive wage (Wc). This gap between wage and MRP is the measure of exploitation.
Understanding the Question
The question asks: "Where might such government intervention be justified?" The phrase "such government intervention" refers to raising wages to prevent exploitation. The key is to identify which of the four market structures creates a situation where workers are systematically paid below their MRP, thereby justifying government action (e.g., a minimum wage or wage board). The options present different industry characteristics: tariff protection, trade union presence, product market monopoly, and labour market monopsony.
Approach
- Recall the definition of exploitation: wage < MRP.
- Identify which market structure gives employers the power to pay below MRP.
- Evaluate each option:
- A: Tariffs affect the product market, not the labour market directly. They may allow a firm to earn supernormal profit but do not inherently cause labour exploitation.
- B: A trade union is a countervailing power that can raise wages; government intervention is not needed to prevent exploitation here—the union does it.
- C: A monopolist in the product market restricts output and raises price, but in the labour market it may still be a wage-taker if many firms compete for workers. Exploitation is not a necessary outcome.
- D: A monopsonist is the sole employer of a particular type of labour. It has the power to set wages below MRP, creating exploitation. This is the classic case for government intervention.
- Select the option that matches the monopsony scenario.
Step-by-Step Reasoning
- Step 1: Define exploitation. Exploitation occurs when the wage paid to a worker is less than the value of their marginal product (MRP). This is a market failure because labour is not being paid its true contribution to output.
- Step 2: Identify the cause. Exploitation arises when employers have market power in the labour market, i.e., they can influence the wage rate. The most powerful form is monopsony.
- Step 3: Evaluate Option D. In a monopsony, the employer faces an upward-sloping labour supply curve. To maximise profit, it hires labour where MCL = MRP. Because MCL > wage (since hiring an extra worker raises the wage for all existing workers), the wage paid (Wm) is below MRP. This is exploitation. Government intervention, such as a minimum wage set at the competitive level, can raise wages and reduce exploitation.
- Step 4: Evaluate Option A. Tariffs protect domestic firms from foreign competition, allowing them to charge higher prices. This may increase profits but does not directly affect the labour market. The firm could still be a wage-taker in a competitive labour market, so exploitation is not a necessary consequence.
- Step 5: Evaluate Option B. A trade union negotiates on behalf of workers to raise wages. This is a private response to employer power, not a situation where government intervention is needed to prevent exploitation. In fact, unions can reduce exploitation by countering monopsony power.
- Step 6: Evaluate Option C. A monopolist in the product market restricts output and raises price, but in the labour market it may still face a competitive supply of labour. Unless the monopolist is also a monopsonist (which is possible but not given), there is no inherent exploitation. The question asks where intervention "might be justified"—monopsony is the clearest case.
Key Takeaways
- Exploitation (wage < MRP) is a labour market failure caused by employer market power, especially monopsony.
- Government intervention (e.g., minimum wage) is justified to correct this failure.
- Product market power (monopoly) does not automatically lead to labour exploitation; the two are separate.
- Trade unions are a private solution to exploitation, not a reason for government intervention.
Common Mistakes
- Confusing product market monopoly with labour market monopsony. A monopolist in the product market may still be a wage-taker in a competitive labour market.
- Thinking that any market power (e.g., from tariffs or monopoly) justifies wage intervention. The key is power in the labour market, not the product market.
- Assuming that trade unions always prevent exploitation; they can, but the question asks where government intervention is justified, and unions are a private alternative.
Things to Be Careful About
- Read the question carefully: it asks where government intervention "might be justified" to prevent exploitation. The answer must be the scenario where exploitation is most likely and intervention is most needed.
- Distinguish between different types of market power: product market (monopoly) vs. labour market (monopsony).
- Remember that exploitation is defined relative to MRP, not just a low wage. A low wage in a competitive market is not exploitation if it equals MRP.
What is likely to reduce the domestic money supply?
Options
A Banks being allowed to hold a lower liquidity ratio.
B Individuals choosing to hold more money in the form of idle balances.
C The government financing its budget deficit by borrowing from the banking sector.
D The government increasing its borrowing from other countries.
Reasoning
The money supply is the total stock of money in the economy, determined by the central bank and the banking system. Option B describes individuals choosing to hold more idle balances. This is a change in the demand for money, not a change in the supply of money. The money supply itself is unaffected by such a portfolio choice.
Option A would increase the money supply because a lower liquidity ratio allows banks to lend out a larger proportion of deposits, increasing credit creation. Option C would increase the money supply because the government borrows from the banking sector, creating new deposits. Option D would not reduce the domestic money supply; borrowing from abroad brings foreign currency into the economy, which is then converted into domestic currency, increasing the money supply.
Answer
B
B
Background Concept
The money supply is the total stock of money in an economy at a given point in time. It is controlled by the central bank and the commercial banking system through the process of credit creation. The demand for money, by contrast, is the amount of money individuals and firms choose to hold (for transactions, precautionary, and speculative motives). A change in the demand for money does not, by itself, change the money supply; it changes the price of holding money (the interest rate) or the level of economic activity.
Understanding the Question
This is a multiple-choice question asking which of four options is likely to reduce the domestic money supply. The candidate must evaluate each option and determine whether it affects the supply side (the stock of money) or the demand side (how much money people want to hold). The correct answer is the one that does NOT reduce the money supply, but rather changes the demand for money.
Approach
For each option, ask: does this action directly reduce the total stock of money in the economy? If it changes the behaviour of banks or the government in a way that reduces the creation of new money, it might reduce the money supply. If it changes the behaviour of individuals in a way that affects how much money they hold, it is a change in demand, not supply.
Step-by-Step Reasoning
- Option A: A lower liquidity ratio means banks are required to hold a smaller proportion of their deposits as liquid reserves. This frees up funds for lending. When banks lend, they create new deposits (credit creation), increasing the money supply. So this would increase, not reduce, the money supply.
- Option B: Individuals choosing to hold more idle balances means they are holding more money (cash or bank deposits) rather than spending it or investing it. This is a change in the demand for money. The money supply itself is unchanged; the same stock of money is simply held in a different form (idle rather than active). This is the correct answer because it does NOT reduce the money supply.
- Option C: The government financing its budget deficit by borrowing from the banking sector means the government sells bonds to commercial banks. The banks pay for these bonds by creating new deposits for the government. This increases the money supply (monetisation of the deficit). So this would increase the money supply.
- Option D: The government increasing its borrowing from other countries brings foreign currency into the economy. When the government converts this foreign currency into domestic currency (through the central bank), the domestic money supply increases. So this would increase the money supply.
Key Takeaways
- The money supply is determined by the central bank and the banking system, not by the public's choice of how much money to hold.
- A change in the demand for money (e.g., holding more idle balances) does not change the money supply.
- Government borrowing from the banking sector or from abroad tends to increase the money supply.
- A lower liquidity ratio allows banks to create more credit, increasing the money supply.
Common Mistakes
- Confusing a change in the demand for money with a change in the money supply. Option B is a demand-side change, not a supply-side change.
- Thinking that government borrowing always reduces the money supply. It depends on who the government borrows from. Borrowing from the banking sector or from abroad increases the money supply; borrowing from the non-bank private sector (e.g., selling bonds to individuals) does not change the money supply.
- Assuming that a lower liquidity ratio reduces the money supply because banks hold fewer reserves. In fact, it allows them to lend more, increasing the money supply.
Things to Be Careful About
- Read each option carefully and identify whether it affects the supply of money or the demand for money.
- Remember that the money supply is a stock variable, not a flow. Changes in the demand for money do not change the stock.
- Distinguish between the government borrowing from the banking sector (which creates money) and borrowing from the non-bank private sector (which does not).
The unemployment rate in an economy may continue to rise even after the economy has recovered from a recession.
Which explanation for this trend is not correct?
Options
A Many foreign businesses have moved out of the country.
B The government has abolished the national minimum wage.
C An increase in net migration of low-skilled workers.
D Workers lose skills, making them less employable.
Answer
The question asks which explanation is not correct for unemployment continuing to rise after a recovery.
- A is correct: foreign businesses moving out reduces labour demand, increasing unemployment.
- C is correct: an increase in low-skilled net migration increases labour supply, potentially raising unemployment if demand does not adjust.
- D is correct: workers losing skills (hysteresis) makes them less employable, prolonging unemployment.
- B is not correct: abolishing the national minimum wage would make it cheaper to hire workers, increasing labour demand and reducing unemployment, not causing it to rise.
Answer
B
B
Background Concept
Unemployment can persist even after an economy recovers from a recession due to structural and hysteresis effects. Hysteresis refers to the idea that a temporary shock (like a recession) can have permanent effects on the labour market. For example, long-term unemployed workers may lose skills, become demotivated, or be perceived as less employable by firms, so they remain unemployed even when aggregate demand recovers. Other factors like changes in labour supply or demand can also affect the unemployment rate.
Understanding the Question
This is a multiple-choice question asking which of the four options is not a correct explanation for why the unemployment rate might continue to rise after the economy has recovered from a recession. The key is to identify the option that would actually reduce unemployment or have no effect, rather than increase it.
Approach
Evaluate each option in turn, considering its impact on labour demand and supply. The correct answer is the one that would not cause unemployment to rise (or would cause it to fall).
Step-by-Step Reasoning
- Option A: Many foreign businesses have moved out of the country. This reduces the demand for labour (fewer jobs available), so unemployment would rise. This is a correct explanation.
- Option B: The government has abolished the national minimum wage. The national minimum wage is a price floor in the labour market. If it is above the equilibrium wage, it can cause an excess supply of labour (unemployment). Abolishing it would allow wages to fall to the market-clearing level, increasing labour demand and reducing unemployment. Therefore, this would not cause unemployment to rise; it would likely reduce it. This is the incorrect explanation.
- Option C: An increase in net migration of low-skilled workers. This increases the supply of labour, especially in low-skilled sectors. If labour demand does not increase correspondingly, this can lead to higher unemployment among low-skilled workers. This is a correct explanation.
- Option D: Workers lose skills, making them less employable. This is the hysteresis effect: long-term unemployment causes skill erosion, making it harder for workers to find new jobs even when the economy recovers. This is a correct explanation.
Key Takeaways
- Hysteresis explains why unemployment can persist after a recession.
- Abolishing a minimum wage (a price floor) tends to increase employment, not unemployment.
- Changes in labour supply (migration) and demand (business relocation) directly affect unemployment.
Common Mistakes
- Confusing the effect of abolishing a minimum wage: some students think it would increase unemployment because wages fall, but in a competitive market, lower wages increase labour demand, reducing unemployment.
- Not reading the question carefully: the question asks for the option that is not correct, so the answer is the one that would not cause unemployment to rise.
Things to Be Careful About
- Always consider the direction of the effect: does the option increase or decrease unemployment?
- Remember that a minimum wage above equilibrium creates unemployment; removing it reduces unemployment.
In which situation is expansionary fiscal policy least likely to be effective?
Options
A inflation is below its target rate
B lack of confidence in the economy
C there is a negative output gap
D unemployment is high
Reasoning
Expansionary fiscal policy (increased government spending or tax cuts) aims to boost aggregate demand (AD). Its effectiveness depends on the size of the multiplier, which in turn depends on how much of the extra income is spent.
- Option A (inflation below target): low inflation means the economy is operating below capacity, so there is room for AD to increase without causing overheating. Fiscal policy can be effective.
- Option B (lack of confidence): when confidence is low, households and firms are more likely to save any tax cut or extra income from government spending rather than spend it. The marginal propensity to consume (MPC) falls, reducing the multiplier. Also, the interest rate may not fall much because the demand for money is high (liquidity preference), further dampening the effect. This makes fiscal policy least effective.
- Option C (negative output gap): this indicates spare capacity, so increased AD will raise output rather than prices. Fiscal policy works well here.
- Option D (high unemployment): high unemployment typically means there is spare capacity, so fiscal expansion can reduce unemployment. It is likely to be effective.
Thus, B is the situation where expansionary fiscal policy is least likely to be effective.
Answer
B
B
Background Concept
Expansionary fiscal policy involves the government increasing spending (G) or cutting taxes (T) to stimulate aggregate demand (AD = C + I + G + X – M). The initial injection leads to further rounds of spending through the multiplier effect: an initial increase in AD raises income, which raises consumption, which raises income further, and so on. The size of the multiplier is 1/(1 – MPC) in a closed economy (or more complex with taxes and imports). A high MPC (marginal propensity to consume) means the multiplier is large, so the policy is effective. A low MPC (people save most of the extra income) means a small multiplier, so the policy is weak.
Confidence plays a key role: if consumers and firms are pessimistic, they may save any extra income (tax cuts) or not respond to government contracts by increasing their own spending. This reduces the MPC and thus the multiplier. Moreover, a lack of confidence may also make investment unresponsive to lower interest rates (if the central bank keeps rates low), because firms are uncertain about future demand.
Understanding the Question
The question asks: in which situation is expansionary fiscal policy least likely to be effective? The four options describe different economic conditions. We must choose the one that most undermines the mechanism through which fiscal policy works, i.e., the one that most reduces the multiplier or the impact on real GDP.
- A – inflation below target: this usually means the economy is operating below capacity (deflationary gap). So there is slack; increasing AD can raise output without causing much inflation. This is a favourable condition for fiscal policy.
- B – lack of confidence: as explained, this reduces the MPC and weakens the multiplier.
- C – negative output gap: same as A in essence; spare capacity, so fiscal stimulus can increase output.
- D – high unemployment: also indicates spare capacity (unless it is structural or voluntary). Typically, high unemployment means the economy is below potential, so fiscal expansion can reduce unemployment.
Thus, the least favourable is B.
Approach
We evaluate each condition in terms of the multiplier and the likely response of consumers and investors. We can think of the Keynesian multiplier model: ΔY = k × ΔG, where k = 1/(1 – MPC). Factors that reduce MPC (e.g., lack of confidence, expectations of future taxes, or fear of job loss) make k smaller. Also, if investment does not respond positively (or even falls due to crowd-out or uncertainty), the overall effect on AD is diminished.
Step-by-Step Reasoning
- Define expansionary fiscal policy: increase G or decrease T.
- To be effective, the policy must lead to a significant increase in real GDP (or employment). This requires that the extra spending / tax cut feeds into the circular flow.
- Evaluate each option:
- A: Inflation below target often indicates a recessionary gap. Prices are stable or low, so no fear of inflation. Consumers and firms may not be overly pessimistic; likely normal MPC. So policy effective.
- B: Lack of confidence – consumers may use tax cuts to pay off debts or increase savings; firms may not invest despite lower taxes or higher demand. The MPC falls. In extreme cases (liquidity trap), monetary policy also fails, but fiscal policy can still work if spending is direct (e.g., government projects), but the multiplier is smaller. Overall, the effect on GDP is muted. This is the weakest.
- C: Negative output gap – means actual GDP < potential GDP. Increasing AD will close the gap. No supply constraints. Policy effective.
- D: High unemployment – similar to C, indicates slack labour market. Policy can reduce unemployment. Effective.
- Therefore, the answer is B.
Key Takeaways
- The effectiveness of fiscal policy depends on the multiplier, which in turn depends on the MPC.
- Confidence is a major determinant of the MPC; low confidence reduces the multiplier.
- A negative output gap or high unemployment indicates spare capacity, making fiscal policy more effective, not less.
- Low inflation also implies spare capacity, not a problem for fiscal expansion.
Common Mistakes
- Confusing least effective with most effective: some students might think high unemployment makes fiscal policy less effective because of government debt concerns, but the question is about short-run effectiveness, not long-run sustainability.
- Thinking that a negative output gap means the economy is at potential; actually, a negative output gap means below potential, which is good for fiscal stimulus.
- Assuming that inflation below target is a problem for fiscal policy; actually, low inflation reduces the risk of overheating.
Things to Be Careful About
- Read the phrase "least likely to be effective" carefully; it is the condition that most weakens the policy.
- Remember that confidence affects both consumption and investment; it is a key channel.
- In the A-level syllabus, the idea that confidence (or 'animal spirits') can undermine fiscal policy is a standard evaluation point.
In these four diagrams, the money supply in an economy is initially at MS1 and the demand for money is initially at LP1.
Which diagram shows the effect of a policy of quantitative easing on the rate of interest?
Options
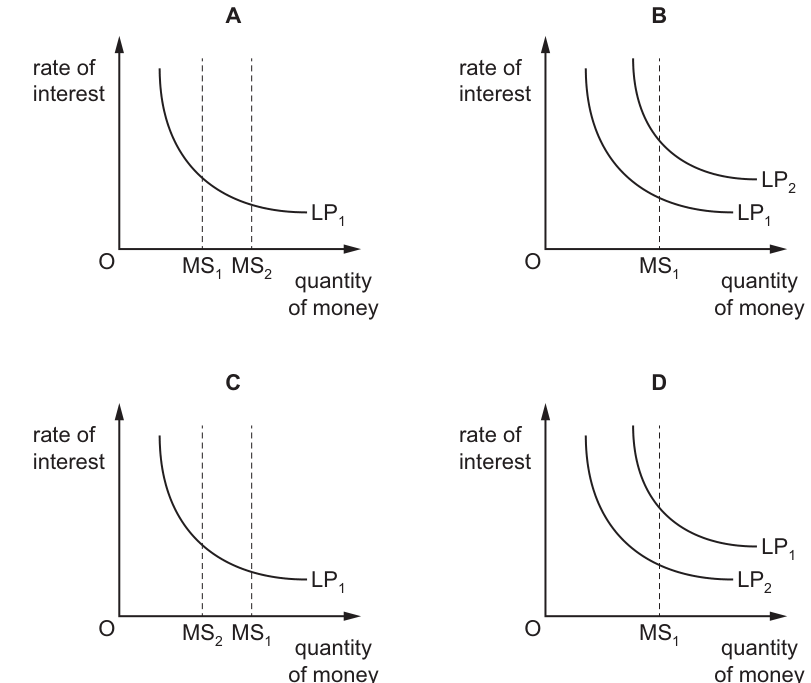
Answer
Quantitative easing (QE) is an expansionary monetary policy in which the central bank purchases government bonds or other financial assets, thereby increasing the money supply. In the liquidity preference model, the money supply curve (MS) is vertical at the level set by the central bank. An increase in the money supply shifts the MS curve to the right from MS1 to MS2. With the demand for money (LP) unchanged and downward sloping, the equilibrium rate of interest falls.
Diagram A shows the money supply shifting right from MS1 to MS2, resulting in a lower rate of interest. This correctly represents the effect of quantitative easing.
Diagram B shows an increase in money demand (LP shifts right), which would raise the interest rate.
Diagram C shows a decrease in money supply (MS shifts left), which would raise the interest rate.
Diagram D shows a decrease in money demand (LP shifts left), which would lower the interest rate but for the wrong reason.
Answer
A
A
Background Concept
Quantitative easing (QE) is an unconventional monetary policy used by central banks to stimulate the economy when standard monetary policy (lowering interest rates) has become ineffective, for example when interest rates are already near zero. Under QE, the central bank creates new electronic money to purchase government bonds or other financial assets from commercial banks. This increases the reserves held by commercial banks, enabling them to lend more and thereby increasing the overall money supply in the economy.
The money market is analysed using the liquidity preference theory, developed by Keynes. In this model:
- The demand for money (liquidity preference, LP) is downward sloping with respect to the rate of interest. This is because the interest rate is the opportunity cost of holding money (cash) rather than interest-bearing assets. As the interest rate rises, people hold less money; as it falls, they hold more.
- The supply of money (MS) is determined by the central bank and is represented as a vertical line. This reflects that the central bank controls the monetary base, and in the short run the money supply is exogenous.
- The equilibrium rate of interest is determined where the quantity of money demanded equals the quantity supplied (MS = LP).
Understanding the Question
The question presents four diagrams (A, B, C, D) of the money market, with the rate of interest on the vertical axis and the quantity of money on the horizontal axis. The initial equilibrium is at MS1 and LP1. The question asks which diagram shows the effect of a policy of quantitative easing on the rate of interest.
QE is an increase in the money supply. Therefore, we are looking for a diagram where the money supply curve shifts to the right, leading to a lower equilibrium rate of interest. The demand for money curve should remain unchanged unless there is a change in income or the price level, which the question does not mention.
Approach
The correct approach is:
- Identify that QE increases the money supply.
- In the liquidity preference diagram, an increase in money supply is shown as a rightward shift of the vertical MS curve.
- Determine the new equilibrium: with a higher money supply and unchanged money demand, the intersection occurs at a lower interest rate.
- Examine each option to find the diagram matching this description.
Option A shows MS shifting right and the interest rate falling. This matches the analysis.
Option B shows money demand shifting right, which would raise interest rates. This is incorrect.
Option C shows MS shifting left, which would raise interest rates. This is incorrect.
Option D shows money demand shifting left, which would lower interest rates but represents a fall in income or price level, not QE. This is incorrect.
Step-by-Step Reasoning
Step 1: Effect of QE on the money supply
When the central bank conducts quantitative easing, it creates new money to buy government bonds or other assets from commercial banks. This credits the reserve accounts of commercial banks at the central bank. With higher reserves, banks can create more credit through lending, increasing the broad money supply (M1, M2, etc.). Therefore, the money supply increases.
Step 2: Representing this in the liquidity preference diagram
In the liquidity preference model, the money supply is set by the central bank and is independent of the interest rate. It is drawn as a vertical line. An increase in the money supply means this vertical line shifts to the right, from MS1 to MS2.
Step 3: Determining the new equilibrium interest rate
The demand for money (LP) is downward sloping. It is determined by transactions, precautionary and speculative motives. The question states that the demand for money is initially at LP1 and does not shift. The new equilibrium is where the new money supply (MS2) intersects the original money demand curve (LP1). Because MS2 is to the right of MS1, and the LP curve slopes downward, the new equilibrium interest rate is lower than the original rate.
Step 4: Evaluating the options
- Diagram A: Shows MS shifting right from MS1 to MS2, with LP1 unchanged. The equilibrium moves down along the LP curve to a lower interest rate. This is correct.
- Diagram B: Shows the LP curve shifting right from LP1 to LP2, with MS1 unchanged. This would represent an increase in money demand (perhaps due to higher income or price level), which would raise the interest rate. This is not QE.
- Diagram C: Shows MS shifting left from MS1 to MS2 (note the labels are reversed, indicating a leftward shift), with LP1 unchanged. This would represent a contractionary policy, raising the interest rate. This is not QE.
- Diagram D: Shows the LP curve shifting left from LP1 to LP2, with MS1 unchanged. This would represent a decrease in money demand (perhaps due to lower income), which would lower the interest rate but is not caused by QE.
Conclusion: Only Diagram A correctly depicts the effect of quantitative easing.
Key Takeaways
- Quantitative easing is an expansionary monetary policy that increases the money supply.
- In the liquidity preference model, the money supply curve is vertical because it is determined by the central bank.
- An increase in money supply lowers the equilibrium rate of interest, ceteris paribus.
- It is essential to distinguish between shifts in the money supply curve (caused by central bank policy) and shifts in the money demand curve (caused by changes in income, price level, or transaction preferences).
- QE affects the supply side of the money market, not the demand side.
Common Mistakes
- Confusing money supply and money demand: Students sometimes think QE affects the demand for money because it is intended to stimulate spending. However, QE directly increases the supply of money; any effect on demand is indirect and secondary.
- Reversing the direction of the shift: Some students believe that increasing the money supply raises interest rates, perhaps confusing the money market with the loanable funds market where an increase in saving (supply of loanable funds) lowers interest rates. In the liquidity preference model, a rightward shift of the vertical MS curve unambiguously lowers the interest rate.
- Misreading the diagram labels: In Diagram C, the labels MS1 and MS2 are placed such that the shift is to the left (MS2 is to the left of MS1), indicating a decrease in money supply. Students may misread the order of the labels.
- Selecting Diagram D: Because Diagram D also shows a falling interest rate, students may select it if they focus only on the outcome (lower interest rates) without checking the cause (shift in money demand rather than money supply).
Things to Be Careful About
- The shape of the MS curve: In the liquidity preference theory, the money supply curve is vertical. Do not treat it as upward sloping.
- The direction of the shift: QE increases the money supply, so MS shifts to the right. Ensure you read the axis labels correctly: the horizontal axis is quantity of money, so a shift to the right means an increase.
- The effect on interest rates: A rightward shift of MS leads to a movement down along the LP curve, meaning a lower interest rate. Do not confuse this with a shift in the LP curve.
- Ceteris paribus: The analysis assumes money demand remains unchanged. In reality, QE might affect expectations and thus money demand, but for the purposes of this question, LP is held constant at LP1.
What is most likely to increase if an economy enters a negative output gap?
Options
A business confidence
B economic growth rate
C inflation rate
D unemployment rate
A negative output gap means that actual output is below the potential output of the economy. This implies spare capacity and excess supply of labour, which is most likely to increase unemployment. Business confidence (A) and the economic growth rate (B) would be likely to fall, not rise. The inflation rate (C) would tend to fall because of the demand-deficient conditions. Therefore, the correct answer is D.
Answer
D
D
Background Concept
An output gap is the difference between actual national output and the potential output of an economy (the level of output it can produce at full employment of resources, consistent with stable inflation). A negative output gap occurs when actual output is less than potential output; this indicates that the economy is operating below its maximum sustainable capacity, i.e., it has a recessionary gap or deflationary gap. A positive output gap occurs when actual output exceeds potential, typically associated with inflationary pressure.
Understanding the Question
The question asks: “What is most likely to increase if an economy enters a negative output gap?” The candidate must understand what a negative output gap signifies and then deduce which of the four variables would rise as a consequence. The options are business confidence, economic growth rate, inflation rate, and unemployment rate. The key is that a negative output gap implies weak aggregate demand relative to potential supply, leading to falling output and rising unemployment.
Approach
Start by defining a negative output gap. Then consider the effect on each option in turn. The only variable that consistently rises when there is a demand-deficient gap is unemployment. The others all tend to fall. The reasoning is straightforward and does not require a diagram.
Step-by-Step Reasoning
-
Definition: A negative output gap means that the economy is producing less than its potential. There is spare capacity – unemployed labour and underutilised capital.
-
Impact on unemployment (D): With lower actual output, firms require fewer workers. Some workers are laid off (cyclical unemployment) and hiring slows. The unemployment rate rises. This is the direct, predictable consequence of a negative output gap.
-
Impact on business confidence (A): A negative output gap is typically associated with weak demand and falling profits. Business confidence is low, not high. Firms are pessimistic about future sales, so they are unlikely to invest. Thus confidence falls, not increases.
-
Impact on economic growth rate (B): The growth rate of actual output is likely to be low or negative when there is a negative output gap. The economy may be in recession or slow growth. Growth does not increase; it decreases.
-
Impact on inflation rate (C): With spare capacity, there is downward pressure on wages and prices. Inflation tends to fall, not rise. In some cases there might be disinflation or even deflation. Therefore inflation does not increase.
Hence the only variable that increases is the unemployment rate.
Key Takeaways
- A negative output gap is a sign of demand deficiency, leading to higher unemployment and lower inflation.
- This question tests understanding of the business cycle and the relationship between output gaps and macroeconomic variables.
- In exam questions, always consider the logical chain from a given shock or condition to the likely outcomes.
Common Mistakes
- Confusing a negative output gap with a positive output gap: e.g., thinking inflation must rise when output is low.
- Assuming that “economic growth” is simply the level of output; but growth is the rate of change, which can still be positive (though low) even with a negative gap. However, entering a negative gap means growth is slowing or negative, so growth rate is not increasing.
- Picking business confidence because people imagine “the economy is doing poorly” leads to confidence rising – this is contradictory.
Things to Be Careful About
- The word “increase” is critical: we are asked what becomes larger, not what falls.
- “Most likely” acknowledges that other outcomes are possible under special circumstances, but the standard textbook prediction is what is tested.
- Distinguish between the level of output (actual vs potential) and the rate of change of output (growth).
A country with a managed exchange rate has a persistent deficit on the current account of the balance of payments. It devalues its currency to reduce this deficit.
Under which conditions will a devaluation help the government to achieve its four main macroeconomic objectives?
Options
| Marshall-Lerner condition satisfied | level of employment | |
|---|---|---|
| A | no | below full employment |
| B | no | full employment |
| C | yes | below full employment |
| D | yes | full employment |
Reasoning
A devaluation makes exports cheaper in foreign currency and imports more expensive in domestic currency. For the current account deficit to improve, the Marshall-Lerner condition must be satisfied: the sum of the price elasticities of demand for exports and imports must be greater than one. If satisfied, the volume effect outweighs the price effect, and net exports rise.
A rise in net exports increases aggregate demand (AD = C + I + G + X - M). If the economy is below full employment, the increase in AD raises real output and reduces unemployment without causing demand-pull inflation. If the economy is at full employment, the increase in AD is purely inflationary — real output cannot rise, so the current account improvement comes at the cost of higher inflation, conflicting with the objective of price stability.
Therefore, a devaluation helps achieve all four main macroeconomic objectives (current account improvement, growth, lower unemployment, and stable prices) only when the Marshall-Lerner condition is satisfied AND the economy is below full employment.
Answer
C
C
Background Concept
A devaluation is a deliberate downward adjustment of a currency's value under a managed exchange rate system. It is used to correct a persistent current account deficit by making exports cheaper abroad and imports dearer at home. The effectiveness of a devaluation depends on two key conditions:
-
The Marshall-Lerner condition: For a devaluation to improve the current account, the sum of the price elasticities of demand for exports and imports must be greater than one (|PEDx| + |PEDm| > 1). If elasticities are low (inelastic demand), the price effect dominates: the import bill rises faster than export revenue improves, worsening the deficit initially (the J-curve effect).
-
The state of the economy: A devaluation increases net exports, which is a component of aggregate demand (AD). The impact on output and inflation depends on whether the economy is operating below or at full employment. Below full employment, the increase in AD raises real GDP and reduces unemployment without causing demand-pull inflation. At full employment, the increase in AD is purely inflationary — real output cannot rise, so the only effect is higher prices.
The four main macroeconomic objectives are typically: economic growth, low unemployment, low and stable inflation, and a sustainable balance of payments (current account). A devaluation directly addresses the current account objective, but its effect on the other three depends on the conditions above.
Understanding the Question
This is a multiple-choice question that asks: under which combination of conditions (Marshall-Lerner satisfied or not, and economy below or at full employment) will a devaluation help the government achieve ALL four main macroeconomic objectives simultaneously?
The question is not asking whether a devaluation can improve the current account — that is only one objective. It asks whether the devaluation can also promote growth, reduce unemployment, and maintain price stability at the same time. The answer must identify the conditions under which there is no trade-off between the objectives.
Approach
- First, determine the condition for the current account to improve: the Marshall-Lerner condition must be satisfied. If it is not, the deficit worsens, so the balance of payments objective is not achieved.
- Second, determine the condition for the devaluation to raise real output without causing inflation: the economy must be below full employment. If at full employment, the increase in AD causes only inflation, conflicting with the price stability objective.
- Combine these two conditions to find the only scenario where all four objectives are simultaneously helped.
Step-by-Step Reasoning
Step 1: The Marshall-Lerner condition
A devaluation changes relative prices. Exports become cheaper in foreign currency, so the quantity of exports demanded rises. Imports become more expensive in domestic currency, so the quantity of imports demanded falls. However, the value of the current account is price × quantity for both exports and imports. The price effect (exports earn less per unit, imports cost more per unit) works against the volume effect (more exports sold, fewer imports bought).
- If |PEDx| + |PEDm| > 1 (Marshall-Lerner satisfied), the volume effect dominates, and the current account improves.
- If |PEDx| + |PEDm| < 1 (Marshall-Lerner not satisfied), the price effect dominates, and the current account worsens.
Since the question asks about reducing the deficit, the Marshall-Lerner condition must be satisfied. Options A and B (where the condition is not satisfied) can be eliminated because the current account would not improve.
Step 2: The state of the economy
A devaluation increases net exports (X - M), which is a component of AD. The impact on the other macroeconomic objectives depends on the position of the economy on the aggregate supply curve:
- Below full employment: The economy has spare capacity. The increase in AD shifts the AD curve rightwards along the relatively elastic portion of the SRAS curve. Real GDP rises, reducing unemployment. There is little or no increase in the price level. All three objectives (growth, lower unemployment, price stability) are helped.
- At full employment: The economy is operating at its maximum sustainable output. The SRAS curve is vertical (or nearly so). The increase in AD shifts the AD curve rightwards, but real output cannot rise. The entire increase in nominal demand is absorbed by higher prices. Inflation rises, conflicting with the price stability objective. Growth and unemployment are not improved.
Step 3: Combining the conditions
- Option A: Marshall-Lerner not satisfied, below full employment. The current account worsens, so the balance of payments objective is not achieved. Even though the other objectives might be helped (if the devaluation somehow raised AD despite the worsening current account — unlikely), the question asks about helping ALL four objectives. This fails.
- Option B: Marshall-Lerner not satisfied, full employment. The current account worsens AND inflation rises. Two objectives fail.
- Option C: Marshall-Lerner satisfied, below full employment. The current account improves, real GDP rises, unemployment falls, and inflation remains stable. All four objectives are helped. This is the correct answer.
- Option D: Marshall-Lerner satisfied, full employment. The current account improves, but the increase in AD causes demand-pull inflation. The price stability objective is harmed. Not all four objectives are helped.
Key Takeaways
- A devaluation is not a free lunch — its effectiveness depends on elasticities and the state of the economy.
- The Marshall-Lerner condition determines whether the current account improves or worsens.
- The state of the economy (below vs. at full employment) determines whether the increase in AD translates into real output growth or inflation.
- Policy trade-offs are central to macroeconomics: a policy that helps one objective may harm another unless conditions are favourable.
Common Mistakes
- Choosing option D: A student might correctly identify that the Marshall-Lerner condition must be satisfied but forget that at full employment, the devaluation causes inflation, conflicting with the price stability objective. The question asks about ALL four objectives, not just the current account.
- Choosing option A or B: A student might think that a devaluation always improves the current account, ignoring the Marshall-Lerner condition. This is a common error — devaluation can worsen the deficit if demand is inelastic.
- Confusing devaluation with depreciation: Devaluation is a policy decision under a managed exchange rate; depreciation is a market-driven fall in a floating exchange rate. The economic analysis is similar, but the question specifies a managed exchange rate.
Things to Be Careful About
- Read the question carefully: it asks about helping the government achieve its four main macroeconomic objectives. This is a holistic question — all four must be helped simultaneously.
- Remember that the Marshall-Lerner condition is about the sum of elasticities being greater than one, not each individually.
- The J-curve effect (short-run worsening before long-run improvement) is not directly tested here, but it is a related concept that could appear in other questions.
- Distinguish between demand-pull inflation (caused by excess AD) and cost-push inflation (caused by rising costs). A devaluation can also cause cost-push inflation by making imported raw materials more expensive, which is a separate channel not addressed in this question.
What would cause an individual's demand curve for an active money balance to move to the left?
Options
A an increase in the frequency of income payments
B an increase in the general price level
C an increase in the individual's income
D an increase in the rate of interest
Answer
The demand for active (transactions) money balances is held to finance everyday spending. An increase in the frequency of income payments means the individual receives income more often, so they need to hold a smaller average cash balance between paydays to cover the same volume of transactions. This reduces the demand for active money balances at any given interest rate, shifting the demand curve to the left.
Answer
A
A
Background Concept
The demand for money refers to the desire of individuals and firms to hold their wealth in the form of cash or bank deposits that can be readily used for transactions, rather than in less liquid forms such as bonds or shares. Keynes's liquidity preference theory identifies three motives for holding money:
- Transactions motive: money held to pay for everyday purchases of goods and services.
- Precautionary motive: money held for unexpected expenses.
- Speculative motive: money held to take advantage of future changes in interest rates or asset prices.
The demand for active money balances is primarily the transactions demand. It depends on the volume of transactions an individual needs to make and the frequency with which they receive income. The higher the frequency of income payments, the smaller the average cash balance needed between paydays, so the lower the demand for active balances.
Understanding the Question
The question asks what would cause an individual's demand curve for active money balances to shift to the left. A leftward shift means a decrease in the quantity of money demanded at any given interest rate. We need to identify which of the four options would reduce the demand for active balances.
Approach
We evaluate each option in turn, applying the theory of the transactions demand for money. The key relationship is that the demand for active balances is inversely related to the frequency of income payments and directly related to the price level and income. The rate of interest affects the speculative demand more than the transactions demand, but a higher interest rate increases the opportunity cost of holding money, which could reduce the demand for active balances as well.
Step-by-Step Reasoning
Option A: an increase in the frequency of income payments
If an individual is paid more frequently (e.g., weekly instead of monthly), they receive smaller amounts of income more often. The average cash balance they need to hold between paydays to cover their regular spending is smaller. For example, if someone spends $100 per week and is paid $400 monthly, they need to hold an average of $200 at any time. If they are paid $100 weekly, they need to hold an average of only $50. This reduces the demand for active money balances at any given interest rate, shifting the demand curve to the left. This is the correct answer.
Option B: an increase in the general price level
If prices rise, the individual needs more money to buy the same quantity of goods and services. This increases the transactions demand for money, shifting the demand curve to the right, not the left.
Option C: an increase in the individual's income
Higher income typically leads to higher spending, which increases the volume of transactions. This raises the demand for active money balances, shifting the demand curve to the right.
Option D: an increase in the rate of interest
A higher interest rate increases the opportunity cost of holding money (since money earns no interest, while bonds or savings accounts do). This could reduce the demand for money, including active balances, as individuals try to hold less cash and more interest-bearing assets. However, the effect on the transactions demand is relatively small compared to the speculative demand. More importantly, the question asks about the demand for active money balances, which is primarily the transactions demand. The interest rate has a stronger effect on the speculative demand. While a higher interest rate might reduce the demand for active balances slightly, the effect is not as direct or certain as the effect of the frequency of income payments. The most clear and direct cause of a leftward shift is option A.
Key Takeaways
- The demand for active (transactions) money balances depends on the volume of transactions and the frequency of income payments.
- An increase in the frequency of income payments reduces the average cash balance needed, shifting the demand curve to the left.
- Changes in the price level and income affect the demand for active balances in the same direction (positive relationship).
- The interest rate primarily affects the speculative demand for money, not the transactions demand.
Common Mistakes
- Confusing the demand for active balances with the demand for speculative balances. The question specifically asks about active balances, so the interest rate effect is less relevant.
- Thinking that a higher price level or higher income would reduce the demand for money, when in fact they increase it.
- Not understanding the inverse relationship between the frequency of income payments and the average cash balance held.
Things to Be Careful About
- Read the question carefully: it asks about the demand curve for active money balances, not the total demand for money.
- Distinguish between a movement along the demand curve (caused by a change in the interest rate) and a shift of the demand curve (caused by a change in a non-interest-rate determinant). The question asks for a shift to the left, so we need a change in a determinant other than the interest rate.
- Option D (increase in the rate of interest) would cause a movement along the demand curve, not a shift, for the transactions demand. It could cause a shift in the speculative demand, but that is not what the question asks about.
A government funds an increase in transfer payments to the unemployed by increasing the higher rate of income tax.
What is the most likely impact of this change?
Options
A government borrowing increases
B the incentive to work increases
C the marginal propensity to consume increases
D the quantity of imports increases
Answer
Transfer payments to the unemployed are a redistribution of income from higher-income taxpayers to lower-income unemployed households. Higher-income households have a lower marginal propensity to consume (MPC) because they save a larger proportion of any additional income. Unemployed households have a higher MPC because they spend a larger proportion of any additional income they receive. Therefore, the overall MPC in the economy increases, as income is transferred from those with a low MPC to those with a high MPC.
Answer
C
C
Background Concept
The marginal propensity to consume (MPC) is the proportion of an additional unit of disposable income that a household spends on consumption, rather than saving. It is a key determinant of the size of the multiplier: a higher MPC leads to a larger multiplier because more of each round of spending is passed on as consumption. The MPC varies systematically across income groups: higher-income households tend to have a lower MPC because they can afford to save a larger fraction of their income, while lower-income households tend to have a higher MPC because they need to spend most of their income on necessities.
Transfer payments are payments made by the government to individuals without any corresponding exchange of goods or services (e.g., unemployment benefits, state pensions). They are a form of redistribution, not a purchase of goods and services, so they do not directly affect aggregate demand in the same way as government spending on infrastructure. However, they do affect the disposable incomes of the recipients and the taxpayers who fund them.
Understanding the Question
The question describes a specific fiscal policy: the government increases transfer payments to the unemployed (a benefit) and simultaneously increases the higher rate of income tax (a tax on higher earners) to fund it. The policy is therefore revenue-neutral in terms of the government budget — the extra tax revenue exactly funds the extra transfer spending, so there is no net increase in government borrowing. The question asks for the most likely impact on the economy, and the four options are: government borrowing, the incentive to work, the marginal propensity to consume, and the quantity of imports.
Approach
We need to trace the effects of this redistribution on the behaviour of the two groups involved. The key insight is that the MPC differs between the groups. Higher-income taxpayers lose disposable income (they pay more tax), and because their MPC is low, they reduce their consumption by only a small amount. Unemployed households gain disposable income (they receive higher benefits), and because their MPC is high, they increase their consumption by a large amount. The net effect is an increase in total consumption in the economy, which means the overall MPC rises. This is the most direct and likely impact.
We can then check the other options: government borrowing is unchanged because the policy is funded by the tax increase; the incentive to work for the unemployed may actually decrease because benefits are higher (a potential disincentive), not increase; and the quantity of imports may increase as a secondary effect of higher consumption, but this is less direct and less certain than the change in MPC.
Step-by-Step Reasoning
-
Identify the policy: The government increases transfer payments to the unemployed and funds this by increasing the higher rate of income tax. This is a pure redistribution from higher-income to lower-income households, with no net change in the government's budget deficit.
-
Analyse the effect on the two groups:
- Higher-income taxpayers: They face a higher marginal tax rate on their income above a threshold. Their disposable income falls. Because they have a relatively low MPC (they save a larger proportion of their income), the reduction in their consumption is relatively small.
- Unemployed households: They receive higher transfer payments. Their disposable income rises. Because they have a relatively high MPC (they spend most of their income on necessities), the increase in their consumption is relatively large.
-
Determine the net effect on consumption: The increase in consumption by the unemployed outweighs the decrease in consumption by the higher-income taxpayers. Therefore, total consumption in the economy rises.
-
Link to the marginal propensity to consume: The MPC is an average for the whole economy. When income is redistributed from a group with a low MPC to a group with a high MPC, the overall MPC increases. This is because the weight of the high-MPC group in the economy's total disposable income has increased.
-
Evaluate the other options:
- Option A (government borrowing increases): This is incorrect because the policy is explicitly funded by a tax increase. There is no net increase in government spending relative to tax revenue, so borrowing does not change.
- Option B (the incentive to work increases): This is unlikely. Higher unemployment benefits reduce the opportunity cost of not working, which may decrease the incentive to seek work (a disincentive effect). The higher tax rate on higher incomes may also reduce the incentive for those workers to work more. So the overall effect on work incentive is ambiguous at best, and likely negative.
- Option D (the quantity of imports increases): This could happen as a secondary effect if the increase in consumption leads to higher demand for imported goods. However, this is less direct and less certain than the change in MPC. The question asks for the "most likely" impact, and the change in MPC is a more immediate and predictable consequence of the redistribution.
-
Conclusion: The most likely impact is that the marginal propensity to consume increases, because income is transferred from those with a low MPC to those with a high MPC.
Key Takeaways
- The marginal propensity to consume varies across income groups: higher-income households have a lower MPC, lower-income households have a higher MPC.
- Redistributive fiscal policy that transfers income from high-income to low-income households will increase the overall MPC in the economy.
- A higher MPC leads to a larger multiplier, meaning that any given change in autonomous spending will have a larger effect on national income.
- Transfer payments are not government spending on goods and services; they do not directly affect aggregate demand, but they affect it indirectly through changes in household consumption.
Common Mistakes
- Assuming government borrowing increases: Students may see "increase in transfer payments" and automatically think the government is spending more, forgetting that the question states it is funded by a tax increase. The policy is revenue-neutral.
- Confusing transfer payments with government spending on goods and services: Transfer payments do not directly add to aggregate demand; they only redistribute purchasing power. The effect on AD comes through the different MPCs of the groups involved.
- Thinking the incentive to work increases: Higher unemployment benefits reduce the financial incentive to find work, creating a potential disincentive. This is a common error.
- Overlooking the MPC difference: Some students may think that because the government budget is balanced, there is no net effect on the economy. This ignores the different spending propensities of the groups.
Things to Be Careful About
- Read the question carefully: the policy is funded by a tax increase, so borrowing does not change.
- Distinguish between the direct effect on the government budget and the indirect effect on consumption through redistribution.
- Remember that the MPC is a marginal concept: it applies to changes in income, not to the average level of consumption.
- The question asks for the "most likely" impact, so choose the option that is most direct and certain, not a possible secondary effect.
Which combination shows the most likely outcome if a government increases the level of direct taxation?
Options
A balance of payments deteriorates and inflation increases
B economic growth increases and balance of payments improves
C inflation decreases and unemployment increases
D unemployment decreases and balance of payments improves
Reasoning
An increase in direct taxation reduces households' disposable income. This reduces consumption, a component of aggregate demand (AD). A fall in AD reduces real output and employment, so unemployment rises. Lower AD also reduces demand-pull inflationary pressure, so inflation falls. The fall in AD reduces the demand for imports, improving the balance of payments. Therefore the most likely combination is inflation decreases and unemployment increases.
Answer
C
C
Background Concept
Direct taxation is a tax on income (personal income tax, corporation tax). It is a key instrument of fiscal policy. An increase in direct taxation reduces disposable income for households and post-tax profits for firms. This is a contractionary fiscal policy. The main channel through which it affects the macroeconomy is aggregate demand (AD = C + I + G + X - M). A fall in consumption (C) reduces AD. The multiplier effect amplifies the initial fall. A lower AD reduces real GDP (output), reduces demand-pull inflation, and reduces the demand for imports. The effect on employment is indirect: lower output means firms need fewer workers, so unemployment rises.
Understanding the Question
This is a multiple-choice question asking which combination of four macroeconomic outcomes is the most likely result of a government increasing direct taxation. The four options pair two outcomes each: balance of payments (BOP) and inflation; economic growth and BOP; inflation and unemployment; unemployment and BOP. The task is to trace the causal chain from the policy change to each of these variables and select the option where both outcomes are consistent with the theory.
Approach
- Identify the immediate effect of higher direct taxes: lower disposable income -> lower consumption.
- Trace the effect on AD: consumption is a component of AD, so AD falls.
- From a fall in AD, deduce the effects on:
- Real output and economic growth (negative)
- Employment (negative -> unemployment rises)
- Inflation (negative -> inflation falls)
- Imports (negative -> imports fall -> BOP improves)
- Check each option against these predictions. Only one option has both outcomes consistent with the theory.
Step-by-Step Reasoning
-
Step 1: Direct tax increase -> lower disposable income. Direct taxes are deducted from income before households can spend. A higher tax rate means less income left for consumption and saving.
-
Step 2: Lower consumption -> lower AD. Consumption is the largest component of AD. A fall in consumption shifts the AD curve leftwards.
-
Step 3: Lower AD -> lower real output and employment. With lower AD, firms produce less. To reduce output, they lay off workers or reduce hiring, so unemployment rises. This is a contractionary effect on the economy.
-
Step 4: Lower AD -> lower demand-pull inflation. With less spending pressure, firms are less able to raise prices. Inflation falls.
-
Step 5: Lower AD -> lower imports. A fall in domestic spending reduces the demand for imported goods and services. This improves the current account of the balance of payments (fewer imports, or a smaller deficit).
-
Step 6: Evaluate the options.
- A: BOP deteriorates and inflation increases. Both are wrong: BOP improves, inflation falls.
- B: Economic growth increases and BOP improves. Growth falls, not increases.
- C: Inflation decreases and unemployment increases. Both are correct.
- D: Unemployment decreases and BOP improves. Unemployment rises, not decreases.
Therefore C is the correct answer.
Key Takeaways
- Contractionary fiscal policy (higher taxes or lower government spending) reduces AD.
- A fall in AD reduces output, employment, inflation, and imports.
- The balance of payments improves because imports fall.
- Always trace the full chain of causation: policy -> component of AD -> AD -> each macroeconomic variable.
Common Mistakes
- Confusing direct and indirect taxation: indirect taxes affect the supply side and prices more directly; direct taxes affect disposable income and demand.
- Thinking higher taxes always reduce inflation but also reduce growth: that is correct, but the question pairs it with unemployment, which also rises.
- Forgetting the import channel: a fall in AD reduces imports, improving the BOP.
- Selecting an option where only one outcome is correct: both must be consistent.
Things to Be Careful About
- The question asks for the "most likely" outcome, not a guaranteed one. In reality, the size of the multiplier, the slope of AS, and other factors matter, but the standard textbook chain is clear.
- Distinguish between demand-pull and cost-push inflation: a tax increase reduces demand-pull inflation but could, if it raises costs (e.g. through higher indirect taxes), increase cost-push inflation. Direct taxes do not directly affect costs.
- The effect on unemployment is a derived effect from lower output, not a direct effect of the tax itself.
In an economy, the price elasticity of demand for imported raw materials is 0.3, and the price elasticity of demand for exports is also 0.3.
Following a depreciation of the economy's currency, what will the impact on inflation be?
Options
| change in inflation rate due to cost-push factors | change in inflation rate due to demand-pull factors | |
|---|---|---|
| A | decrease | decrease |
| B | decrease | increase |
| C | increase | decrease |
| D | increase | increase |
Reasoning
A depreciation makes imports more expensive, raising the cost of imported raw materials. With a price elasticity of demand for imports of 0.3 (inelastic), the quantity of imports does not fall much, so the total cost of imports rises, increasing cost-push inflation.
For exports, depreciation makes them cheaper in foreign currency, increasing export demand. However, with a price elasticity of demand for exports of 0.3 (inelastic), the quantity of exports increases only slightly. The rise in export revenue is small, and the higher import prices reduce real income and consumption, leading to a net decrease in aggregate demand. Hence demand-pull inflation decreases.
Answer
C
C
Background Concept
A currency depreciation reduces the value of the domestic currency relative to foreign currencies. This immediately affects prices: imports become more expensive in domestic currency terms (raising costs for firms that use imported inputs), while exports become cheaper for foreign buyers. Inflation can be influenced through two main channels:
- Cost-push inflation: Higher import prices increase production costs, which firms may pass on to consumers as higher prices.
- Demand-pull inflation: Cheaper exports boost foreign demand, increasing aggregate demand (AD). If the economy is near full capacity, this can push up prices.
The price elasticity of demand (PED) measures the responsiveness of quantity demanded to a change in price. A PED of 0.3 (inelastic) means that a 10% price change leads to only a 3% change in quantity demanded.
Understanding the Question
The question gives PED for imported raw materials (0.3) and for exports (0.3) and asks what happens to the inflation rate following a depreciation. The options pair changes in cost-push and demand-pull effects. The key is to determine whether each component increases or decreases. The mark scheme indicates answer C: cost-push inflation increases, demand-pull inflation decreases.
Approach
First, consider the cost-push channel: depreciation raises the domestic price of imports. With inelastic demand, the quantity of imports does not fall much, so the total cost of imported inputs rises, pushing up costs and prices. This clearly increases cost-push inflation.
Second, consider the demand-pull channel: depreciation makes exports cheaper, so quantity of exports rises. But with inelastic demand, the rise in quantity is proportionally smaller than the price fall, so export revenue in foreign currency may actually fall. More importantly, the higher import prices reduce the real income of domestic consumers (they can buy less with their income), which reduces consumption and investment. This negative real income effect can outweigh the small increase in export demand, leading to a net decrease in aggregate demand. Hence demand-pull inflation decreases.
Step-by-Step Reasoning
-
Cost-push effect: Depreciation -> import prices rise -> cost of imported raw materials increases -> firms' costs rise -> firms raise prices -> cost-push inflation increases. The inelastic demand (0.3) means the quantity of imports falls only slightly, so the total cost of imports increases substantially, reinforcing the inflationary pressure.
-
Demand-pull effect: Depreciation -> exports become cheaper in foreign currency -> foreign demand for exports increases -> quantity of exports rises. With inelastic demand (0.3), the percentage increase in quantity is less than the percentage decrease in price. Therefore, the total revenue from exports (in domestic currency) may actually decrease (since price falls more than quantity rises). Additionally, the higher import prices reduce the purchasing power of domestic households, leading to lower consumption and investment. This negative real income effect is significant because imports are a large share of spending. The net effect on aggregate demand is negative, so demand-pull inflation decreases.
-
Conclusion: Cost-push inflation increases, demand-pull inflation decreases. Therefore answer C.
Key Takeaways
- A depreciation is not automatically inflationary; it can have opposing effects on cost-push and demand-pull inflation.
- The price elasticity of demand for imports and exports determines the magnitude and sometimes the direction of the effects.
- Inelastic demand for imports amplifies cost-push inflation, while inelastic demand for exports can lead to a fall in aggregate demand through the real income effect.
Common Mistakes
- Assuming that a depreciation always increases inflation because of higher import prices, ignoring the demand-pull channel.
- Confusing the effect on the trade balance with the effect on inflation. A depreciation can improve the trade balance but still reduce demand-pull inflation if the real income effect dominates.
- Not considering the real income effect of higher import prices on consumption and aggregate demand.
Things to Be Careful About
- Distinguish clearly between cost-push and demand-pull inflation.
- Remember that the price elasticity of demand affects not only the quantity response but also the total revenue/spending effect.
- In an MCQ, work through each channel separately and then combine the results to pick the correct option.
A government is aiming to reduce the unemployment rate in its country from 10% to 5%.
What is a likely effect if this aim is achieved?
Options
A a decrease in interest rates
B a slow down in the rate of economic growth
C an increase in demand for exports
D an increase in inflation
Reasoning
A reduction in the unemployment rate from 10% to 5% represents a large fall in unemployment. According to the traditional Phillips curve, there is a short-run inverse relationship between unemployment and inflation: as unemployment falls, inflation tends to rise. This is because lower unemployment puts upward pressure on wages as firms compete for fewer available workers, and higher wage costs are passed on as higher prices. Therefore, the most likely effect of achieving this aim is an increase in inflation.
Answer
D
D
Background Concept
The Phillips curve illustrates the short-run trade-off between unemployment and inflation. The traditional (original) Phillips curve, based on empirical data for the UK, showed a stable inverse relationship: when unemployment was low, inflation was high, and vice versa. The reasoning is that as the economy approaches full employment, labour becomes scarce. Firms must bid up wages to attract workers, and these higher labour costs are passed on to consumers in the form of higher prices, generating demand-pull inflation. Conversely, high unemployment means workers have little bargaining power, wage growth is subdued, and inflation tends to be low.
Understanding the Question
The question states that a government aims to reduce the unemployment rate from 10% to 5% — a halving of the unemployment rate. It asks for the likely effect if this aim is achieved. The four options are: a decrease in interest rates, a slowdown in the rate of economic growth, an increase in demand for exports, and an increase in inflation. The question tests knowledge of the Phillips curve trade-off: a large fall in unemployment is likely to be accompanied by rising inflation, not by falling interest rates, slower growth, or higher export demand.
Approach
Identify the key macroeconomic relationship at work. The government's target is a large reduction in unemployment. The traditional Phillips curve predicts that such a reduction will be associated with higher inflation. Evaluate each option against this prediction. Option D is the only one consistent with the Phillips curve. The other options are either unrelated or contradictory.
Step-by-Step Reasoning
-
The Phillips curve relationship: The traditional Phillips curve shows an inverse relationship between the rate of unemployment and the rate of inflation. When unemployment is low, inflation tends to be high; when unemployment is high, inflation tends to be low.
-
Applying to the scenario: The government aims to reduce unemployment from 10% to 5%. This is a substantial fall. According to the Phillips curve, such a fall would be associated with a rise in inflation. The mechanism: lower unemployment means a tighter labour market. Firms find it harder to recruit and retain workers, so they raise wages. Higher wage costs are then passed on as higher prices, increasing the general price level (inflation).
-
Evaluating the options:
- Option A (a decrease in interest rates): Interest rates are a policy tool, not a direct consequence of lower unemployment. In fact, if inflation rises as a result of lower unemployment, the central bank might raise interest rates to cool the economy, not lower them. So A is unlikely.
- Option B (a slow down in the rate of economic growth): Lower unemployment is usually associated with faster economic growth, not slower growth. As more people are employed, output rises. So B is incorrect.
- Option C (an increase in demand for exports): Export demand is determined by factors such as foreign income, exchange rates, and relative prices. A fall in domestic unemployment does not directly increase export demand. If anything, rising inflation might make exports less competitive, reducing demand. So C is unlikely.
- Option D (an increase in inflation): As explained, this is the direct prediction of the Phillips curve. It is the most likely effect.
-
Conclusion: The correct answer is D.
Key Takeaways
- The traditional Phillips curve shows a short-run trade-off between unemployment and inflation.
- A large reduction in unemployment is likely to be accompanied by rising inflation.
- This relationship is a key macroeconomic policy conflict: governments cannot simultaneously achieve very low unemployment and very low inflation in the short run.
Common Mistakes
- Confusing the direction of the relationship: some students think lower unemployment leads to lower inflation, which is the opposite of the Phillips curve.
- Choosing option A (lower interest rates) because they associate lower unemployment with expansionary policy, but the question asks for the effect of achieving the aim, not the policy used to achieve it.
- Choosing option B (slower growth) because they think lower unemployment means the economy is overheating, but overheating is associated with faster growth, not slower.
Things to Be Careful About
- The Phillips curve is a short-run relationship; in the long run, the trade-off may disappear (expectations-augmented Phillips curve). The question refers to the traditional (short-run) relationship.
- The question asks for a likely effect, not a certain one. In the real world, other factors could intervene, but the Phillips curve provides the standard prediction.
- Read each option carefully: option C (increase in demand for exports) is not a direct consequence of lower unemployment; it is more related to exchange rate and foreign demand conditions.
Which statement is correct?
Options
A Economic development is necessary for economic growth.
B Economic growth and economic development are directly proportional.
C Economic growth enables economic development.
D Economic growth is always sustainable.
Answer
Economic growth is an increase in a country's real output (real GDP), while economic development is a broader concept encompassing improvements in living standards, health, education, and well-being. Growth can provide the resources (higher tax revenues, investment funds) that enable development, but it is neither necessary nor sufficient for development. For example, a country may experience growth without development if the benefits are concentrated among the rich, or development may occur without growth if aid and redistribution improve well-being. Therefore, the correct statement is that economic growth enables economic development.
Answer
C
C
Background Concept
Economic growth refers to an increase in the productive capacity of an economy, measured by the rate of change of real GDP or real GDP per capita. It is a quantitative concept. Economic development is a broader, qualitative concept that includes improvements in living standards, health, education, life expectancy, political freedoms, and environmental sustainability. The two are related but distinct. Growth can provide the resources (higher incomes, tax revenues, investment) that make development possible, but it does not guarantee it. Conversely, development can sometimes occur without growth (e.g., through better distribution of existing resources or foreign aid).
Understanding the Question
This multiple-choice question asks which of four statements about the relationship between economic growth and economic development is correct. The options present different causal and proportional claims. The correct answer is the one that accurately reflects the mainstream economic understanding: growth can enable development, but it is not necessary, not directly proportional, and not always sustainable.
Approach
Evaluate each statement against the definitions and known relationships:
- A: Is development necessary for growth? No, growth can occur without development.
- B: Are they directly proportional? No, the relationship is not one-to-one; growth can be high while development lags.
- C: Does growth enable development? Yes, growth provides resources that can be used to improve development outcomes.
- D: Is growth always sustainable? No, growth can be environmentally or socially unsustainable.
Step-by-Step Reasoning
- Option A: Economic development is necessary for economic growth. This is false. Many countries have experienced periods of rapid GDP growth (e.g., oil-rich nations) without corresponding improvements in health, education, or equality. Growth can occur even when development indicators are poor.
- Option B: Economic growth and economic development are directly proportional. This is false. The relationship is not linear or fixed. A 5% growth rate does not automatically produce a 5% improvement in development. The distribution of growth matters.
- Option C: Economic growth enables economic development. This is true. Growth increases the total resources available to a society. Higher incomes generate higher tax revenues, which can fund public services (health, education, infrastructure). Growth also attracts investment and creates employment, all of which can improve living standards. However, the link is not automatic — good governance and appropriate policies are needed to translate growth into development.
- Option D: Economic growth is always sustainable. This is false. Growth can deplete natural resources, damage the environment, and increase inequality, making it unsustainable in the long run. Sustainable growth requires careful management of resources and environmental protection.
Key Takeaways
- Economic growth and economic development are distinct concepts: growth is quantitative (increase in output), development is qualitative (improvement in well-being).
- Growth can enable development, but it is neither necessary nor sufficient.
- The relationship is not proportional; the quality and distribution of growth matter.
- Growth is not automatically sustainable; it can be environmentally or socially damaging.
Common Mistakes
- Confusing growth with development: assuming that if GDP rises, living standards must automatically improve.
- Thinking that development is a prerequisite for growth (Option A). In reality, growth can occur in very poor countries with low development indicators.
- Assuming a direct proportional relationship (Option B). The relationship is complex and depends on many factors.
- Believing that growth is always beneficial and sustainable (Option D). Growth can have negative side effects.
Things to Be Careful About
- Read each option carefully and evaluate it against the definitions, not against intuition.
- Remember that 'enables' (Option C) means 'makes possible' — it does not mean 'guarantees' or 'always leads to'. This is a key nuance.
- Distinguish between necessary condition (A) and sufficient condition (C). Growth is not necessary for development, but it can be a powerful enabler.
What is a trade-weighted exchange rate?
Options
A the price of one currency against a basket of other currencies
B the price of one currency in terms of another
C the price of one currency in terms of its real purchasing power
D the price of one currency being determined by state intervention
Reasoning
A trade-weighted exchange rate measures the value of one currency against a basket of other currencies, where the weight of each foreign currency reflects its importance in the home country's trade. This is distinct from a bilateral rate (option B), real purchasing power (option C), or a rate set by state intervention (option D).
Answer
A
A
Background Concept
A trade-weighted exchange rate (also called an effective exchange rate) is an index that shows the value of a domestic currency relative to a basket of foreign currencies, with each foreign currency assigned a weight corresponding to its share in the home country's trade (exports and imports). It gives a more comprehensive picture of a currency's overall external value than any bilateral rate alone, because most countries trade with multiple partners. Changes in the trade-weighted index better reflect the impact on the trade balance and on domestic inflation than changes in a single bilateral rate.
Understanding the Question
The question asks you to choose the correct definition of a trade-weighted exchange rate from four options. It tests your ability to differentiate between several related exchange rate concepts that are frequently confused: bilateral exchange rate, trade-weighted (effective) exchange rate, real exchange rate (based on purchasing power), and a fixed/managed exchange rate (determined by state intervention). The command word 'What is...' requires a precise factual definition, so only one statement matches exactly.
Approach
Start by recalling the exact definition: a trade-weighted exchange rate is an index of a currency's value against a weighted basket of other currencies. Then examine each option:
- Option A matches this definition directly.
- Option B describes a bilateral exchange rate.
- Option C describes a real exchange rate (adjusted for price levels).
- Option D describes a fixed or managed exchange rate system.
By elimination, A is correct.
Step-by-Step Reasoning
-
Understand what a trade-weighted exchange rate is: It measures the value of one currency against a basket of several other currencies, where each currency's weight represents its relative importance in trade (usually the share of that country in the home country's exports and imports). It is expressed as an index number relative to a base year.
-
Evaluate each option:
- Option A: 'the price of one currency against a basket of other currencies' – this captures the essence: a basket (multiple currencies) and a price (the exchange rate). This is correct.
- Option B: 'the price of one currency in terms of another' – this is a bilateral exchange rate (e.g., USD/EUR). It involves only two currencies, not a basket. Incorrect.
- Option C: 'the price of one currency in terms of its real purchasing power' – this is a real exchange rate, which adjusts the nominal rate for differences in price levels between countries to measure the relative purchasing power. The trade-weighted rate does not directly adjust for purchasing power; it is a nominal index weighted by trade shares. Incorrect.
- Option D: 'the price of one currency being determined by state intervention' – this describes a fixed or managed exchange rate regime, where the government or central bank sets or influences the rate. The trade-weighted rate is simply a measure; it does not describe how the rate is determined. Incorrect.
-
Conclude that only Option A is correct.
Key Takeaways
- A trade-weighted exchange rate is an index of a currency against a basket of currencies, weighted by trade shares.
- It is broader than a bilateral exchange rate, which only compares two currencies.
- It is distinct from the real exchange rate, which adjusts for price levels, and from the system of rate determination (fixed vs floating).
- This concept is important because changes in a trade-weighted index better capture the overall competitiveness of a country's exports and the impact on its trade balance than bilateral rates do.
Common Mistakes
- Confusing a trade-weighted rate with a bilateral rate: many students pick option B because they think 'exchange rate' generally means 'price of one currency in terms of another', but the question specifically asks for the trade-weighted version.
- Confusing 'trade-weighted' with 'real': option C might be attractive because both involve broader measures, but the real exchange rate is about purchasing power, not trade weights.
- Choosing option D thinking that 'trade-weighted' involves government intervention because trade policy is sometimes associated with government action – but intervention refers to the exchange rate regime, not the measurement.
Things to Be Careful About
- Read the wording carefully: 'against a basket of other currencies' is the key phrase that distinguishes option A.
- Remember that a trade-weighted exchange rate is a nominal index; it does not adjust for inflation or purchasing power.
- The index uses trade weights, not GDP weights or any other measure.
- This is a definitional question – do not overthink or add unnecessary elaboration; the simple definition suffices.
The United Nations gives aid to a developing country so it can purchase vaccinations manufactured in India.
How is this aid characterised?
Options
| characteristic 1 | characteristic 2 | |
|---|---|---|
| A | bilateral | tied |
| B | bilateral | untied |
| C | multilateral | tied |
| D | multilateral | untied |
Reasoning
- Aid from the United Nations is provided through an international organisation, making it multilateral (not bilateral, which would be direct government-to-government).
- The aid is tied to purchasing vaccines manufactured in India, meaning the recipient must spend the aid on a specified source. This makes it tied aid (not untied, which would allow free spending).
- Therefore the correct combination is multilateral and tied.
Answer
C
C
Background Concept
Aid (official development assistance) is classified by its channel and its conditionality. Bilateral aid flows directly from one government to another. Multilateral aid is channelled through an international organisation such as the United Nations or the World Bank, which then allocates it. Tied aid requires the recipient to spend the funds on goods or services from the donor country (or a specified source). Untied aid carries no such restriction; the recipient can use it to purchase from any country, often making it more efficient.
Understanding the Question
The question presents a short scenario: the United Nations gives aid to a developing country so it can purchase vaccines manufactured in India. We are asked to characterise this aid using two dimensions: bilateral vs multilateral, and tied vs untied. The correct answer must match both characteristics.
Approach
Step 1: Identify the donor. The United Nations is an international organisation, so the aid is multilateral. Step 2: Check the condition: the aid is specifically for purchasing vaccines from India — a restricted source. That makes it tied aid. Combine to find the option that states 'multilateral' and 'tied'.
Step-by-Step Reasoning
- Bilateral or multilateral? The agency giving the aid is the United Nations, not a single government. By definition, aid channelled through the UN is classified as multilateral. Bilateral aid would require the government of one country directly giving to another, e.g., the US government giving aid to the Kenyan government. Here the intermediary is an international body, so it is multilateral.
- Tied or untied? The phrase 'so it can purchase vaccinations manufactured in India' implies a restriction: the funds must be spent on vaccines produced in India. Even though the donor is the UN, the aid is tied to a specific geographical source. In development economics, tied aid is aid that the recipient must use to buy from a designated country or set of countries. Untied aid would allow the recipient to purchase from any supplier (e.g., Indian, European, or domestic). Since the condition is explicitly stated, the aid is tied.
- Matching against options: A says bilateral/tied, B says bilateral/untied, C says multilateral/tied, D says multilateral/untied. Only option C contains the correct pair.
Key Takeaways
- Aid classification is a standard topic: bilateral vs multilateral refers to channel; tied vs untied refers to conditionality.
- In multiple-choice questions on aid, carefully attribute the donor to its channel and look for words like 'must purchase from' or 'tied to' that signal tied aid.
- Understanding these distinctions helps evaluate the effectiveness and motives behind aid.
Common Mistakes
- Confusing 'multilateral' as aid from multiple donors. Multilateral means through an international organisation; the funding may come from many countries but the key is the intermediary.
- Assuming that aid from the UN is automatically untied. The question clearly adds a purchasing restriction, which overrides that assumption. Always read the exact phrasing.
- Selecting an option that only matches one characteristic. The question requires both to be correct.
Things to Be Careful About
- The phrase 'manufactured in India' might tempt a student to think of bilateral aid because India is a country, but the donor is the UN, not India. The donor determines bilateral vs multilateral.
- Tied aid is often criticised for being less effective; untied aid is generally preferred by recipients. However, this question only tests identification, not evaluation.
- Remember that tied aid can be either bilateral or multilateral. The two dimensions are independent.
What is a protectionist policy a government may use to reduce the deficit on the balance of payments of the current account?
Options
A revaluation of the exchange rate
B increase in the rate of income tax
C increase in the rate of interest
D introduction of import quotas
Reasoning
A protectionist policy is a government measure that restricts international trade to protect domestic industries. Import quotas directly limit the quantity of imports, reducing the value of imports and thus improving the current account balance. Revaluation (A) makes exports more expensive and imports cheaper, worsening the deficit. An increase in income tax (B) reduces disposable income and may reduce imports, but it is a fiscal policy, not a protectionist policy. An increase in interest rates (C) attracts capital inflows but does not directly restrict trade; it is a monetary policy.
Answer
D
D
Background Concept
Protectionist policies are trade barriers imposed by governments to shield domestic industries from foreign competition. Common forms include tariffs (taxes on imports), quotas (quantitative limits on imports), subsidies to domestic producers, and non-tariff barriers. The balance of payments current account records trade in goods and services, income flows, and transfers. A deficit means imports exceed exports. Protectionist policies can reduce imports, thereby reducing the deficit, but they may also provoke retaliation and reduce overall welfare.
Understanding the Question
The question asks which of the four options is a protectionist policy that a government could use to reduce a current account deficit. It tests the ability to distinguish protectionist measures from other macroeconomic policies (fiscal, monetary, exchange rate). The correct answer is import quotas (D). The other options are not protectionist: revaluation is an exchange rate policy that would actually worsen the deficit; income tax increase is a fiscal policy that might reduce demand and imports but is not a trade barrier; interest rate increase is a monetary policy that affects capital flows and aggregate demand but is not a direct trade restriction.
Approach
Recall the definition of protectionist policy: any government action that restricts international trade. Then evaluate each option: A – revaluation is the opposite of protection (it makes imports cheaper), B – income tax is a domestic fiscal tool, C – interest rate is a monetary tool, D – import quotas are a classic protectionist measure. Select D.
Step-by-Step Reasoning
- Option A: Revaluation of the exchange rate means the domestic currency appreciates. This makes exports more expensive and imports cheaper, so it would likely increase the current account deficit, not reduce it. Moreover, it is an exchange rate policy, not a protectionist trade barrier.
- Option B: An increase in the rate of income tax reduces disposable income, which may reduce consumption of both domestic and imported goods. While it could reduce imports, it is a fiscal policy aimed at managing aggregate demand, not a direct restriction on trade. It is not classified as protectionist.
- Option C: An increase in the rate of interest is a monetary policy tool. Higher interest rates attract foreign capital, which may improve the financial account but does not directly restrict imports. It could reduce aggregate demand and thus imports indirectly, but again it is not a protectionist trade barrier.
- Option D: Import quotas set a physical limit on the quantity of a good that can be imported. This directly reduces the volume of imports, thereby reducing the import expenditure and improving the current account balance. This is a classic protectionist policy.
Therefore, D is the correct answer.
Key Takeaways
- Protectionist policies are trade barriers such as tariffs, quotas, subsidies, and non-tariff barriers.
- They are distinct from fiscal, monetary, and exchange rate policies, even though those may also affect the balance of payments.
- Import quotas directly reduce imports and can improve a current account deficit, but they may lead to higher prices for consumers and retaliation from trading partners.
Common Mistakes
- Confusing revaluation with protection: revaluation is an exchange rate policy that makes imports cheaper, so it is not protectionist.
- Thinking that any policy that reduces imports is protectionist: fiscal and monetary policies can reduce imports indirectly but are not considered protectionist because they do not directly restrict trade.
- Not knowing the definition of protectionist policy.
Things to Be Careful About
- The question specifically asks for a protectionist policy. Ensure you know the standard classification of policies.
- Revaluation is the opposite of protection; devaluation would be a protectionist-like effect but is not a trade barrier.
- Import quotas are a direct quantitative restriction.
The diagram shows a Lorenz curve of the distribution of income of households for a country.
Which curve shows the most equal distribution of income of households?
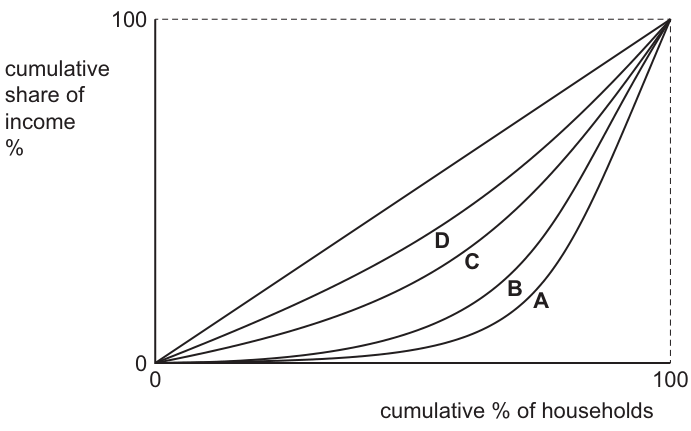
Options
A curve A on Fig. 28.1
B curve B on Fig. 28.1
C curve C on Fig. 28.1
D curve D on Fig. 28.1
Reasoning
A Lorenz curve that is closer to the diagonal line of perfect equality represents a more equal distribution of income. Curve D is the nearest to the diagonal line, indicating the most equal distribution among the four curves shown.
Answer
D
D
Background Concept
A Lorenz curve is a graphical tool used to represent the distribution of income or wealth within a population. Developed by Max O. Lorenz, it plots the cumulative percentage of households (or individuals) on the horizontal axis against the cumulative percentage of total income (or wealth) on the vertical axis. The line of perfect equality is a 45-degree diagonal line running from the origin (0,0) to the top-right corner (100,100). This diagonal represents a hypothetical situation where each cumulative percentage of households earns exactly that same cumulative percentage of income—for example, the bottom 20% of households earn 20% of total income, the bottom 50% earn 50%, and so on. In reality, income distributions are unequal, so the Lorenz curve bows away from this diagonal line. The further the Lorenz curve is from the diagonal, the more unequal the distribution, because a smaller proportion of households is earning a larger proportion of the income. The Gini coefficient, a numerical measure of inequality, is derived from the Lorenz curve by calculating the ratio of the area between the line of perfect equality and the Lorenz curve to the total area under the line of perfect equality.
Understanding the Question
The question presents a diagram showing four Lorenz curves labelled A, B, C, and D, alongside the diagonal line of perfect equality. The task is to identify which of these four curves represents the most equal distribution of household income. This is a 1-mark multiple-choice question that tests the candidate's ability to interpret the geometric meaning of a Lorenz curve and its relationship to the line of perfect equality.
Approach
To answer this question, recall that the diagonal line represents perfect equality. Any Lorenz curve that bows away from this diagonal indicates some degree of inequality. The key principle is that the closer a Lorenz curve is to the diagonal line, the more equal the income distribution it represents. Conversely, the further the curve bows away from the diagonal, the more unequal the distribution. Therefore, the strategy is simply to identify which of the four curves (A, B, C, or D) lies closest to the 45-degree diagonal line.
Step-by-Step Reasoning
- Identify the reference line: The straight diagonal line from (0,0) to (100,100) is the line of perfect equality. This is the benchmark against which all Lorenz curves are compared.
- Understand the meaning of deviation: When a Lorenz curve bows away from the diagonal, it shows that the cumulative share of income is less than the cumulative share of households at every point between 0 and 100. This indicates that lower-income households are earning a smaller proportion of total income than they would under perfect equality. The greater the bow (the further the curve is from the diagonal), the greater the inequality.
- Compare the four curves:
- Curve A bows the furthest away from the diagonal, indicating the most unequal distribution.
- Curve B is closer to the diagonal than A, but still significantly bowed.
- Curve C is closer still to the diagonal.
- Curve D is the closest to the diagonal line of perfect equality.
- Reach the conclusion: Since Curve D deviates least from the line of perfect equality, it represents the most equal distribution of income among the four options.
Key Takeaways
- The Lorenz curve is a visual representation of income inequality.
- The diagonal line (45-degree line) represents perfect equality.
- The closer a Lorenz curve is to the diagonal, the more equal the income distribution.
- The further a Lorenz curve bows away from the diagonal, the more unequal the distribution.
- The Gini coefficient quantifies this inequality, ranging from 0 (perfect equality) to 1 (or 100) (perfect inequality).
Common Mistakes
- Confusing the direction of inequality: Some students mistakenly believe that the curve furthest from the origin or the most pronounced curve represents the most equality, when in fact it represents the most inequality.
- Misreading the axes: Confusing which axis represents households and which represents income can lead to incorrect interpretation of the curve's position.
- Selecting Curve A: Because Curve A is the most visually distinct or furthest from the diagonal, students who misread the question might select it, thinking it represents the 'most' of something, without realising that 'most equal' means closest to the diagonal.
Things to Be Careful About
- Always locate the line of perfect equality (the diagonal) first before comparing the curves.
- Remember that all Lorenz curves for unequal distributions will lie below the diagonal line.
- The question asks for the 'most equal' distribution, which corresponds to the smallest deviation from perfect equality, not the largest.
- Ensure you are comparing the curves' proximity to the diagonal, not their proximity to the axes or to each other.
An economy has a large surplus on the current account of its balance of payments. It revalues its currency. The current account of the balance of payments becomes a greater surplus in the short run. In the long run the surplus becomes smaller and eventually becomes a deficit.
What is the sum of the price elasticities of imports and exports in the short run and in the long run?
Options
| short run | long run | |
|---|---|---|
| A | greater than 1.0 | greater than 1.0 |
| B | greater than 1.0 | less than 1.0 |
| C | less than 1.0 | greater than 1.0 |
| D | less than 1.0 | less than 1.0 |
Reasoning
The Marshall-Lerner condition states that a currency revaluation (an appreciation) will improve the current account balance if the sum of the price elasticities of demand for imports and exports (PEDx + PEDm) is greater than 1. It will worsen the balance if the sum is less than 1.
The J-curve effect describes the time path: in the short run, the trade balance may worsen (or, in this case, the surplus becomes larger) because contracts are fixed and volumes are slow to adjust. This implies that in the short run, the sum of elasticities is less than 1 (the condition for a perverse effect).
In the long run, volumes adjust and the surplus becomes smaller and eventually turns into a deficit. This is the normal effect of a revaluation, which occurs when the sum of elasticities is greater than 1.
Therefore, the sum is less than 1 in the short run and greater than 1 in the long run.
Answer
C
C
Background Concept
The Marshall-Lerner condition is a key concept in international economics. It states that a depreciation (or devaluation) of a currency will improve a country's current account balance (reduce a deficit or increase a surplus) if the sum of the absolute values of the price elasticities of demand for exports and imports is greater than 1. Conversely, if the sum is less than 1, a depreciation will worsen the current account. The logic is that a weaker currency makes exports cheaper and imports more expensive. For the trade balance to improve, the increase in export volume and the decrease in import volume must outweigh the adverse change in the terms of trade (exports earn less per unit, imports cost more per unit). This happens when demand is elastic.
The J-curve effect describes the time path of the trade balance following a currency change. In the very short run, trade contracts are already in place, and the volume of trade cannot adjust quickly. Therefore, the immediate effect is a worsening of the trade balance (for a depreciation) because the price effect dominates. Over time, as contracts are renegotiated and consumers and producers adjust their behaviour, the volume effect kicks in, and the trade balance improves. The path of the trade balance over time looks like a 'J'.
This question applies these concepts to a revaluation (an increase in the currency's value under a fixed exchange rate system, or an appreciation under a floating system). The logic is symmetric: a revaluation makes exports more expensive and imports cheaper. The Marshall-Lerner condition for a revaluation to worsen the current account (reduce a surplus or create a deficit) is the same: the sum of elasticities must be greater than 1. If the sum is less than 1, a revaluation will paradoxically improve the current account (increase the surplus). The J-curve effect also applies in reverse: in the short run, the perverse effect (the surplus getting larger) occurs because volumes are sticky, and the price effect dominates.
Understanding the Question
The question describes a specific scenario:
- An economy has a large current account surplus.
- It revalues its currency.
- In the short run, the surplus becomes even larger (a perverse effect).
- In the long run, the surplus becomes smaller and eventually turns into a deficit (the expected effect).
The question asks for the sum of the price elasticities of imports and exports (PEDx + PEDm) in the short run and in the long run. The options are combinations of 'greater than 1.0' and 'less than 1.0'.
Approach
- Recall the Marshall-Lerner condition: A revaluation will worsen the current account (reduce a surplus) if PEDx + PEDm > 1. It will improve the current account (increase a surplus) if PEDx + PEDm < 1.
- Analyse the short-run outcome: The surplus becomes larger. This is a perverse, opposite-to-expected outcome. Therefore, the Marshall-Lerner condition for a perverse effect must hold: PEDx + PEDm < 1.
- Analyse the long-run outcome: The surplus becomes smaller and eventually turns into a deficit. This is the expected outcome of a revaluation. Therefore, the Marshall-Lerner condition for the normal effect must hold: PEDx + PEDm > 1.
- Match to the options: The short run is 'less than 1.0' and the long run is 'greater than 1.0'. This corresponds to option C.
Step-by-Step Reasoning
- Identify the event: The currency is revalued. This means its value increases. For the rest of the world, the country's exports become more expensive, and the country's imports become cheaper.
- Identify the short-run outcome: The current account surplus becomes larger. This is the opposite of what standard theory predicts for a revaluation. The standard prediction is that a revaluation should reduce a surplus (or create a deficit) because exports fall and imports rise. The fact that the surplus increases means the price effect (exports earning more per unit in domestic currency, imports costing less per unit) is dominating the volume effect (export and import quantities not yet adjusting). This is the J-curve effect in reverse.
- Apply the Marshall-Lerner condition to the short run: For the surplus to increase (a perverse outcome), the sum of the price elasticities must be less than 1. This is because the volume response is too weak to overcome the price change. So, short run: PEDx + PEDm < 1.
- Identify the long-run outcome: The surplus becomes smaller and eventually turns into a deficit. This is the standard, expected outcome of a revaluation. The volume effect has now had time to materialise.
- Apply the Marshall-Lerner condition to the long run: For the surplus to decrease (the normal outcome), the sum of the price elasticities must be greater than 1. The volume response is now strong enough to dominate the price effect. So, long run: PEDx + PEDm > 1.
- Select the correct option: The combination of 'less than 1.0' in the short run and 'greater than 1.0' in the long run is option C.
Key Takeaways
- The Marshall-Lerner condition is the key to understanding whether a currency change will have its expected effect on the trade balance.
- The J-curve effect explains why the short-run effect can be the opposite of the long-run effect, due to sticky volumes.
- The logic is symmetric for depreciation and revaluation.
- The sum of elasticities is the critical variable.
Common Mistakes
- Confusing the condition for depreciation vs. revaluation: The condition is the same. A sum > 1 leads to the 'normal' effect (deficit falls on depreciation, surplus falls on revaluation). A sum < 1 leads to the 'perverse' effect.
- Ignoring the J-curve: A student might only apply the long-run logic and incorrectly choose option A (both > 1). The question explicitly describes the short-run perverse effect, which must be explained by a sum < 1.
- Reversing the logic: A student might think that because the surplus gets larger in the short run, the elasticities must be high (to cause a big change), but the direction of the change is the key. A larger surplus from a revaluation is a perverse outcome, implying low elasticities.
Things to Be Careful About
- The question asks for the sum of the price elasticities of imports and exports. This is the exact variable in the Marshall-Lerner condition.
- The question describes a revaluation, not a depreciation. The logic is symmetric, but it's easy to get confused. Always think: what is the expected effect of this change? The expected effect of a revaluation is a smaller surplus (or a deficit). The short-run effect described is the opposite, so it's the perverse case.
- The J-curve is a time-path concept. The short run is when volumes are sticky; the long run is when they have adjusted.
What is not a characteristic of an emerging economy?
Options
A an agricultural sector with a growing % of GDP
B high birth rates
C high potential for growth
D increasing access to education
Answer
An emerging economy is characterised by rapid industrialisation, falling share of agriculture in GDP, falling birth rates, increasing urbanisation, and rising access to education and technology. Option A describes a developing economy where agriculture still dominates and its share of GDP is growing, not an emerging economy. Therefore, the correct answer is A.
A
Background Concept
Emerging economies (also called emerging markets) are countries that are in the process of rapid industrialisation and economic growth, moving from a low-income, agriculture-based economy to a more industrialised, higher-income one. They typically share several common characteristics:
- Rapid industrialisation and a growing manufacturing and services sector
- Falling share of agriculture in GDP as the economy develops
- Increasing urbanisation as people move from rural to urban areas
- Falling birth rates and death rates as healthcare and education improve
- Rising access to education, technology, and infrastructure
- High potential for further economic growth due to favourable demographics and structural reforms
- Increasing integration into global trade and financial markets
In contrast, developing (low-income) economies often still have a large agricultural sector, high birth rates, low levels of education and healthcare, and limited industrialisation.
Understanding the Question
The question asks: "What is not a characteristic of an emerging economy?" This is a negative question — we need to identify the option that does NOT fit the typical profile of an emerging economy. The four options are:
- A: an agricultural sector with a growing % of GDP
- B: high birth rates
- C: high potential for growth
- D: increasing access to education
We must evaluate each option against the known characteristics of emerging economies.
Approach
- Recall the defining features of an emerging economy.
- For each option, decide whether it is a typical characteristic or not.
- Identify the one that is NOT a characteristic — that is the correct answer.
Step-by-Step Reasoning
Option A: an agricultural sector with a growing % of GDP
- In an emerging economy, the share of agriculture in GDP typically falls as the economy industrialises and the manufacturing and services sectors grow. A growing agricultural share of GDP is a sign of a low-income, pre-industrial economy, not an emerging one. Therefore, this is not a characteristic of an emerging economy.
Option B: high birth rates
- Emerging economies often have falling birth rates as urbanisation, education (especially for women), and access to contraception increase. However, many emerging economies still have relatively high birth rates compared to developed countries, especially in the early stages of development. But the question asks for what is not a characteristic — and high birth rates are more typical of developing economies than emerging ones. However, the key point is that option A is clearly wrong, so we can eliminate B.
Option C: high potential for growth
- This is a defining feature of emerging economies. They have favourable demographics, low labour costs, and room for catch-up growth, giving them high potential for rapid economic expansion. This is a characteristic.
Option D: increasing access to education
- Emerging economies typically invest heavily in education to build human capital, and access to education rises as the economy develops. This is a characteristic.
Therefore, the only option that is not a characteristic of an emerging economy is A.
Key Takeaways
- Emerging economies are in transition from low-income to middle-income status, with rapid industrialisation, falling agricultural share, falling birth rates, and rising education and technology.
- A growing agricultural share of GDP is a sign of a developing, not emerging, economy.
- Negative questions require careful elimination — identify what does NOT fit.
Common Mistakes
- Confusing emerging economies with developing economies. They are not the same — emerging economies are a subset of developing economies that are experiencing rapid growth and industrialisation.
- Assuming that high birth rates are a characteristic of emerging economies. While birth rates may still be relatively high, they are typically falling, and the key distinguishing feature is the falling agricultural share.
- Misreading the negative wording and selecting a characteristic that IS true.
Things to Be Careful About
- Read negative questions carefully — the word "not" changes everything.
- Know the specific characteristics of each category: developed, emerging, and developing economies.
- In multiple-choice questions, eliminate clearly wrong options first.
Your score so far
Answer a question to start scoring
Your marks add up here as you work through the paper.