Economics 9708/42 — May/June 2025
Cambridge A-Level · A Level Data Response and Essays · worked solutions for every part, with the mark scheme
Topics Economic Growth and Sustainability · Externalities, Social Costs and Benefits · Efficiency and Market Failure · Market Structures · Government Policies to Correct Market Failure · Demand for and Supply of Labour · +6 more
Global carbon emissions
A key message of the 2021 World Climate Summit was that the use of coal must be phased out for the good of the planet.
Content removed due to copyright restrictions.
Instead, a mixture of renewable energies will be required to achieve zero-carbon
Sources: The Sunday Times, 17 October 2021
The Times, 26 October and 24 November 2021
nsenergybusiness.com, 4 November 2021
Define economic sustainability and give one example from the information of a change that can be used to illustrate it.
Answer
Economic sustainability is current economic activity that does not compromise the ability of future generations to meet their own needs.
An example from the information is the shift from coal to renewable energy sources (solar, wind, hydro-electric) to reduce environmental damage and preserve resources for future use.
Economic sustainability is current economic activity that does not compromise the ability of future generations to meet their own needs; an example is the shift from coal to renewable energy sources to preserve resources and reduce environmental damage.
Background Concept
Economic sustainability is a core dimension of sustainable development, which requires that current economic activity meets the needs of the present without reducing the ability of future generations to meet their own needs. This typically involves using renewable resources at a rate that allows them to replenish, avoiding depletion of finite resources, and minimising irreversible environmental damage that would harm long-run economic welfare.
Understanding the Question
This 2-mark part asks for two distinct elements: a precise, textbook definition of economic sustainability, and one concrete example of a change that illustrates this concept, taken directly from the provided source material about global carbon emissions and energy policy. The command word "Define" means only a clear, accurate definition is required for the first mark, with no extra analysis or evaluation. The second mark requires the example to be explicitly linked to the definition of sustainability, and to come from the provided extract.
Approach
First, state the standard definition of economic sustainability used in Cambridge International A Level Economics, which centres on intergenerational equity. Then, scan the source extract for any mention of changes that reduce environmental damage or preserve resources for future use — the extract explicitly mentions a shift from coal to renewable energy sources as the alternative to coal use, which directly fits the definition.
Step-by-Step Reasoning
- The definition of economic sustainability focuses on intergenerational equity: current economic activity should not reduce the welfare, options or resource access of future generations. This usually refers to avoiding overuse of finite non-renewable resources and avoiding irreversible environmental damage that would reduce future living standards.
- The extract states that a mixture of renewable energies will be required to replace coal to achieve zero-carbon goals. Shifting to renewables preserves finite coal reserves for future use and reduces greenhouse gas emissions that cause long-term climate damage, which directly illustrates the concept of economic sustainability.
Key Takeaways
- Economic sustainability is defined by its focus on intergenerational equity, not just short-run environmental protection.
- Examples of economic sustainability must explicitly link the change to the preservation of resources or welfare for future generations, and must be taken from the provided extract for this question.
Common Mistakes
- Giving a vague definition such as "protecting the environment" without mentioning future generations, which fails to meet the standard definition and loses the first mark.
- Giving an example that is not from the extract, such as recycling or using public transport, which loses the second mark as the question explicitly requires an example from the provided information.
- Listing multiple examples when only one is required, which wastes time but does not lose marks.
Things to Be Careful About
- Ensure the definition explicitly references future generations, as this is the core of the economic sustainability concept in the syllabus.
- The example must be directly taken from the extract: the only relevant example provided is the shift from coal to renewable energy sources, so do not invent unrelated examples.
Use the information to comment on the possible effects on the economies of the countries that refused to sign the carbon policy agreement.
Answer
Advantages for the non-signatory countries:
- Coal is a cheap power source, which keeps production costs low for firms, supporting higher output, GDP and economic growth.
- Coal is a reliable, storable energy source, which ensures continuity of production and avoids disruption to economic activity.
Disadvantages for the non-signatory countries:
- Coal is a finite non-renewable resource, so continued use depletes reserves and creates high future costs when switching to alternative energy sources.
- Burning coal generates negative externalities (e.g. greenhouse gas emissions, poor air quality) which impose unaccounted social costs on the economy, including healthcare costs and climate change adaptation costs.
Non-signatory countries gain short-run economic benefits from cheap, reliable coal power (supporting growth and production continuity) but face long-run costs from finite resource depletion and negative externalities that impose social welfare losses.
Background Concept
When evaluating the economic impact of an international policy such as a carbon agreement, it is important to consider both the benefits and costs to the economies of countries that choose not to participate. The continued use of fossil fuels like coal has both economic advantages (related to production costs, energy reliability and growth) and economic disadvantages (related to resource depletion and unaccounted external costs).
Understanding the Question
This 4-mark part asks you to comment on the possible effects on the economies of countries that refused to sign the carbon policy agreement. The extract identifies these countries as some of the top global producers of coal. The command word "comment" requires you to present a balanced set of relevant points, with both positive and negative effects, supported by evidence from the extract where possible. A one-sided answer would gain a maximum of 2 marks.
Approach
First, identify the advantages of continued coal use for these economies, linking each to an explicit economic outcome such as GDP growth or production continuity. Then, identify the disadvantages, linking each to long-run economic costs or welfare losses. Use any relevant evidence from the extract to support your points, such as the fact that these are top coal producers.
Step-by-Step Reasoning
- Advantages of continued coal use:
- Coal is a relatively cheap source of power compared to many renewables, which keeps firms' production costs low. Lower costs support higher output, higher GDP and economic growth, which is a key macroeconomic objective for most countries.
- Unlike intermittent renewable sources such as wind or solar, coal is a reliable, storable energy source. This ensures continuity of production, avoiding disruptions to economic activity that would reduce output, employment and tax revenues for the government.
- Disadvantages of continued coal use:
- Coal is a finite non-renewable resource. Continued use depletes global reserves, meaning future generations will face much higher costs when switching to alternative energy sources, and current economies may face supply shocks and price spikes as reserves run out.
- Burning coal generates negative externalities such as greenhouse gas emissions, air pollution and contribution to climate change. These costs are not borne by the producer, but are imposed on third parties including the general population, other countries and future generations. They include healthcare costs from respiratory illness, costs of climate change adaptation (e.g. flood defences), and lost productivity, which reduce overall economic welfare.
Key Takeaways
- Evaluating policy effects requires considering both short-run benefits and long-run costs, as policies that boost growth in the short run may create large costs in the future.
- Negative externalities are a key market failure that imposes unaccounted-for costs on the economy, even if they are not borne by the producer or consumer of the good.
Common Mistakes
- Presenting only one side (either only advantages or only disadvantages), which would limit the mark to a maximum of 2, as a balanced answer is required for full marks.
- Making points that are not linked to economic effects, such as only mentioning environmental damage without linking it to economic costs like healthcare spending or lost productivity.
- Quoting figures from the extract without explaining their economic relevance, e.g. stating "these countries produce a lot of coal" without linking it to their economic reliance on coal.
Things to Be Careful About
- Ensure each point is explicitly linked to an economic outcome (GDP, production costs, welfare, etc.) rather than just stating a fact about coal.
- Use the extract's evidence that the non-signatory countries are top coal producers to justify why the effects of continued coal use are particularly significant for their economies.
Answer
China is described as a country of contradictions because of the stark contrast between its high reliance on coal and its investments in green technology:
- On one hand, China generates 70% of its electricity from coal and other fossil fuels, produces 31% of global CO2 emissions from coal use, and has projected coal use to reach a record level in 2022. It has refused to sign the international carbon policy agreement, stating it will not sacrifice its high 8.3% economic growth rate to reduce coal reliance.
- On the other hand, China is a leading investor in green technologies including solar, wind and hydro-electric power, is one of the world's largest users of electric cars, and is the leading global manufacturer of wind turbines for export.
China's heavy reliance on coal (driving 31% of global coal emissions and refusing international carbon agreements to protect 8.3% economic growth) directly contradicts its simultaneous leadership in green technology investment and wind turbine manufacturing.
Background Concept
Economic growth and environmental sustainability are often presented as competing macroeconomic objectives, particularly for developing and emerging economies that rely on fossil fuels to power industrialisation. A "contradiction" in this context refers to a country pursuing two opposing policies or outcomes at the same time: on one hand, activities that increase carbon emissions and harm long-run environmental sustainability, and on the other hand, policies to reduce emissions and invest in low-carbon alternatives.
Understanding the Question
This 4-mark part asks you to explain why the article describes China as a "country of contradictions" in the context of its energy and climate policy. The extract provides clear evidence of two opposing strands to China's approach: a heavy reliance on coal that drives high global emissions, and a major investment in green technology and leadership in the green tech sector. The command word "Discuss" requires you to present both sides of the contradiction, using evidence from the extract, and explicitly explain how they oppose each other.
Approach
First, identify the evidence in the extract that shows China's high reliance on coal and its refusal to prioritise emissions reduction over economic growth. Then, identify the evidence that shows China's significant investment in green technology and its leadership in this sector. Explain how these two strands are contradictory, as they work in opposite directions on global emissions.
Step-by-Step Reasoning
- The first side of the contradiction: China's coal-dependent growth model. The extract states that 70% of China's electricity comes from coal and other fossil fuels, it produces 31% of global CO2 emissions from coal use, and its coal use is projected to reach a record level in 2022. It has also refused to sign the international carbon policy agreement, explicitly stating it will not sacrifice its high 8.3% economic growth rate to reduce coal reliance. This shows China prioritising short-run economic growth over emissions reduction, contributing to global climate change.
- The second side of the contradiction: China's green technology leadership. Despite its high domestic coal use, the extract notes that China is a leading investor in green energy sources including solar, wind and hydro-electric power, is one of the world's largest users of electric cars, and is the leading global manufacturer of wind turbines for export. This means China is both a major contributor to global emissions and a key supplier of technologies that could reduce emissions globally.
- The contradiction arises because these two policies work against each other: high domestic coal use increases global emissions, while green investment and export of green tech aims to reduce emissions elsewhere. China is simultaneously one of the biggest causes of and one of the biggest potential solutions to global climate change.
Key Takeaways
- Contradictions in economic policy often arise from trade-offs between competing objectives, such as short-run economic growth and long-run environmental sustainability.
- To earn full marks, you must explicitly explain why two sets of policies or outcomes are contradictory, rather than just listing two separate facts about a country.
Common Mistakes
- Only presenting one side of the contradiction (either only the coal use or only the green investment), which would limit the mark to a maximum of 2, as both sides are required to show the contradiction.
- Not linking the points to the idea of a contradiction, merely listing two facts about China without explaining how they oppose each other.
- Making points not supported by the extract, such as claiming China has reduced its emissions, which is not stated in the source material.
Things to Be Careful About
- Ensure you explicitly explain why the two sets of policies are contradictory, rather than just listing them as separate facts.
- Use the specific figures from the extract (70% coal electricity, 31% of global emissions, 8.3% growth) to strengthen your points and demonstrate use of the source material.
With the help of a marginal social cost and benefit diagram discuss whether the continued use of coal to produce electricity makes the achievement of allocative efficiency less likely.
Answer
Definitions
Private cost is the cost of production borne directly by the producer. External cost is the cost imposed on third parties not involved in the transaction. Social cost is the sum of private and external costs. Allocative efficiency occurs when marginal social benefit equals marginal social cost (MSB = MSC), maximising total social welfare.
Analysis
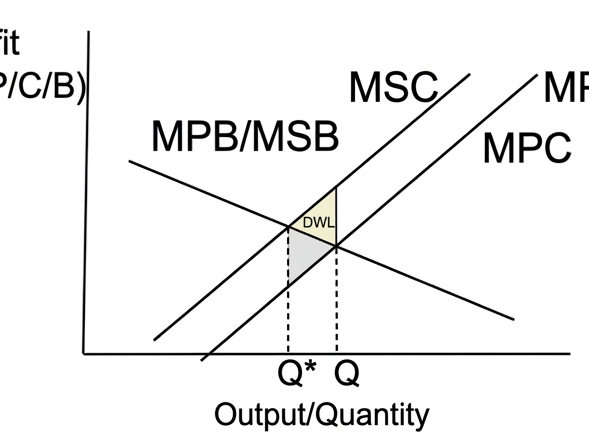
Coal production generates significant negative externalities, such as greenhouse gas emissions, air pollution and climate change costs, which are not borne by producers. This means marginal social cost (MSC) exceeds marginal private cost (MPC). As shown in the diagram, the unregulated free market equilibrium occurs where marginal private benefit (MPB) equals MPC, at output level Q. The socially optimal allocatively efficient output is where MSB equals MSC, at Q*, which is lower than Q. This overproduction creates a deadweight welfare loss (the shaded area between Q* and Q), so allocative efficiency is not achieved. The extract notes that 3 countries produce 52% of global CO2 emissions from coal use, highlighting the large scale of these external costs.
Evaluation and Conclusion
However, continued coal use does not inevitably make allocative efficiency unachievable. If external costs are internalised through policies such as carbon taxes equal to the marginal external cost, tradable pollution permits or strict emissions regulations, producers' private costs can be raised to match social costs, shifting the MPC curve up to MSC. This would reduce market output to Q*, restoring allocative efficiency even with continued coal use. Investment in green technology (as seen in China) can also reduce the size of external costs over time, narrowing the MSC-MPC gap and reducing the welfare loss. That said, in the absence of such policies, the large negative externalities of coal mean its continued use makes allocative efficiency significantly less likely. Overall, unregulated coal use reduces the likelihood of achieving allocative efficiency, but corrective policies can offset this effect.
Unregulated continued use of coal makes allocative efficiency less likely due to large negative externalities causing overproduction and deadweight welfare loss, but the introduction of policies to internalise external costs or reduce their size via technology can offset this effect.
Background Concept
Allocative efficiency is a key measure of economic welfare, achieved when resources are allocated in a way that maximises total benefit to society. It occurs when the marginal social benefit (MSB) of the last unit of a good produced equals its marginal social cost (MSC), meaning the value society places on the unit equals the full cost of producing it. Market failure occurs when the free market fails to achieve allocative efficiency, often due to externalities: costs or benefits imposed on third parties not involved in a transaction. Negative externalities of production arise when the production of a good imposes unaccounted costs on third parties, leading the market to overproduce the good relative to the socially optimal level, as producers ignore the external costs of their actions.
Understanding the Question
This 10-mark part asks you to discuss whether the continued use of coal to produce electricity makes the achievement of allocative efficiency less likely. The command word "discuss" requires a two-sided evaluation: you must explain the theoretical link between coal's negative externalities and allocative inefficiency, but also consider counterarguments or conditions under which allocative efficiency could still be achieved. The question also explicitly requires the use of a marginal social cost and benefit diagram to illustrate your analysis, and the mark scheme allocates 3 marks specifically for the diagram and its explanation.
Approach
First, define the four key terms required by the mark scheme: private cost, external cost, social cost and allocative efficiency. Then, draw and explain the MSC/MPB diagram showing negative externalities in production, linking it directly to coal use. Next, build the full chain of reasoning from coal's negative externalities to overproduction and allocative inefficiency, using extract evidence to demonstrate the scale of the externality. Then, evaluate the argument by considering policies that can internalise externalities, or conditions that reduce the size of the externality, which would restore allocative efficiency. End with a justified conclusion that answers the "whether" part of the question, stating the conditions under which coal use does or does not reduce the likelihood of allocative efficiency.
Step-by-Step Reasoning
- Definitions (AO1, 3 marks)
- Private cost: The cost of production directly borne by the producer of a good, such as the cost of coal, labour, capital and maintenance for a coal-fired power station.
- External cost: The cost of production imposed on third parties not involved in the transaction, such as healthcare costs from air pollution, costs of climate change damage (e.g. flood defences, crop failures), and lost productivity from pollution-related illness.
- Social cost: The total cost of production to society as a whole, equal to private cost plus external cost. On a diagram, this is represented by the marginal social cost (MSC) curve, which lies above the marginal private cost (MPC) curve by the amount of the marginal external cost (MEC).
- Allocative efficiency: The outcome where resources are allocated to maximise total social welfare, achieved when marginal social benefit (MSB) equals marginal social cost (MSC). At this point, the value society places on the last unit produced equals the full cost of producing it, so no one can be made better off without making someone else worse off.
- Diagram and Analysis (AO2, 7 marks)
The diagram illustrates the market for coal-generated electricity. The vertical axis measures price, cost or benefit in dollars, and the horizontal axis measures output quantity of electricity.
- The downward-sloping MPB/MSB curve represents the marginal benefit to consumers from electricity, which falls as more electricity is consumed.
- The lower upward-sloping MPC curve is the marginal private cost faced by power producers, which rises as more output is produced due to diminishing returns.
- The higher upward-sloping MSC curve is the marginal social cost, equal to MPC plus the marginal external cost of pollution from coal production.
In an unregulated free market, profit-maximising producers set output where MPB = MPC, resulting in market equilibrium output Q. However, the socially optimal allocatively efficient output is where MSB = MSC, at Q*, which is lower than Q. This is because the market ignores the external costs of coal production, so it overproduces electricity from coal. The deadweight welfare loss (the shaded triangle between Q* and Q, between the MSC and MPB curves) represents the loss of social welfare from this overproduction: the cost of producing units between Q* and Q is higher than the benefit they provide to society.
The extract notes that just 3 countries produce 52% of global CO2 emissions from coal use, showing the large scale of the negative externalities from coal production. This large externality increases the gap between MSC and MPC, leading to a larger welfare loss and a bigger divergence between the market equilibrium and the socially optimal output.
- Evaluation (AO3, 3 marks)
The argument that continued coal use makes allocative efficiency less likely assumes no policy intervention to correct the market failure. However, there are two key counterpoints that reduce the likelihood of inefficiency:- First, external costs can be internalised through government policy. A carbon tax set equal to the marginal external cost would raise producers' private costs to match social costs, shifting the MPC curve up to MSC. This would reduce market output to Q*, restoring allocative efficiency even with continued coal use. Similarly, tradable pollution permits (which set a cap on total emissions) or strict emissions regulations can force producers to account for external costs, moving the market towards the socially optimal output.
- Second, investment in green technology (as seen in China) can reduce the size of the external cost over time. For example, carbon capture and storage technology or cleaner coal burning methods reduce the marginal external cost (MEC), narrowing the gap between MSC and MPC. This reduces the welfare loss and moves the market closer to allocative efficiency, even without full internalisation of externalities.
That said, in the absence of effective policies to internalise externalities, the large negative externalities of coal mean its continued use makes allocative efficiency significantly less likely. The size of the effect also depends on the scale of coal use: the extract shows that a small number of countries produce the majority of emissions, so the impact on global allocative efficiency is concentrated in these economies, and corrective policies targeted at these countries would have a large positive effect.
- Conclusion
Overall, unregulated continued use of coal makes allocative efficiency less likely due to the large negative externalities it creates, leading to overproduction and deadweight welfare loss. However, the introduction of policies to internalise external costs or reduce the size of externalities through technology can offset this effect, meaning the outcome depends on the presence and effectiveness of corrective policies.
Key Takeaways
- Allocative efficiency requires that all social costs and benefits are accounted for in market decisions, not just private costs and benefits.
- Negative externalities of production cause the free market to overproduce the good, creating deadweight welfare loss and preventing allocative efficiency.
- Market failures from externalities can be corrected through policy intervention, which can restore allocative efficiency even for goods with significant external costs.
Common Mistakes
- Omitting the diagram, or drawing it incorrectly (e.g. labelling MSC as lower than MPC, or showing Q to the left of Q*), which would lose up to 3 marks as per the mark scheme guidance.
- Failing to explain the diagram in the prose, such as not stating what Q and Q* represent or why they differ, which would lose diagram marks even if the drawing is correct.
- Presenting a one-sided answer that only explains how coal use reduces allocative efficiency, without evaluating counterarguments, which would lose all evaluation marks (up to 3 marks for this 10-mark part).
- Confusing marginal private cost with marginal social cost, or mixing up the positions of Q and Q*, which would lead to an incorrect analysis and lost marks.
- Ending with a summary of both sides rather than a justified conclusion that answers the "whether" part of the question, which would lose the final mark for the conclusion.
Things to Be Careful About
- Label all curves and axes clearly in the diagram: the vertical axis is Price/Cost/Benefit, the horizontal axis is Output/Quantity, the downward-sloping curve is MPB/MSB, the lower upward-sloping curve is MPC, the higher upward-sloping curve is MSC. The mark scheme allocates marks specifically for correct labels, so omitting any will lose marks.
- Clearly mark the two equilibrium points: Q (market equilibrium where MPB=MPC) and Q* (socially optimal equilibrium where MSB=MSC), and show the deadweight welfare loss as the triangle between Q* and Q. The mark scheme requires correct identification of Q* and Q for full diagram marks.
- Ensure the evaluation explicitly addresses the "whether" in the question: do not just list caveats, but weigh the evidence to reach a verdict on the likelihood of achieving allocative efficiency with continued coal use.
- Use extract evidence (e.g. the 52% of emissions from 3 countries) to strengthen your analysis of the scale of the externality, as the mark scheme awards marks for correct use of extract data.
Monopolies restrict output to raise prices to exploit consumers.
With the help of a diagram, assess the extent to which a government should intervene in monopoly markets.
Introduction
A monopoly is a market structure characterised by a single seller, high barriers to entry, and price-making power. The statement that monopolies restrict output and raise prices is accurate in the standard model; however, whether government intervention is justified depends on the specific market conditions and the efficiency of alternative interventions.
The monopoly problem
A profit-maximising monopoly produces where marginal revenue equals marginal cost (MC = MR). This results in a lower output and a higher price than would occur under perfect competition (where P = MC). The diagram below illustrates this.
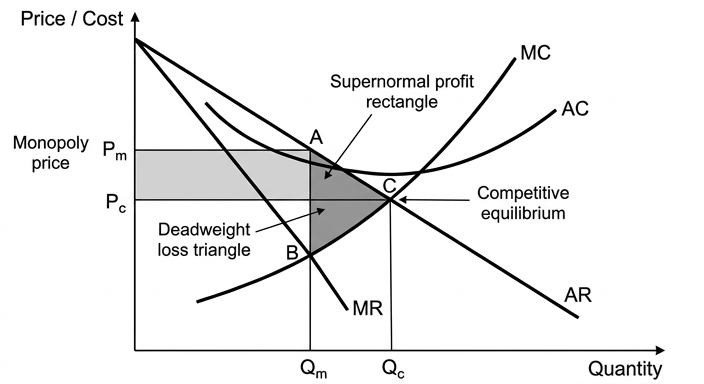
The diagram shows the monopoly equilibrium at Qm and Pm. At this output, price exceeds marginal cost, indicating allocative inefficiency – the value to consumers of an additional unit exceeds the cost of producing it, so too little is produced. Furthermore, consumers pay a higher price, transferring surplus to the monopolist as supernormal profit. The deadweight welfare loss (triangle ABC on the diagram) represents the net social loss from underproduction. Thus, the monopoly exploits consumers and reduces overall welfare.
The case for government intervention
Given the welfare loss, governments may intervene to correct the market failure. Possible policies include:
-
Price regulation: setting a maximum price at the competitive level (P = MC) forces the monopoly to produce at the socially efficient output, eliminating the deadweight loss. However, if the regulated price is set below average cost, the firm may make losses and exit in the long run.
-
Competition policy: legislation that prevents anti-competitive mergers, breaks up dominant firms, or prohibits predatory pricing can reduce market power and restore competition.
-
Nationalisation: public ownership of the monopoly (e.g., a natural monopoly in utilities) may allow direct pursuit of social welfare rather than profit, potentially lowering prices and increasing output.
-
Taxation: a lump-sum tax on monopoly profits can transfer the excess to the government without affecting output, but it does not address the allocative inefficiency directly.
Each of these policies can reduce the harm from monopoly, but they also have drawbacks.
The case against intervention
Government intervention is not always beneficial. Several arguments caution against it:
-
Natural monopoly: in industries where economies of scale are so large that one firm can supply the whole market at lower average cost than multiple firms (e.g., water, electricity grids), breaking up the monopoly or forcing competition would raise average costs and prices, harming consumers.
-
Dynamic efficiency: monopolies may have greater resources for research and development and can achieve dynamic gains that outweigh the static allocative inefficiency. Excessive regulation may stifle innovation.
-
X-inefficiency: without competitive pressure, a monopolist may become complacent and fail to minimise costs. Intervention may be poorly designed or enforced, leading to government failure: regulatory capture, bureaucratic delays, and misallocation of resources.
-
Incentive effects: price regulation that caps profits may discourage cost-reducing investment, leading to higher long-run costs and prices.
Evaluation
The extent to which a government should intervene depends crucially on the type of monopoly and the effectiveness of the available policy tools. For a pure non-natural monopoly with high barriers to entry and significant deadweight loss, intervention is well justified – competition policy to lower barriers or regulate prices can bring net social benefits. For a natural monopoly, direct regulation of price (to equal marginal cost with a subsidy to cover fixed costs, or average cost pricing) or public ownership may be appropriate to ensure allocative and productive efficiency, but only if the regulator has sufficient information and independence to avoid regulatory failure.
A blanket policy of strong intervention is not advisable; the costs of intervention must be weighed against the benefits. In practice, many economies adopt a mix of ex-ante regulation for natural monopolies and ex-post competition law for others, which is a proportionate approach.
Conclusion
The government should intervene in monopoly markets where the welfare loss is significant and the chosen policy can be implemented effectively. The extent of intervention should be calibrated: strong intervention (price controls or nationalisation) for natural monopolies with clear market failure, lighter touch (competition law) for other monopolies, and no intervention when dynamic efficiency or scale benefits outweigh the allocative inefficiency. Thus, a selective, case-by-case approach is best – intervention is justified but must be proportionate to the specific market conditions.
The government should intervene in monopoly markets to a significant but proportionate extent: strong intervention for natural monopolies where regulation or public ownership can improve welfare, and lighter competition policy for other monopolies; blanket intervention is unwise as it may cause government failure and stifle innovation.
Background Concept
A monopoly is a market structure with a single seller of a product that has no close substitutes, protected by high barriers to entry. The firm is a price maker and faces a downward-sloping demand curve. To maximise profit, it produces where marginal revenue (MR) equals marginal cost (MC). This output is lower and price higher than under perfect competition, where firms produce where price equals marginal cost (P = MC). The difference between the monopoly price and the competitive price represents a transfer of consumer surplus to producer surplus, and the reduction in output creates a deadweight welfare loss (allocative inefficiency). Governments may intervene to correct this market failure, but intervention has its own costs and may be inappropriate for natural monopolies where economies of scale make a single producer more efficient.
Understanding the Question
The question asks: given that monopolies restrict output and raise prices to the detriment of consumers, to what extent should a government intervene? This is an evaluative question requiring a two-sided argument. The command word is "assess the extent to which", which demands a balanced analysis and a justified conclusion that specifies the degree of intervention. The question also explicitly requires a diagram, which must be accurately labelled and fully explained. The mark scheme allocates 14 marks for knowledge and analysis (including the diagram) and 6 marks for evaluation. The top band requires detailed knowledge, fully developed explanations, a diagram that is fully explained, and a justified conclusion with developed evaluative comments.
Approach
We will structure the answer as an essay: first, present the theory of monopoly and its welfare consequences using a diagram. Then, present the case for government intervention, explaining several policies. Next, present the counter-arguments against intervention, focusing on natural monopoly, dynamic efficiency, and government failure. Finally, evaluate the competing arguments on criteria such as the type of monopoly and policy effectiveness, and reach a justified conclusion that specifies the extent of intervention. The diagram will show the monopoly equilibrium and the deadweight loss, and will be explained step by step in the analysis.
Step-by-Step Reasoning
-
Define monopoly and explain profit maximisation: A monopoly is a single seller with high barriers to entry. It faces the entire market demand curve, which is its average revenue (AR) curve. The marginal revenue (MR) curve lies below AR because the firm must lower price to sell additional units. Profit maximisation occurs where MR = MC. This yields quantity Qm and price Pm (read off the demand curve).
-
Compare to perfect competition: Under perfect competition, the firm is a price taker and produces where P = MC. The competitive output Qc would be higher and price Pc lower. The difference between Pm and Pc reflects consumer exploitation; the area Pm * Qm versus Pc * Qc shows the transfer. The triangle between the demand curve and the MC curve from Qm to Qc is the deadweight loss.
-
Explain the diagram: In the diagram, label axes: price/cost on the vertical axis, quantity on the horizontal. Draw downward-sloping AR (demand) and MR, upward-sloping MC (and AC for profit rectangle). Equilibrium at MR=MC gives Qm, price from AR at Qm. Show competitive equilibrium at Pc = MC (where AR intersects MC at Qc). Shade the deadweight loss triangle under AR and above MC between Qm and Qc. Also shade the supernormal profit rectangle (Pm - AC) * Qm.
-
Present arguments for intervention: Price regulation (set P = MC) forces allocative efficiency but may cause losses if AC is above MC at Qc; a subsidy may be needed. Competition policy reduces barriers, breaks up monopolies, prohibits anti-competitive practices. Nationalisation puts the firm under public control to pursue social welfare. Taxation of profits redistributes income but does not affect output. These policies aim to reduce the exploitation and deadweight loss.
-
Present arguments against intervention: Natural monopolies have falling long-run AC; splitting them raises costs and prices. Dynamic efficiency: monopoly profits can fund R&D, leading to product improvements over time. X-inefficiency: protected monopolies may not minimise costs. Government failure: regulation may be captured, poorly informed, or slow; nationalised firms face principal-agent problems and political interference. Intervention might impose more costs than benefits.
-
Evaluation: Weigh the two sides. Use criteria: (i) Type of monopoly: if natural, intervention must be careful (price regulation that allows a fair return, or public ownership with performance targets). If non-natural, competition policy is often the best first step. (ii) Magnitude of deadweight loss: if small, intervention may not be worth the cost. (iii) Feasibility of regulation: if the regulator cannot set efficient prices, intervention may worsen outcomes. (iv) Dynamic versus static efficiency: if innovation is important, allowing some monopoly power may be beneficial. The conclusion should state that intervention is justified in principle but must be tailored to circumstances; a one-size-fits-all policy is not optimal.
-
Conclusion: The extent of intervention should be significant for clear-cut cases of non-natural monopolies with large deadweight loss, moderate for natural monopolies where regulation or public ownership can improve upon the private outcome if properly designed, and minimal where dynamic benefits exceed static losses. A case-by-case approach with careful policy design is recommended.
Key Takeaways
- Monopoly leads to allocative inefficiency and consumer exploitation, justifying government intervention in many cases.
- The monopoly diagram with MR=MC and deadweight loss is essential for analysis.
- Government intervention does not always improve outcomes; natural monopoly, dynamic efficiency, and government failure are important counter-arguments.
- The extent of intervention should depend on the specific market characteristics and the effectiveness of the policy tools available.
- A justified conclusion must weigh the arguments and give a clear verdict on the extent.
Common Mistakes
- Omitting the diagram or drawing it incorrectly (axes unlabelled, wrong curves). The mark scheme caps at Level 2 (8 marks) without a diagram.
- Presenting a one-sided analysis that only criticises monopoly without considering the drawbacks of intervention – this loses AO3 marks entirely.
- Providing a vague conclusion like "it depends" without specifying what it depends on or giving a judgement.
- Using the wrong diagram (e.g., a simple supply and demand diagram for a competitive market) instead of a monopoly cost/revenue diagram.
- Not explaining the diagram in the text; simply drawing it is insufficient.
- Listing policies without analysing their effectiveness or drawbacks.
- Writing a descriptive rather than analytical essay: needs chains of reasoning.
Things to Be Careful About
- The diagram must be fully labelled: axes (Price/Cost, Quantity), AR, MR, MC, AC, equilibrium points (Qm, Pm, Qc, Pc), and the deadweight loss triangle shaded.
- Use the correct terms: supernormal profit, deadweight welfare loss, allocative inefficiency, natural monopoly, X-inefficiency, regulatory capture.
- In the evaluation, do not simply list pros and cons; weigh them on explicit criteria (e.g., time horizon, market type, feasibility of policy).
- Ensure the conclusion directly answers the question: it should state the extent to which government should intervene (e.g., "to a great extent but only in specific cases") and give a reasoned justification.
- Keep the essay focused on monopoly markets; avoid drifting into general market failure.
With the help of a diagram, assess whether the impact of an increase in labour productivity on the wages and employment of a firm is likely to be greater in a perfectly competitive labour market than in an imperfectly competitive labour market.
Introduction
Labour productivity refers to the output per worker per period. An increase in labour productivity raises the marginal revenue product (MRP) of labour, shifting the firm's demand for labour curve to the right. This essay assesses whether the impact on wages and employment is greater in a perfectly competitive labour market than in an imperfectly competitive (monopsonistic) labour market. The analysis uses diagrams for both market structures and concludes with a justified judgement.
Analysis of a Perfectly Competitive Labour Market
In a perfectly competitive labour market, there are many firms and many workers, labour is homogeneous, and there is perfect information and perfect mobility. Each firm is a wage taker, facing a perfectly elastic supply of labour at the market wage. The firm hires labour up to the point where MRP = wage (W).
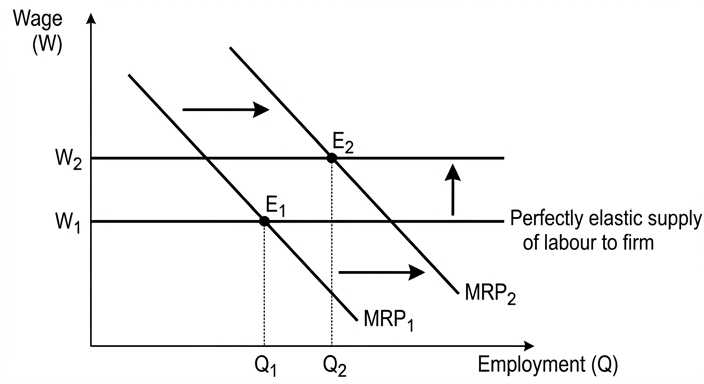
Diagram 1 shows the firm's initial equilibrium at E1, with employment Q1 and wage W1 (determined by market forces). An increase in labour productivity shifts the MRP curve from MRP1 to MRP2. At the initial wage W1, the firm now demands more labour (Q2). However, because all firms experience the same productivity increase, the market demand for labour rises, pushing the market wage up to W2. The new equilibrium for the firm is at E2, with higher wage W2 and higher employment Q2. Thus, in perfect competition, both wages and employment rise. The increase in employment is from Q1 to Q2, and the wage increase is from W1 to W2.
Analysis of an Imperfectly Competitive Labour Market (Monopsony)
In an imperfectly competitive labour market, a single firm (monopsonist) dominates the hiring of labour. The firm faces an upward-sloping supply curve of labour (SL) and a marginal cost of labour curve (MCL) that lies above SL. The monopsonist hires where MRP = MCL and pays the wage on the supply curve at that employment level.
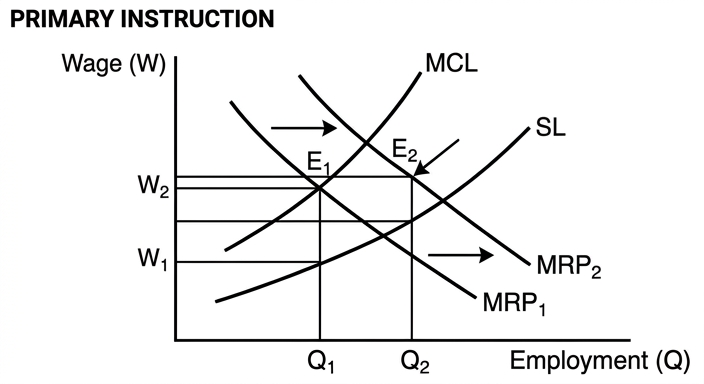
Diagram 2 shows the initial equilibrium at E1, with employment Q1 and wage W1. An increase in labour productivity shifts the MRP curve from MRP1 to MRP2. The new equilibrium is at E2, where MRP2 = MCL, leading to higher employment Q2 and a higher wage W2. However, the increase in wage (W1 to W2) is smaller than the increase in MRP because the monopsonist restricts employment to keep wages down. The employment increase (Q1 to Q2) is also smaller than it would be if the firm were a wage taker. Thus, in monopsony, both wages and employment rise, but by less than in perfect competition.
Evaluation
The analysis above suggests that the impact of an increase in labour productivity on wages and employment is greater in a perfectly competitive labour market. However, several factors qualify this conclusion.
First, the model of perfect competition relies on unrealistic assumptions: homogeneous labour, perfect mobility, and perfect information. In reality, labour is differentiated, and workers may not move freely between firms. Training costs associated with productivity improvements can further reduce mobility and create skill differentiation, undermining the assumption of homogeneity.
Second, measuring labour productivity is difficult, especially in service sectors (e.g., health, education). If productivity gains are not accurately measured, the actual shift in MRP may be smaller than assumed.
Third, an increase in labour productivity might result from capital substitution (e.g., automation), which could reduce employment rather than increase it. The impact on employment depends on the elasticity of substitution between capital and labour and the existing capital-labour ratio.
Fourth, in a monopsonistic market, the presence of trade unions could force the firm to share more of the productivity gains with workers, potentially increasing wages more than the simple model predicts. Conversely, if the monopsonist faces competition from other firms (e.g., in a more contestable labour market), the impact might approach that of perfect competition.
Finally, the magnitude of the impact depends on the elasticities of labour demand and supply. In perfect competition, the wage increase depends on the elasticity of market labour supply; in monopsony, it depends on the elasticity of the firm's labour supply. If the supply of labour is highly inelastic, the wage increase in perfect competition could be large, while in monopsony the wage increase might be limited.
Conclusion
Overall, the impact of an increase in labour productivity on wages and employment is likely to be greater in a perfectly competitive labour market than in an imperfectly competitive (monopsonistic) labour market. In perfect competition, the full productivity gain is transmitted to wages and employment through market forces, whereas in monopsony, the firm captures some of the gain as profit, dampening the wage and employment response. However, the extent of the difference depends on the specific assumptions of each model and real-world factors such as labour mobility, measurement issues, capital substitution, and the presence of unions. Therefore, while the theoretical prediction is clear, the actual outcome in any given market may vary.
The impact of an increase in labour productivity on wages and employment is likely to be greater in a perfectly competitive labour market than in an imperfectly competitive (monopsonistic) labour market, because in perfect competition the full productivity gain is passed on to wages and employment through market forces, whereas in monopsony the firm restricts employment and wage increases to capture some of the gain as profit. However, the magnitude of the difference depends on real-world factors such as labour mobility, measurement of productivity, capital substitution, and union power.
Background Concept
Labour productivity is the amount of output produced per worker per period. An increase in labour productivity means each worker produces more output, which raises the marginal revenue product (MRP) of labour – the additional revenue generated by hiring one more worker. The MRP curve is the firm's demand for labour curve. In any labour market, a firm hires workers up to the point where MRP equals the marginal cost of labour (MCL). The wage paid depends on the market structure.
In a perfectly competitive labour market, the firm is a wage taker: it can hire any number of workers at the market wage, so the supply of labour to the firm is perfectly elastic. The firm hires where MRP = wage. The market wage is determined by the intersection of market labour demand and supply.
In an imperfectly competitive labour market, a monopsonist is the sole buyer of labour. It faces an upward-sloping supply curve of labour (SL), meaning to hire more workers it must raise the wage for all workers. The marginal cost of labour (MCL) lies above the supply curve because hiring an extra worker raises the wage for all existing workers. The monopsonist hires where MRP = MCL and pays the wage on the supply curve at that employment level.
Understanding the Question
The question asks you to assess whether the impact of an increase in labour productivity on wages and employment is greater in a perfectly competitive labour market or in an imperfectly competitive labour market. The command word is "assess", which requires a two-sided evaluation and a justified conclusion. The question also specifies "with the help of a diagram", so you must include at least one diagram (likely two) and explain it fully. The mark scheme allocates 14 marks for AO1/AO2 (knowledge, analysis, diagram) and 6 marks for AO3 (evaluation). The top band for AO1/AO2 requires detailed knowledge, fully developed explanations, accurate diagrams fully explained, and a well-organised response. The top band for AO3 requires a justified conclusion and developed evaluative comments.
Approach
- Define key terms: labour productivity, perfectly competitive labour market, imperfectly competitive labour market (monopsony).
- Explain the theoretical impact of an increase in labour productivity in a perfectly competitive labour market: shift MRP right, increase market wage and employment. Use a diagram for the firm and market.
- Explain the theoretical impact in a monopsonistic labour market: shift MRP right, increase employment and wage, but by less than in perfect competition. Use a diagram for the monopsonist.
- Compare the two: in perfect competition, the wage and employment rise more because the firm cannot capture any surplus; in monopsony, the firm restricts employment to keep wages down.
- Evaluate the analysis: discuss assumptions of perfect competition (unrealistic), measurement issues, capital substitution, role of unions, elasticities.
- Conclude with a justified judgement: the impact is likely greater in perfect competition, but real-world factors may reduce the difference.
Step-by-Step Reasoning
Step 1: Perfectly competitive labour market
- The firm is a wage taker, so its labour supply curve is horizontal at the market wage W1.
- Initially, the firm hires Q1 where MRP1 = W1.
- An increase in labour productivity shifts MRP to MRP2.
- At the initial wage W1, the firm would want to hire Q2, but the market wage adjusts.
- Because all firms experience the productivity increase, market demand for labour shifts right, raising the market wage to W2.
- The new equilibrium for the firm is at Q2, W2. Both wage and employment increase.
- The diagram shows the firm's MRP shift and the market wage increase.
Step 2: Monopsonistic labour market
- The monopsonist faces an upward-sloping supply curve SL and MCL above SL.
- Initially, equilibrium at E1: MRP1 = MCL, employment Q1, wage W1 on SL.
- Productivity increase shifts MRP to MRP2.
- New equilibrium at E2: MRP2 = MCL, employment Q2, wage W2 on SL.
- The wage increase (W1 to W2) is smaller than the increase in MRP because the monopsonist restricts employment to keep wages down. The employment increase (Q1 to Q2) is also smaller than it would be if the firm were a wage taker.
- The diagram shows the shift in MRP and the new equilibrium.
Step 3: Comparison
- In perfect competition, the wage and employment rise more because the market forces transmit the full productivity gain. In monopsony, the firm captures some of the gain as profit, so the wage and employment increases are dampened.
- Therefore, the impact is greater in perfect competition.
Step 4: Evaluation
- Assumptions of perfect competition are unrealistic: labour is not homogeneous, mobility is imperfect, information is not perfect. Training costs can reduce net productivity gains and create skill differentiation.
- Measuring labour productivity is difficult, especially in services. If productivity gains are overestimated, the actual impact may be smaller.
- Productivity increases may come from capital substitution (automation), which could reduce employment rather than increase it. The effect depends on the elasticity of substitution.
- In monopsony, trade unions may force the firm to share more of the gains, increasing wages more than the simple model predicts. Conversely, if the labour market is contestable, the monopsonist may behave more like a competitive firm.
- The elasticities of labour demand and supply affect the magnitude. In perfect competition, the wage increase depends on the elasticity of market labour supply; in monopsony, it depends on the elasticity of the firm's labour supply. If supply is inelastic, the wage increase in perfect competition could be large, while in monopsony it might be limited.
Step 5: Conclusion
- The theoretical prediction is that the impact is greater in perfect competition. However, real-world factors can reduce the difference. The conclusion should state that while the impact is likely greater in perfect competition, the extent depends on specific market conditions.
Key Takeaways
- Labour productivity increases shift the MRP curve right, increasing labour demand.
- In a perfectly competitive labour market, the firm is a wage taker, and the market wage adjusts, leading to higher wages and employment.
- In a monopsonistic labour market, the firm has market power and restricts employment, so the wage and employment increases are smaller.
- Diagrams are essential to illustrate the equilibria and shifts.
- Evaluation should consider assumptions, measurement issues, capital substitution, union power, and elasticities.
- A justified conclusion must weigh the theoretical prediction against real-world complexities.
Common Mistakes
- Omitting the diagram or not explaining it fully. The mark scheme caps at Level 2 if no diagram.
- Only analysing one market structure. The question requires comparison; analysing only perfect competition or only monopsony limits marks to Level 2.
- Not discussing the impact on both wages and employment. The question explicitly asks for both.
- Providing a one-sided answer without evaluation. The command word "assess" requires two-sided analysis and a conclusion.
- Confusing the firm's and market's diagrams in perfect competition. The firm's diagram shows a horizontal supply curve; the market diagram shows upward-sloping supply and downward-sloping demand.
- Forgetting that in monopsony, the wage is on the supply curve, not at the intersection of MRP and MCL.
- Not linking the productivity increase to the shift in MRP. Some candidates might discuss productivity without connecting it to labour demand.
- Giving a vague conclusion without justification. The conclusion must state which market structure experiences a greater impact and why.
Things to Be Careful About
- Label all axes and curves clearly in the diagrams. For perfect competition: wage on vertical axis, employment on horizontal axis; show MRP1, MRP2, supply curve (horizontal), and the market wage line. For monopsony: show SL, MCL, MRP1, MRP2, and the equilibrium points.
- Explain the diagrams in the text: state which curve shifts, in which direction, and what happens to equilibrium wage and employment.
- Use correct terminology: "marginal revenue product", "monopsony", "perfectly competitive labour market".
- Distinguish between the firm and the market in perfect competition. The firm's diagram shows a horizontal supply; the market diagram shows upward-sloping supply and downward-sloping demand. You can combine them or show both.
- In the evaluation, do not just list limitations; develop each point and explain how it affects the conclusion.
- Ensure the conclusion directly answers the question: which market structure is likely to have a greater impact? Provide a clear judgement.
- Keep the essay well-organised with clear sections. Use paragraphs and logical flow.
With the help of an injections and withdrawals graph, assess the impact of a decrease in interest rates on the level of employment in an economy.
Introduction
Injections (J) are additions to the circular flow of income: investment (I), government spending (G), and exports (X). Withdrawals (W) are leakages: savings (S), taxation (T), and imports (M). The level of employment is determined by the level of aggregate demand (AD) and national income (Y). A decrease in interest rates increases AD, raising Y and therefore employment, but the extent depends on several factors.
The case that lower interest rates increase employment
A decrease in interest rates reduces the cost of borrowing, encouraging firms to invest (I rises) and households to consume (C rises, which reduces savings, so S falls). This increases injections (J) and reduces withdrawals (W). The net effect is a rise in aggregate demand.
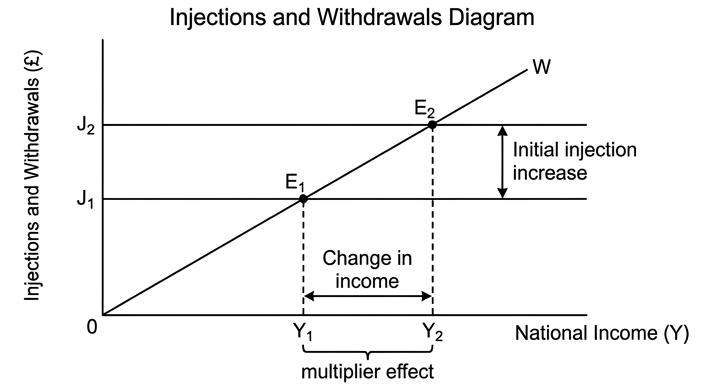
As shown in the J/W diagram, the J curve shifts upward from J1 to J2, while the W curve may shift slightly downward (if savings fall), but the main effect is the shift in J. The new equilibrium Y2 is higher than Y1. The increase in Y is amplified by the multiplier: k = 1 / (1 - MPC) or 1 / (MPW). The final increase in Y is k times the initial injection. Higher Y means firms produce more, so they employ more workers, reducing unemployment. This is particularly effective if the economy is operating below full capacity, with a negative output gap.
The case against a strong positive impact on employment
If the economy is already near full employment, the increase in AD may cause demand-pull inflation rather than a rise in output. The W curve may steepen if the marginal propensity to withdraw is high, reducing the multiplier. Lower interest rates can also lead to a depreciation of the currency (due to lower capital inflows), raising import prices and causing cost-push inflation, which may offset any real output gains. If the unemployment is structural (e.g., mismatch of skills), lower interest rates will not help; only supply-side policies can address that. Time lags mean the effect on employment may take months or years, and firms may be cautious about hiring if the policy is expected to be temporary.
Evaluation
The net impact depends on the state of the economy. If there is spare capacity, the increase in AD translates into higher output and employment, and the multiplier effect is strong. If the economy is at full capacity, inflation dominates and real output changes little. The type of unemployment matters: a decrease in interest rates is effective against cyclical (demand-deficient) unemployment but not structural. The size of the multiplier and accelerator effects also matter: if the marginal propensity to consume is high, the multiplier is large, boosting employment. However, time lags and the risk of inflation or currency depreciation reduce the effectiveness. The policy works best when accompanied by supply-side measures to increase potential output.
Conclusion
A decrease in interest rates can increase employment in the short run if the economy has spare capacity and unemployment is cyclical, but it is less effective if the economy is at full employment, if unemployment is structural, or if inflationary pressures and currency depreciation undermine real gains. The policy should be used as part of a broader strategy, and its impact is limited by the size of the multiplier and time lags.
A decrease in interest rates can raise employment when there is a negative output gap and cyclical unemployment, but its effectiveness is limited by inflation, structural unemployment, time lags, and the size of the multiplier.
Background Concept
The circular flow of income model shows how spending (injections) and leakages (withdrawals) determine national income. Injections are spending that does not come from domestic households: investment (I), government spending (G), and exports (X). Withdrawals are income that is not spent on domestic goods: savings (S), taxation (T), and imports (M). Equilibrium occurs when total injections equal total withdrawals (J = W). The multiplier (k) is the ratio of the change in national income to the initial change in injections: k = 1 / (1 - MPC) = 1 / (MPW). The marginal propensity to withdraw (MPW) is the sum of MPS, MPT, and MPM. A higher MPW reduces the multiplier. Employment is derived from the level of output, which is determined by aggregate demand (AD). The J/W graph is a diagram with national income (Y) on the horizontal axis and injections/withdrawals on the vertical axis. The J curve is horizontal (since injections are assumed autonomous, except for the possible effect of income on induced investment, but for simplicity it is often drawn as a horizontal line). The W curve slopes upward because as income rises, savings, taxation, and imports increase.
Understanding the Question
The question asks: 'With the help of an injections and withdrawals graph, assess the impact of a decrease in interest rates on the level of employment in an economy.' The command word is 'assess', which requires a two-sided evaluation and a justified conclusion. The question specifies that an injections and withdrawals graph must be used. The marking scheme explicitly states: 'No J/W graph Max L2, 8 marks.' So a diagram is mandatory. The answer must focus on the link between interest rates, injections, national income, and employment. The indicative content mentions that the response should analyse how a decrease in interest rates affects employment through different components of aggregate demand, and then evaluate the impact considering factors like inflation, currency depreciation, type of unemployment, time lags, and multiplier effects.
Approach
This is a levels-marked essay. The structure should be:
- Introduction: define key terms (injections, withdrawals, employment) and state the relationship.
- First side (analysis of why lower interest rates increase employment): explain the mechanism (lower interest rates -> lower cost of borrowing -> higher investment and consumption -> higher injections -> shift in J curve upward -> higher equilibrium Y -> higher output -> more employment). Include the diagram and explain it. Mention the multiplier effect.
- Second side (analysis of why the impact may be limited or negative): discuss inflation if the economy is at full capacity, currency depreciation causing cost-push inflation, structural unemployment, time lags, high MPW reducing the multiplier, and the possibility of the accelerator effect causing volatility.
- Evaluation: weigh the conditions that determine the net effect (spare capacity vs. full capacity, type of unemployment, size of multiplier, time lags, risk of inflation).
- Conclusion: a justified judgement answering the specific question, stating the circumstances under which the policy is effective.
Step-by-Step Reasoning
-
Define key concepts: Injections (I, G, X) add to the circular flow; withdrawals (S, T, M) leak out. The equilibrium level of national income (Y) is where J = W. Employment is positively related to Y because firms hire more workers to produce more output. A decrease in interest rates reduces the cost of borrowing, which increases investment (I) and consumption (C) (since saving is less attractive). This raises injections (J increases) and reduces withdrawals (S falls).
-
Draw the J/W diagram: The diagram has Y on the horizontal axis and J, W on the vertical axis. The J curve is horizontal (assuming autonomous injections). The W curve slopes upward. Initially, equilibrium is at Y1 where J1 = W. When interest rates fall, J increases to J2. The new equilibrium is at Y2, higher than Y1. The increase in Y is from Y1 to Y2, which is larger than the initial increase in J due to the multiplier. The multiplier effect occurs because the extra income leads to further spending in the economy. The size of the multiplier depends on the marginal propensity to withdraw (MPW).
-
Explain the link to employment: Higher Y means firms produce more goods and services, requiring more workers. This reduces unemployment, especially if there is a negative output gap (i.e., the economy is operating below full capacity). The policy is an example of expansionary monetary policy.
-
Develop the counter-arguments: If the economy is at full employment, the increase in AD causes demand-pull inflation, and real output may not rise much. The price level rises, which could reduce real wages and consumption, partially offsetting the initial boost. Lower interest rates may also lead to a depreciation of the currency (because lower rates make the currency less attractive to foreign investors), which increases the cost of imports, causing cost-push inflation. This could reduce real income and spending. If the unemployment is structural (e.g., due to a mismatch of skills), lower interest rates will not create jobs because the unemployed are not in the right sectors. Time lags: the effect of lower interest rates on investment decisions takes time, and firms may wait to see if the policy is permanent before hiring. The multiplier may be small if the marginal propensity to consume is low (e.g., if households are debt-constrained or prefer to save more). Also, the accelerator effect may cause investment to be volatile, amplifying the cycle.
-
Evaluate: The net impact depends on the economic context. If there is spare capacity (negative output gap) and cyclical unemployment, the policy is likely to be effective in raising employment, with a strong multiplier effect. If the economy is at full capacity, the policy mainly causes inflation. If the economy is experiencing structural unemployment, the policy is ineffective unless combined with supply-side measures. The magnitude of the multiplier and the size of the initial injection (change in I and C) determine the overall effect. Time lags mean that the impact may be delayed, which could be problematic if the economy needs immediate stimulus. The policy also risks creating asset bubbles (e.g., house prices) and worsening inequality.
-
Conclusion: A decrease in interest rates can increase employment in the short run when there is a negative output gap and cyclical unemployment, but its effectiveness is limited by inflation, structural unemployment, time lags, and the size of the multiplier. It is not a panacea and should be used with other policies.
Key Takeaways
- The injections/withdrawals model is a tool to analyse the relationship between aggregate demand, national income, and employment.
- A decrease in interest rates increases injections (investment and consumption) and reduces withdrawals (savings), shifting the J curve up and increasing equilibrium Y.
- The multiplier amplifies the initial change in injections.
- The impact on employment depends on the state of the economy (spare capacity vs. full capacity), the type of unemployment, and the size of the multiplier.
- Evaluation must consider inflation, currency depreciation, time lags, and structural factors.
- A justified conclusion requires weighing these factors and stating the conditions under which the policy is effective.
Common Mistakes
- Omitting the diagram: this costs a band (maximum L2, 8 marks).
- Drawing a diagram without explanation: the diagram must be fully explained in the prose.
- Focusing only on the positive effects (one-sided): this forfeits all evaluation marks (AO3 out of 6).
- Discussing supply-side or fiscal policy instead of monetary policy: the mark scheme says 'No credit for alternative policies'.
- Confusing injections and withdrawals: e.g., labelling savings as an injection.
- Not linking the analysis to employment: some candidates discuss income but forget to connect to employment.
- Making a vague conclusion: 'it depends' without saying on what and how it affects the outcome.
- Using a general AD/AS diagram instead of a J/W diagram: the question specifically requires a J/W graph.
Things to Be Careful About
- Label the axes correctly: Y (national income) on the horizontal, J and W on the vertical.
- Draw the J curve as horizontal (or slightly upward sloping if induced investment is considered, but for simplicity, horizontal is typical).
- Show the shift in J upward and the new equilibrium point.
- Explain the multiplier: include the formula and the factors that determine its size.
- Distinguish between cyclical and structural unemployment: the policy only addresses cyclical.
- Mention the possibility of demand-pull inflation if the economy is at full capacity.
- Consider the exchange rate channel: lower interest rates may depreciate the currency, affecting net exports and inflation.
- Time lags: the impact on employment may not be immediate.
- Use the extract's data? There is no extract in this question; it's a pure essay.
- The conclusion must be specific: state the conditions under which the policy is effective and give a clear judgement.
Globalisation will have an equally beneficial effect on the standard of living in both high-income and low-income countries.
Evaluate this statement.
Introduction
Globalisation refers to the increasing integration of economies through trade, capital flows, labour migration, and technology transfer. Living standards encompass both monetary measures such as real GDP per capita and non-monetary indicators like health, education, and environmental quality. This essay evaluates whether globalisation has an equally beneficial effect on living standards in high-income and low-income countries.
The case that globalisation benefits both types of economy
Globalisation promotes trade based on comparative advantage, allowing countries to specialise in goods and services they produce most efficiently. For low-income countries, this can lead to export-led growth, raising incomes and employment. For example, many East Asian economies experienced rapid industrialisation by integrating into global supply chains. Foreign direct investment (FDI) from multinational corporations brings capital, technology, and managerial skills, boosting productivity and wages. Technology transfer also enables low-income countries to leapfrog stages of development, improving access to communications, healthcare, and education. Remittances from migrant workers in high-income countries provide a direct income boost to low-income households. For high-income countries, globalisation provides access to cheaper imports, reducing the cost of living and freeing resources for higher-value activities. It also opens export markets for sophisticated goods and services, supporting high-wage jobs. Thus, both sets of countries can experience rising real incomes and improved access to goods and services, which are key components of higher living standards.
The case that the benefits are not equal and may be limited
The statement that the effect is 'equally beneficial' is questionable. Low-income countries often lack the infrastructure, institutions, and human capital to fully capture the gains from globalisation. They may become locked into low-value commodity exports, facing volatile prices and deteriorating terms of trade. Multinational corporations may exploit weak labour and environmental standards, leading to poor working conditions and environmental degradation, which harm living standards. The benefits of FDI may be concentrated in export zones, with limited spillovers to the wider economy. In contrast, high-income countries may experience job losses in manufacturing due to import competition, increasing inequality and social costs. The gains from cheaper imports may not compensate for lost livelihoods, especially for low-skilled workers. Moreover, globalisation increases long-distance transport, generating negative externalities such as carbon emissions, which disproportionately affect low-income countries that are more vulnerable to climate change. Measurement of living standards is also problematic: GDP per capita may rise while non-monetary indicators like health and environmental quality deteriorate. Thus, the distribution of benefits is uneven, and the net effect on living standards depends on how gains are used and how costs are managed.
Evaluation
The impact of globalisation on living standards is context-dependent. In the long run, low-income countries that invest in education, infrastructure, and good governance can harness globalisation to achieve sustained improvements in living standards, as seen in South Korea and China. However, many low-income countries remain trapped in primary commodity dependence, with limited gains. High-income countries can mitigate adjustment costs through social safety nets and retraining, but the political backlash against globalisation suggests that perceived benefits are not equally shared. The statement is an oversimplification: globalisation can raise living standards in both types of economy, but the effect is not equally beneficial. The benefits are larger and more widely distributed in high-income countries with strong institutions, while low-income countries face greater risks and require complementary policies to realise gains. A more accurate statement is that globalisation offers opportunities for improved living standards, but the outcome depends on domestic policies and the global distribution of power.
Conclusion
Globalisation has the potential to improve living standards in both high-income and low-income countries through trade, investment, and technology transfer. However, the benefits are not equally distributed, and the net effect is contingent on each country's ability to manage the process. The statement that globalisation will have an equally beneficial effect is therefore not supported; a more nuanced view recognises that while both can gain, the magnitude and distribution of gains differ significantly.
Globalisation can improve living standards in both high-income and low-income countries, but the benefits are not equally distributed; the statement is an oversimplification as outcomes depend on domestic policies, institutional quality, and the ability to manage adjustment costs.
Background Concept
Globalisation is the process of increasing economic integration between countries, driven by trade liberalisation, capital mobility, labour migration, and technological advances. It is closely linked to the theory of comparative advantage, which suggests that countries can gain from specialisation and trade. Living standards are a multidimensional concept: monetary measures like real GDP per capita capture average income, but non-monetary indicators such as life expectancy, literacy, access to clean water, and environmental quality are also important. The Human Development Index (HDI) combines income, education, and health. Evaluating the impact of globalisation on living standards requires considering both the potential gains (higher incomes, technology transfer, cheaper goods) and the costs (inequality, job displacement, environmental damage).
Understanding the Question
The question asks you to evaluate the statement: 'Globalisation will have an equally beneficial effect on the standard of living in both high-income and low-income countries.' The command word is 'evaluate', which requires a two-sided analysis and a justified conclusion. The statement makes two claims: (1) globalisation has a beneficial effect on living standards, and (2) this effect is equally beneficial for both types of countries. You must assess both claims. The mark scheme emphasises that if only one level of income is considered, the maximum mark is limited (L2 max 10). Therefore, you must discuss both high-income and low-income countries. The indicative content suggests analysing trade, FDI, technology transfer, remittances, and also considering negative externalities, measurement issues, and the possibility that gains are not used effectively.
Approach
Start by defining globalisation and living standards. Then present the case that globalisation can benefit both types of economy: trade based on comparative advantage, FDI, technology transfer, remittances for low-income countries; cheaper imports and export markets for high-income countries. Then present the counter-case: low-income countries may face commodity dependence, exploitation, environmental costs; high-income countries may suffer job losses and inequality. Evaluate by weighing the arguments: consider time horizon (short-run adjustment vs long-run growth), the role of institutions and policies, and the difficulty of measuring living standards. Conclude that the statement is an oversimplification; globalisation can be beneficial but not equally so, and the outcome depends on context.
Step-by-Step Reasoning
- Define key terms: Globalisation as integration of economies; living standards as a broad concept including income, health, education, environment. This sets the foundation.
- First side – benefits for both:
- Trade: Low-income countries export labour-intensive goods, high-income countries export capital-intensive goods. Both gain from specialisation.
- FDI: MNCs bring capital, technology, jobs to low-income countries; high-income countries receive returns on investment and access to cheaper production.
- Technology transfer: Low-income countries adopt new technologies, improving productivity and living standards.
- Remittances: Migrant workers send money home, boosting consumption and investment in low-income countries.
- For high-income countries: Cheaper imports reduce cost of living; export markets for high-value goods support high wages.
- Second side – unequal benefits and limitations:
- Low-income countries may lack infrastructure, education, and institutions to absorb gains. They may remain dependent on primary commodities with volatile prices.
- MNCs may exploit weak regulations, leading to poor labour conditions and environmental damage, harming living standards.
- High-income countries face structural unemployment in import-competing sectors, increasing inequality and social costs.
- Negative externalities from transport (carbon emissions) affect all, but low-income countries are more vulnerable to climate change.
- Measurement issues: GDP may rise while other indicators worsen, so the true effect on living standards is ambiguous.
- Evaluation:
- The net effect depends on how gains are used. Low-income countries that invest in education and infrastructure (e.g., South Korea) have seen large improvements; those that do not (e.g., many African countries) have seen limited gains.
- High-income countries can mitigate costs through welfare and retraining, but political backlash shows that perceived benefits are not equally shared.
- The statement 'equally beneficial' is too strong; benefits are larger and more secure for high-income countries with strong institutions.
- Conclusion: Globalisation offers opportunities but not equal benefits; the statement is not supported. A more accurate view is that globalisation can improve living standards in both, but the extent and distribution depend on domestic policies and global power structures.
Key Takeaways
- Globalisation can raise living standards through trade, FDI, and technology transfer, but the benefits are not automatic or equally distributed.
- Low-income countries need complementary policies (infrastructure, education, governance) to realise gains.
- High-income countries face adjustment costs that can reduce the net benefit for some groups.
- Evaluation requires considering both sides and reaching a justified conclusion that addresses the specific claim of 'equally beneficial'.
- Measurement of living standards is multidimensional; GDP alone is insufficient.
Common Mistakes
- Discussing only one type of country (e.g., only low-income) – this caps the mark at L2.
- Presenting a one-sided argument (only benefits or only costs) – fails to evaluate.
- Concluding with a vague statement like 'it depends' without explaining what it depends on and which way the balance lies.
- Ignoring the word 'equally' – the question specifically asks about equal benefit, so the conclusion must address whether the effect is equal.
- Using generic examples without linking to the specific context of high-income vs low-income countries.
- Failing to define living standards or globalisation, losing knowledge marks.
Things to Be Careful About
- Ensure you discuss both high-income and low-income countries explicitly.
- Use economic terminology: comparative advantage, FDI, terms of trade, externalities, human development index.
- Develop chains of reasoning: explain how trade leads to higher incomes, which can improve health and education, etc.
- In evaluation, weigh the arguments using criteria such as time period, institutional quality, and distribution of gains.
- The conclusion must be justified: state which side is stronger and why, and directly answer whether the statement is valid.
- No diagram is required, but if you choose to include one (e.g., a diagram showing gains from trade), ensure it is fully explained. The mark scheme does not mention a diagram, so it is optional but not necessary.