Economics 9708/34 — May/June 2025
Cambridge A-Level · A Level Multiple Choice · answer key with instant marking and worked solutions
Topics Externalities, Social Costs and Benefits · Balance of Payments and Policies to Correct Disequilibrium · Government Policies to Correct Market Failure · Money and Banking · Macroeconomic Objectives and Policy Conflicts · Exchange Rate Systems · +11 more
Tap an option under each question to check it — your score builds as you go.
The diagram shows a consumer’s indifference curve (I1) for two goods, X and Y.
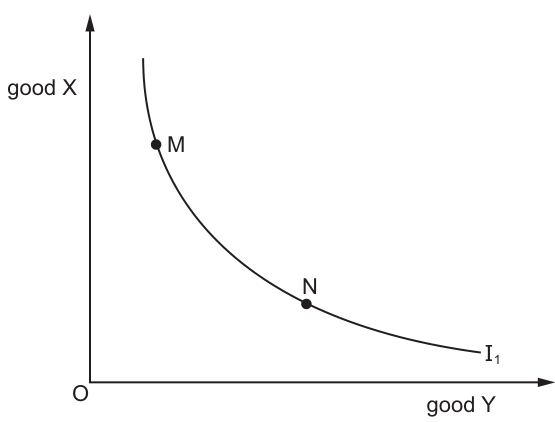
The consumer moves from point M to point N.
What happens to the consumer’s marginal utility and total utility as a result of this move?
Options
| marginal utility from good X | marginal utility from good Y | total utility | |
|---|---|---|---|
| A | decreases | increases | increases |
| B | decreases | decreases | unchanged |
| C | increases | decreases | unchanged |
| D | increases | unchanged | decreases |
Working
Moving from point M to point N along indifference curve I1, the consumer consumes less of good X and more of good Y. By the law of diminishing marginal utility, as the quantity of good X consumed falls, its marginal utility increases; as the quantity of good Y consumed rises, its marginal utility decreases. Because both points lie on the same indifference curve, the consumer's total utility remains unchanged.
Answer
C
C
Background Concept
An indifference curve represents all combinations of two goods that provide a consumer with the same level of total utility (satisfaction). Consequently, any movement along a single indifference curve leaves total utility constant. The law of diminishing marginal utility states that as a consumer consumes more units of a good, the additional satisfaction (marginal utility) derived from each successive unit falls; conversely, as consumption of a good falls, its marginal utility rises.
Understanding the Question
The question presents an indifference curve I1 with good X on the vertical axis and good Y on the horizontal axis. Point M is located higher up and to the left, indicating a combination with more of good X and less of good Y. Point N is lower down and to the right, indicating less of good X and more of good Y. The consumer moves from M to N. The question asks what happens to the marginal utility from good X, the marginal utility from good Y, and total utility as a result of this move.
Approach
To answer this, apply two key principles: (1) the property of indifference curves that total utility is constant along the curve, and (2) the law of diminishing marginal utility, which determines how marginal utility changes when the quantity consumed of a good changes. Trace the change in quantities of X and Y from M to N, then infer the direction of change for each marginal utility.
Step-by-Step Reasoning
- Change in quantities: From M to N, the consumer moves down the vertical axis (less good X) and right along the horizontal axis (more good Y).
- Marginal utility from good X: Because the consumer now has less of good X, the marginal utility from X increases. If X were abundant at M, its MU was relatively low; with less X at N, each remaining unit is valued more highly.
- Marginal utility from good Y: Because the consumer now has more of good Y, the marginal utility from Y decreases. Additional units of Y yield less extra satisfaction than the smaller quantity at M.
- Total utility: Both M and N lie on the same indifference curve I1. By definition, every point on a given indifference curve yields the same total utility. Therefore, total utility is unchanged.
- Matching the option: The changes are: MU from X increases, MU from Y decreases, total utility unchanged. This corresponds to option C.
Key Takeaways
- A movement along a single indifference curve does not change total utility; it only changes the combination of goods.
- The law of diminishing marginal utility works in both directions: more consumption lowers MU, less consumption raises MU.
- When reading indifference curve diagrams, always note which good is on which axis to determine whether a movement represents an increase or decrease in that good's quantity.
Common Mistakes
- Confusing a movement along an indifference curve with a shift to a higher or lower curve. A shift would change total utility; a movement along the curve does not.
- Reversing the direction of change in marginal utility, for example thinking that more of good Y increases its marginal utility.
- Ignoring the axis labels and assuming the standard X-horizontal/Y-vertical convention without checking the diagram.
- Selecting options where total utility changes, which contradicts the definition of an indifference curve.
Things to Be Careful About
- Verify the axis labels: in this diagram good X is on the vertical axis and good Y is on the horizontal axis, so moving from M to N means less X and more Y.
- Ensure the final answer addresses all three components asked: marginal utility from X, marginal utility from Y, and total utility.
- Remember that marginal utility is a flow concept related to the next unit consumed, so it responds to the change in the quantity held.
What is the most likely combination of circumstances leading to a good being under-consumed?
Options
| the good is a demerit good | there are external benefits in consumption | |
|---|---|---|
| A | no | no |
| B | no | yes |
| C | yes | yes |
| D | yes | no |
Reasoning
A good is under-consumed when the free market produces less than the socially optimal quantity. This occurs when there are positive externalities in consumption (external benefits), because the marginal social benefit (MSB) exceeds the marginal private benefit (MPB). The market, based only on private benefits, under-provides the good.
A demerit good, by contrast, is over-consumed because consumers are unaware of or ignore the full private costs, leading to negative externalities in consumption.
Therefore, the correct combination is: the good is NOT a demerit good, and there ARE external benefits in consumption.
Answer
B
B
Background Concept
This question tests your understanding of two distinct types of market failure related to consumption: demerit goods and goods with positive externalities (often called merit goods).
- Demerit good: A good that is over-consumed if left to the free market because consumers have imperfect information about its true private costs. Examples include cigarettes and alcohol. The consumption of a demerit good creates negative externalities (harm to third parties), but the core reason for over-consumption is the information failure about private costs. The market outcome is a quantity greater than the socially optimal level.
- Good with positive externalities (Merit good): A good that is under-consumed if left to the free market because consumers only consider their own private benefits and ignore the external benefits their consumption provides to others. Examples include education and vaccinations. The market outcome is a quantity less than the socially optimal level.
Understanding the Question
The question asks for the 'most likely combination of circumstances leading to a good being under-consumed'. It presents a table with two conditions: whether the good is a demerit good, and whether there are external benefits in consumption. You must select the row (A, B, C, or D) that correctly describes the circumstances that cause under-consumption.
Approach
- Recall the definition and market outcome for a demerit good (over-consumed).
- Recall the definition and market outcome for a good with positive externalities (under-consumed).
- Identify the row in the table that matches the conditions for under-consumption: the good is NOT a demerit good, and there ARE external benefits.
Step-by-Step Reasoning
-
Analyse the first condition: 'the good is a demerit good'.
- A demerit good is over-consumed by the market. The question asks for the circumstances leading to under-consumption. Therefore, for a good to be under-consumed, it cannot be a demerit good. The answer must have 'no' in the first column.
-
Analyse the second condition: 'there are external benefits in consumption'.
- External benefits in consumption mean that the social benefit of consuming the good is greater than the private benefit. The free market, which only considers private benefits, will therefore produce and consume too little of the good. This is the definition of under-consumption. The answer must have 'yes' in the second column.
-
Match the conditions to the table.
- The correct combination is: 'no' for demerit good, and 'yes' for external benefits. This corresponds to option B.
Key Takeaways
- Demerit goods are associated with over-consumption due to information failure about private costs.
- Goods with positive externalities (merit goods) are associated with under-consumption due to the divergence between private and social benefits.
- It is crucial to link the type of market failure (positive or negative externality, information failure) to the specific market outcome (over- or under-consumption/production).
Common Mistakes
- Confusing demerit goods with goods that have positive externalities. A common error is to think that because a good is 'good for you' (like education), it is a 'merit good' and therefore over-consumed. The key is the source of the market failure. Education is under-consumed because of positive externalities, not because it is a demerit good.
- Selecting option C (yes, yes). A student might incorrectly think that a demerit good is under-consumed because it is 'bad', or they might confuse the two concepts. A demerit good is over-consumed, so this combination is incorrect.
- Selecting option D (yes, no). This describes a demerit good with no external benefits, which leads to over-consumption, not under-consumption.
Things to Be Careful About
- Read the question carefully: it asks for the circumstances leading to under-consumption, not over-consumption.
- Distinguish clearly between the cause of the market failure. For demerit goods, the failure is imperfect information about private costs. For goods with positive externalities, the failure is the divergence between private and social benefits.
- The table format requires you to evaluate both conditions simultaneously. Do not just look for one condition; check that both match the required outcome.
Why does the lack of property rights cause an inefficient allocation of resources?
Options
A Scarce resources are depleted because the owner has sold them too cheaply.
B Scarce resources are depleted because they had zero cost to the users.
C Scarce resources are under-allocated to the provision of demerit goods.
D Scarce resources are under-allocated to the provision of merit goods.
Reasoning
When property rights are absent, no one owns the resource, so users face zero private cost for using it. They will consume the resource until the marginal private benefit equals zero, ignoring the marginal social cost of depletion. This leads to overuse and depletion of the scarce resource, which is an inefficient allocation because the social cost exceeds the private benefit at the equilibrium. Option B correctly states that scarce resources are depleted because they had zero cost to the users.
Answer
B
B
Background Concept
Property rights are legal rights to own, use, and dispose of resources. When property rights are well-defined and enforced, owners have an incentive to use resources efficiently because they bear the full costs and reap the full benefits. In the absence of property rights, resources become common property – non-excludable but rivalrous. This leads to the 'tragedy of the commons', where individuals acting in their own self-interest overuse the resource, depleting it and causing a market failure. The inefficiency arises because the private cost of using the resource is zero (users do not pay for it), while the social cost (the depletion and future scarcity) is positive. The market fails to allocate the resource efficiently because the price mechanism does not reflect the true scarcity.
Understanding the Question
The question asks: 'Why does the lack of property rights cause an inefficient allocation of resources?' It is a multiple-choice question with four options. The correct answer must identify the mechanism through which the absence of property rights leads to inefficiency. The key is to recognise that without property rights, users face zero cost, so they consume too much of the resource, depleting it. Options A, C, and D describe other scenarios that are not directly caused by a lack of property rights.
Approach
First, recall the definition of market failure: a situation where the free market does not allocate resources efficiently. One cause is the absence of property rights, which leads to overuse of common resources. Evaluate each option against this reasoning:
- Option A: 'Scarce resources are depleted because the owner has sold them too cheaply.' This implies there is an owner, but with no property rights there is no owner. So this is incorrect.
- Option B: 'Scarce resources are depleted because they had zero cost to the users.' This matches the tragedy of the commons: users face zero private cost, so they overuse the resource. This is correct.
- Option C: 'Scarce resources are under-allocated to the provision of demerit goods.' Demerit goods are over-consumed, not under-allocated, and the issue is not directly about property rights.
- Option D: 'Scarce resources are under-allocated to the provision of merit goods.' Merit goods are under-consumed due to positive externalities, but again this is not about property rights.
Thus, B is the only option that correctly identifies the causal link.
Step-by-Step Reasoning
- Identify the core concept: Lack of property rights means no one owns the resource. Therefore, anyone can use it without paying. The resource is non-excludable.
- Private cost vs social cost: The user's private cost of using an additional unit is zero (no payment). The social cost includes the depletion of the resource and the future loss to society. Because the private cost is zero, users will consume until the marginal private benefit is zero, which is far beyond the socially optimal level where marginal social benefit equals marginal social cost.
- Result: Overuse and depletion of the scarce resource. This is an inefficient allocation because the resource is used more than is socially desirable.
- Evaluate options:
- A: Incorrect because there is no owner to sell the resource. The phrase 'sold too cheaply' implies a market transaction, but without property rights there is no sale.
- B: Correct. Zero cost to users leads to overuse.
- C: Incorrect. Demerit goods (e.g., cigarettes) are over-consumed, not under-allocated. Also, the lack of property rights is not the primary reason for demerit good overconsumption; that is due to information failure or negative externalities.
- D: Incorrect. Merit goods (e.g., education) are under-consumed due to positive externalities, but again not directly caused by lack of property rights.
- Conclusion: Option B is the correct answer.
Key Takeaways
- Property rights are essential for efficient resource allocation because they align private costs with social costs.
- The absence of property rights leads to the tragedy of the commons: overuse and depletion of common resources.
- Market failure occurs when the price mechanism does not reflect true scarcity, often due to externalities or lack of property rights.
- In multiple-choice questions, carefully distinguish between the cause and effect described in each option.
Common Mistakes
- Choosing option A because it mentions 'sold too cheaply', but failing to notice that without property rights there is no owner to sell.
- Confusing the overuse of common resources with under-allocation to merit or demerit goods. The question is specifically about property rights, not about public goods or externalities from consumption.
- Thinking that 'zero cost' means the resource is free and therefore not scarce, but the question states it is scarce, so zero cost leads to depletion.
Things to Be Careful About
- Read the question carefully: it asks 'why does the lack of property rights cause an inefficient allocation?' Focus on the causal mechanism.
- Remember that 'inefficient allocation' means the resource is either overused or underused relative to the social optimum. Here it is overused.
- In multiple-choice, eliminate options that introduce irrelevant concepts (like demerit/merit goods) or that contradict the premise (like an owner selling).
A cost–benefit analysis is carried out on the construction of a hydroelectric power station.
Under which circumstances would the scheme be most likely to be approved?
Options
A Private benefits are greater than private costs.
B Social benefits are greater than social costs.
C Social benefits are greater than external costs.
D External costs are greater than external benefits.
Reasoning
A cost-benefit analysis evaluates a project from the perspective of society as a whole, not just private individuals. The scheme should be approved if the total benefits to society (social benefits) exceed the total costs to society (social costs). Private benefits and costs ignore externalities, so they are not the correct criterion. External costs and benefits alone are insufficient; the net social benefit must be positive.
Answer
B
B
Background Concept
Cost-benefit analysis (CBA) is a systematic process used by governments and public bodies to evaluate the desirability of a project or policy by comparing its total social benefits with its total social costs. Social benefits include all private benefits (e.g., revenue from electricity sales) plus any positive externalities (e.g., reduced pollution from replacing fossil fuels). Social costs include all private costs (e.g., construction and operating costs) plus any negative externalities (e.g., environmental damage from flooding land). The fundamental rule of CBA is that a project should be undertaken if the net social benefit (social benefits minus social costs) is positive, i.e., social benefits > social costs.
Understanding the Question
The question asks under which circumstance a hydroelectric power station would be most likely to be approved based on a cost-benefit analysis. The four options present different comparisons of benefits and costs, some private, some social, some external. The key is to recognise that CBA uses social (total) values, not just private or external components.
Approach
Identify the correct criterion for approval in CBA: social benefits > social costs. Then evaluate each option against this criterion. Option B directly matches. Options A, C, and D are incorrect because they either use only private values or compare incomplete categories (e.g., social benefits vs external costs).
Step-by-Step Reasoning
-
Option A: Private benefits > private costs. This is the condition for a private firm to undertake a project, but it ignores externalities. A hydroelectric station may have large negative externalities (e.g., ecosystem disruption) that make social costs exceed social benefits even if private benefits exceed private costs. So this is not sufficient for social approval.
-
Option B: Social benefits > social costs. This is the exact condition used in cost-benefit analysis. It accounts for all benefits and costs to society, including externalities. If this holds, the project increases social welfare and should be approved. This is correct.
-
Option C: Social benefits > external costs. This compares total social benefits with only the negative externalities, ignoring private costs. Even if social benefits exceed external costs, private costs could be so large that total social costs exceed social benefits. So this is not the correct criterion.
-
Option D: External costs > external benefits. This would imply that negative externalities outweigh positive externalities, but it ignores private benefits and costs. A project could still have positive net social benefit if private benefits are large enough. Moreover, this condition would suggest the project should be rejected, not approved. So it is incorrect.
Therefore, only option B correctly states the condition for approval in a cost-benefit analysis.
Key Takeaways
- Cost-benefit analysis uses social (total) costs and benefits, including externalities.
- The approval condition is social benefits > social costs (positive net social benefit).
- Private costs and benefits alone are insufficient for public project evaluation.
- External costs and benefits are components, not the whole picture.
Common Mistakes
- Confusing private with social costs/benefits. Students may think that if a project is profitable privately, it should be approved, ignoring externalities.
- Thinking that social benefits > external costs is sufficient, forgetting that private costs are part of social costs.
- Misinterpreting external costs > external benefits as a reason for approval, when it actually suggests rejection.
Things to Be Careful About
- Always distinguish between private, external, and social values.
- Remember that cost-benefit analysis is a social welfare tool, not a private profit calculation.
- The condition for approval is net social benefit positive, not just any partial comparison.
Which type of market structure enables price leadership to take place?
Options
A monopolistic competition
B oligopoly
C perfect competition
D pure monopoly
Answer
Price leadership occurs when one firm sets a price and other firms follow. This behaviour is characteristic of an oligopoly, where there are few firms and interdependence is high. In perfect competition and monopolistic competition, firms are price takers or have limited market power. In pure monopoly, there is only one firm, so no price leadership is needed. Therefore, the correct answer is B.
B
Background Concept
Price leadership is a form of tacit collusion in which one firm (the leader) sets a price and other firms (followers) adopt the same price. It is most common in oligopolistic markets, where a small number of large firms dominate and each firm's pricing decisions affect the others. The leader is often the largest or most efficient firm, and followers match the price to avoid price wars and maintain stable profits.
Understanding the Question
The question asks which market structure enables price leadership. The options are monopolistic competition, oligopoly, perfect competition, and pure monopoly. The key is to recall the defining features of each market structure and whether price leadership is feasible or typical.
Approach
Consider each market structure in turn:
- Perfect competition: many small firms, homogeneous product, price takers – no firm can set a price, so no price leadership.
- Monopolistic competition: many firms, differentiated products, some price-setting power but low barriers to entry and many competitors – price leadership is not typical because firms have some independence and there are too many firms to coordinate.
- Oligopoly: few large firms, high interdependence, barriers to entry – price leadership is a common form of tacit collusion.
- Pure monopoly: single firm, no competitors – price leadership is meaningless because there is no one to follow.
Thus, oligopoly is the correct answer.
Step-by-Step Reasoning
- Define price leadership: A situation where one firm in an industry sets a price and other firms follow, either explicitly or implicitly. It is a way to avoid price competition and maintain industry profits.
- Analyse each option:
- Perfect competition: Firms are price takers; they cannot set prices. Price leadership cannot occur.
- Monopolistic competition: Firms have some control over price due to product differentiation, but there are many firms and low barriers to entry. Price leadership is not a typical feature because firms compete on product variety and advertising, and coordination is difficult with many players.
- Oligopoly: Few firms, high barriers to entry, and mutual interdependence. Price leadership is a common strategy to avoid price wars and achieve stable prices. The leader's price is often accepted by others to maintain market share.
- Pure monopoly: Only one firm, so there is no other firm to follow. Price leadership is irrelevant.
- Conclusion: Only oligopoly enables price leadership.
Key Takeaways
- Price leadership is a form of tacit collusion in oligopoly.
- It requires a small number of firms and interdependence.
- Other market structures either have too many firms (perfect competition, monopolistic competition) or only one firm (monopoly) for price leadership to occur.
Common Mistakes
- Confusing price leadership with price discrimination or price taking.
- Thinking that monopolistic competition allows price leadership because firms have some market power – but the large number of firms prevents effective coordination.
- Assuming that a monopoly can have price leadership (it cannot, as there is no follower).
Things to Be Careful About
- Price leadership is not the same as price fixing (explicit collusion). It is often tacit and legal in many jurisdictions.
- In oligopoly, price leadership can be dominant-firm leadership or barometric leadership. The question does not require distinguishing these, but it is useful context.
- Remember that the key characteristic enabling price leadership is the small number of firms and high interdependence.
The tables show the market share of the five largest firms in two separate industries.
industry X
| firm | market share % |
|---|---|
| E | 32 |
| F | 26 |
| G | 22 |
| H | 10 |
| J | 5 |
industry Z
| firm | market share % |
|---|---|
| L | 17 |
| M | 15 |
| N | 14 |
| P | 12 |
| R | 6 |
What does this data suggest is most likely?
Options
A Industry X is highly contestable.
B Industry X is oligopolistic.
C Industry Z has a lower level of output than industry X.
D Industry Z is less competitive than industry X.
Answer
Industry X has a 5-firm concentration ratio of 32 + 26 + 22 + 10 + 5 = 95%. This is very high, indicating that the industry is dominated by a few large firms, which is characteristic of an oligopoly. Option B is correct.
Industry Z has a 5-firm concentration ratio of 17 + 15 + 14 + 12 + 6 = 64%, which is lower, suggesting a more competitive structure. A high concentration ratio does not imply low contestability (A is not necessarily true), and the data gives no information about the absolute level of output (C). A lower concentration ratio suggests more competition, not less (D is the opposite of what the data shows).
B
Background Concept
A concentration ratio measures the combined market share of the largest firms in an industry. It is a key indicator of market structure. A high concentration ratio (e.g., above 60% for the top 5 firms) suggests an oligopoly, where a few firms dominate the market. A very low ratio suggests a more competitive market, possibly approaching perfect competition. Contestability, on the other hand, refers to the ease with which new firms can enter and exit the market, which is not directly measured by the concentration ratio.
Understanding the Question
The question provides market share data for the five largest firms in two industries, X and Z. It asks what the data most likely suggests. The options are about contestability, oligopoly, relative output levels, and relative competitiveness. The task is to calculate the concentration ratio for each industry and then interpret it correctly.
Approach
- Calculate the 5-firm concentration ratio for each industry by summing the market shares of the five largest firms.
- Compare the ratios to the typical thresholds for market structures.
- Evaluate each option against the calculated ratios and the economic concepts.
Step-by-Step Reasoning
Step 1: Calculate the concentration ratio for Industry X
Firms: E (32%), F (26%), G (22%), H (10%), J (5%)
5-firm concentration ratio = 32 + 26 + 22 + 10 + 5 = 95%
This is extremely high. The top 5 firms control 95% of the market, leaving only 5% for all other firms. This is a classic oligopoly structure.
Step 2: Calculate the concentration ratio for Industry Z
Firms: L (17%), M (15%), N (14%), P (12%), R (6%)
5-firm concentration ratio = 17 + 15 + 14 + 12 + 6 = 64%
This is moderately high. The top 5 firms control 64% of the market. This could still be an oligopoly, but it is less concentrated than Industry X and leaves more room for smaller competitors.
Step 3: Evaluate each option
Option A: Industry X is highly contestable.
Contestability depends on barriers to entry and exit, not on the current market shares. A high concentration ratio does not imply low contestability; in fact, oligopolies often have high barriers to entry. The data gives no information about barriers, so this cannot be concluded. Incorrect.
Option B: Industry X is oligopolistic.
With a 95% concentration ratio, the industry is dominated by a few large firms. This is the defining characteristic of an oligopoly. Correct.
Option C: Industry Z has a lower level of output than industry X.
The data shows market shares, not absolute output. Industry Z could have a much larger total market size, so its 64% could represent a larger absolute output than Industry X's 95%. No conclusion about output levels can be drawn. Incorrect.
Option D: Industry Z is less competitive than industry X.
A lower concentration ratio (64% vs 95%) suggests that Industry Z is more competitive, not less. A lower ratio means the market is less dominated by the top firms, implying more competition. Incorrect.
Key Takeaways
- A concentration ratio is a simple but powerful tool for identifying market structure.
- A high concentration ratio (e.g., >60% for 5 firms) typically indicates an oligopoly.
- Contestability is a separate concept from concentration; a concentrated market can still be contestable if barriers to entry are low.
- Market share data alone cannot be used to compare absolute output levels between industries.
Common Mistakes
- Confusing a high concentration ratio with low contestability. The two are not directly linked.
- Assuming that a lower concentration ratio means less competition. The opposite is generally true.
- Trying to compare absolute output from market share percentages without knowing the total market size.
Things to Be Careful About
- Always calculate the concentration ratio before interpreting the data.
- Read each option carefully and check it against the calculated ratio and the relevant economic concept.
- Remember that market structure is about the number and size distribution of firms, not about the absolute level of output.
The diagram shows the private and social marginal costs and benefits of a manufacturer.
The current equilibrium is at point R.
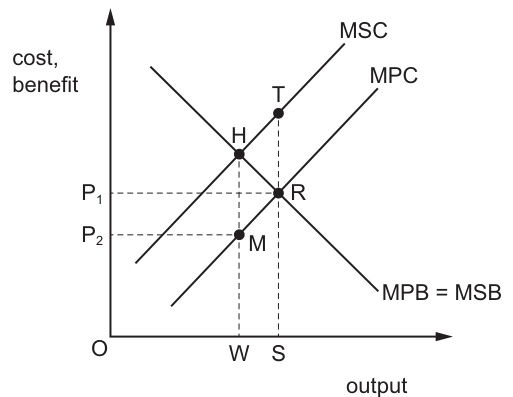
What should the government do to improve allocative efficiency and produce at the socially optimal level of output?
Options
A introduce a subsidy TR
B introduce a specific tax HM
C set a maximum price of OP1
D set a minimum price of OP2
Reasoning
The diagram shows MSC (marginal social cost) above MPC (marginal private cost), meaning there is a negative externality of production: the marginal external cost (MEC) is the vertical gap between MSC and MPC. The market equilibrium is at point R, where MPC = MPB, giving output S. This is higher than the socially optimal output W, where MSC = MSB (point H), so the market overproduces relative to the allocatively efficient level.
To achieve the socially optimal output, the government must internalize the externality by imposing a specific tax equal to the MEC per unit. This tax raises the MPC to align with MSC, shifting the market equilibrium to point H (output W). The MEC equals the vertical distance HM (or TR, as the curves are parallel), so a tax of HM is correct.
Evaluating the options:
- A subsidy TR would lower MPC, increasing output further above W, worsening the overproduction.
- A maximum price of P1 is already the market equilibrium price, so it has no effect.
- A minimum price of P2 is below the equilibrium price P1, so it is not binding and will not change output.
Answer
B
B
Background Concept
A negative externality of production occurs when the production of a good imposes unaccounted costs on third parties not involved in the transaction. These external costs mean that the marginal social cost (MSC) of production is higher than the marginal private cost (MPC) faced by producers: MSC = MPC + MEC, where MEC is marginal external cost.
In an unregulated market, producers only consider their private costs, so equilibrium occurs where MPC = marginal private benefit (MPB), at output S in the diagram. This market equilibrium is allocatively inefficient because it overproduces the good: every unit between W and S has a social cost higher than its social benefit, creating deadweight welfare loss.
Allocative efficiency is achieved at the output where MSC = MSB (marginal social benefit), which is output W in the diagram. To reach this outcome, the government must internalize the externality — make producers face the full social cost of their actions. The standard policy tool for a negative production externality is a Pigouvian tax: a specific tax set equal to the MEC per unit of output. This tax shifts the MPC curve upward by the amount of the tax, so the new effective MPC (MPC + tax) aligns with MSC, leading the market to the socially optimal equilibrium at point H.
Understanding the Question
The question provides a diagram of a manufacturer's marginal costs and benefits, with the current market equilibrium at point R (output S). It asks which government policy will improve allocative efficiency by moving production to the socially optimal level of output (point H, output W). The implicit command word requires you to apply your knowledge of externalities and government intervention to select the correct policy from the four options. The core of the question is identifying the type of market failure present, then matching it to the appropriate policy correction.
Approach
- First analyse the diagram to identify the type of externality by comparing the positions of MSC and MPC.
- Recall the standard government policy used to correct this type of externality and move the market to the socially optimal output.
- Match the correct policy to the options provided, eliminating incorrect choices by analysing their effect on the market equilibrium.
Step-by-Step Reasoning
Step 1: Identify the market failure
The diagram displays two upward-sloping cost curves: MPC (the private cost to the producer) and MSC (the total social cost, including external costs). Since MSC lies above MPC, there is a positive marginal external cost (MEC) of production: each unit produced imposes an extra cost on third parties (e.g. air pollution, noise disturbance) that the producer does not pay for. This is a negative externality of production.
The market equilibrium is at point R, where MPC = MPB (marginal private benefit, which equals marginal social benefit MSB as stated in the diagram). This gives an equilibrium output of S and price P1. However, the socially optimal output is where MSC = MSB, at point H, corresponding to output W. Since S > W, the unregulated market overproduces the good relative to the allocatively efficient level.
Step 2: Identify the correct policy
To move the market equilibrium from R to H, the government must make producers internalize the external cost. The standard tool for this is a specific (per-unit) Pigouvian tax set equal to the MEC. This tax adds to the producer's private cost, so the new effective MPC becomes MPC + tax. If the tax is set equal to the MEC, then MPC + tax = MSC, so the supply curve shifts upward to coincide with MSC. The new equilibrium is then at the intersection of the new supply curve (MSC) and the MPB curve, which is point H, at the socially optimal output W.
The MEC is the vertical distance between MSC and MPC. As the two cost curves are parallel, this distance is constant across all output levels. It is equal to the vertical gap between point T (on MSC at output S) and point R (on MPC at output S), which is the length TR. It is also equal to the vertical gap between point H (on MSC at output W) and point M (on MPC at output W), which is the length HM. So a tax of HM (or TR) per unit will achieve the desired outcome of moving production to W.
Step 3: Evaluate the options
- Option A (introduce a subsidy TR): A subsidy lowers the producer's private cost, shifting the MPC curve downward. This would increase output further above S, moving the equilibrium even further away from the socially optimal W. Subsidies are the correct policy for positive externalities (where MSB > MPB and the market underproduces), not negative externalities, so this option is incorrect.
- Option B (introduce a specific tax HM): As explained above, this tax equals the MEC, shifts the MPC curve up to align with MSC, and moves the market equilibrium to point H (output W), the socially optimal level. This is the correct policy.
- Option C (set a maximum price of P1): The current market equilibrium price is already P1, so setting a maximum price at this level has no effect on the market. Even if the price were higher, a price ceiling does not internalize the externality — it only caps the price consumers pay, which would create a shortage if binding, but does not alter the marginal cost or benefit faced by producers, so it cannot move the market to the allocatively efficient output. This option is incorrect.
- Option D (set a minimum price of P2): A minimum price (price floor) of P2 is below the current equilibrium price P1, so it is not binding. Producers will continue to charge the market price P1 and produce output S, so there is no change to the market outcome. This option is incorrect.
Key Takeaways
- A negative externality of production exists when MSC > MPC, leading to overproduction relative to the socially optimal level.
- A Pigouvian tax equal to the marginal external cost internalizes the externality by making producers face the full social cost of production, shifting the MPC curve up to MSC and restoring allocative efficiency.
- Price controls (price ceilings or floors) do not internalize externalities, as they do not alter the underlying marginal cost or benefit relationships between producers and consumers.
- Subsidies are used to correct positive externalities, where MSB > MPB and the market underproduces the good.
Common Mistakes
- Confusing the policy for negative vs positive externalities: A common error is to apply a subsidy to a negative externality, which would worsen overproduction, or a tax to a positive externality, which would reduce output further below the optimal level. Always match the policy to the type of externality: tax for negative (overproduction), subsidy for positive (underproduction).
- Misidentifying the correct tax amount: Some students may incorrectly select the subsidy TR, not realising that subsidies are for positive externalities, or confuse the MEC with the price difference between P1 and P2 rather than the vertical gap between the two cost curves.
- Assuming price controls can correct externalities: Price ceilings or floors only affect the market price, not the marginal costs and benefits that drive the market equilibrium, so they cannot resolve the inefficiency caused by externalities.
- Forgetting the definition of allocative efficiency: Allocative efficiency occurs where MSC = MSB, not where MPC = MPB. The market equilibrium is only allocatively efficient in the absence of externalities.
Things to Be Careful About
- Always check the direction of the gap between MSC and MPC: if MSC is above MPC, it is a negative production externality requiring a tax; if MPC is above MSC, it is a positive production externality requiring a subsidy.
- The tax must be equal to the MEC (the vertical gap between MSC and MPC), not the difference between the equilibrium price and the optimal price. While in this diagram HM equals the MEC, in other diagrams the tax is always the vertical distance between the two cost curves.
- Price controls are not a solution to externalities: they may be used to address other market failures such as monopoly power or merit/demerit goods, but they do not internalize external costs or benefits, so they cannot achieve allocative efficiency in this case.
- For 1-mark MCQs, use elimination to narrow down options: Option A is the opposite of the correct policy for a negative externality, while options C and D are price controls that have no effect on the externality, so B is the only valid choice.
A government wishes to discourage tax avoidance.
Which policy to achieve this would be an example of the behavioural approach of nudge theory?
Options
A compelling direct tax deduction by employers
B making random inspections of individual tax records
C providing information on how the tax is spent by the government
D using penalties such as fines and imprisonment for tax avoidance
Answer
Nudge theory involves altering the choice architecture to steer individuals towards a desired behaviour without removing their freedom of choice or using significant financial incentives or penalties. Option C — providing information on how tax is spent — is a nudge because it uses transparency to encourage voluntary compliance by appealing to taxpayers' sense of fairness or social norms, without compulsion or punishment. Options A, B and D rely on compulsion, surveillance or penalties, which are traditional regulatory or deterrent approaches, not nudges.
Answer
C
C
Background Concept
Nudge theory, popularised by Thaler and Sunstein, is a behavioural economics approach that aims to influence people's decisions by changing the 'choice architecture' — the context in which choices are presented. A nudge must be easy and cheap to avoid (i.e., it does not remove freedom of choice) and must not rely on significant financial incentives or penalties. Examples include default options, framing, social norms, and providing information in a salient way. This contrasts with traditional government interventions such as taxes, subsidies, bans, and regulations, which rely on compulsion or material incentives.
Understanding the Question
The question asks which of four policies to discourage tax avoidance is an example of nudge theory. Tax avoidance is the legal arrangement of finances to minimise tax liability (as opposed to illegal tax evasion). The government wants to reduce it. The four options represent different policy tools: A (compulsion by employers), B (random inspections — a deterrent), C (providing information on how tax is spent), and D (penalties). The task is to identify the one that fits the definition of a nudge.
Approach
First, recall the core features of a nudge: it preserves freedom of choice, does not use significant financial incentives or penalties, and works by changing the decision-making context. Then evaluate each option against these criteria. Options A, B, and D all involve compulsion, surveillance, or penalties — these are traditional regulatory or deterrent approaches, not nudges. Option C involves providing information, which can influence behaviour by appealing to social norms or a sense of fairness, without removing choice. Therefore, C is the correct answer.
Step-by-Step Reasoning
-
Define nudge theory: A nudge is a change in the choice architecture that predictably alters people's behaviour without forbidding any options or significantly changing their economic incentives. It must be easy and cheap to avoid.
-
Evaluate Option A: Compelling direct tax deduction by employers forces a behaviour (tax payment) and removes the individual's choice to arrange their own tax affairs. This is a command-and-control regulation, not a nudge.
-
Evaluate Option B: Random inspections of individual tax records increase the perceived risk of detection. This is a deterrent policy that relies on fear of punishment, not a nudge. It does not preserve freedom of choice in a meaningful way.
-
Evaluate Option C: Providing information on how tax is spent makes the benefits of tax compliance more salient. It may encourage voluntary compliance by appealing to taxpayers' sense of fairness, reciprocity, or social norms (e.g., 'most people pay their taxes'). It does not force anyone to pay more tax; it simply changes the information environment. This fits the definition of a nudge.
-
Evaluate Option D: Using penalties such as fines and imprisonment is a classic deterrent. It changes the cost-benefit calculation of tax avoidance by increasing the expected cost. This is a significant financial penalty and removes freedom of choice (or makes it very costly to choose avoidance). Not a nudge.
-
Conclusion: Only Option C is a nudge.
Key Takeaways
- Nudge theory is a distinct behavioural approach that relies on changing choice architecture, not on compulsion, significant incentives, or penalties.
- To identify a nudge, ask: does it preserve freedom of choice? Is it easy to avoid? Does it avoid large financial incentives or penalties?
- Common exam mistakes include confusing a nudge with any government policy that aims to change behaviour, or with simple information provision that is not a nudge (e.g., a warning label might be a nudge if it changes salience, but a ban is not).
Common Mistakes
- Confusing a nudge with any information campaign: Not all information provision is a nudge. For it to be a nudge, it must alter the choice architecture in a way that steers behaviour without removing choice. Option C works because it makes the social benefit salient, not because it simply informs.
- Thinking that any policy that is not a direct ban is a nudge: Option B (random inspections) is not a ban, but it is a deterrent, not a nudge.
- Overlooking the 'freedom of choice' criterion: Option A removes choice entirely, so it is clearly not a nudge.
Things to Be Careful About
- The question specifically asks about 'tax avoidance' (legal) not 'tax evasion' (illegal). The nudge approach is more relevant to legal avoidance because it aims to change voluntary behaviour.
- Remember that nudge theory is part of behavioural economics and is often contrasted with traditional 'rational actor' models that assume people respond only to incentives and information. A nudge works by exploiting cognitive biases (e.g., present bias, social norms).
- In multiple-choice questions, read all options carefully. The correct answer is often the one that is least coercive and most about changing the decision context.
What indicates that a more equal distribution of income has been achieved?
Options
A a faster rate of economic growth
B a higher Human Development Index
C a lower Gini coefficient
D a lower tax/GDP ratio
Answer
The Gini coefficient measures the extent to which the distribution of income (or consumption expenditure) among individuals or households within an economy deviates from a perfectly equal distribution. A coefficient of 0 represents perfect equality, while a coefficient of 1 (or 100%) represents perfect inequality. Therefore, a lower Gini coefficient indicates that income is more equally distributed.
Answer
C
C
Background Concept
The Gini coefficient is a statistical measure of inequality, most commonly used to measure income or wealth inequality within a population. It is derived from the Lorenz curve, which plots the cumulative percentage of total income received against the cumulative percentage of the population, ranked from poorest to richest. The Gini coefficient is the ratio of the area between the line of perfect equality (the 45-degree line) and the Lorenz curve, divided by the total area under the line of perfect equality. A value of 0 means everyone has the same income (perfect equality), and a value of 1 (or 100%) means one person has all the income (perfect inequality).
Understanding the Question
The question asks which of four options indicates that a more equal distribution of income has been achieved. This is a straightforward definitional question. The key is to know which economic indicator directly measures income inequality. The options are: a faster rate of economic growth (A), a higher Human Development Index (B), a lower Gini coefficient (C), and a lower tax/GDP ratio (D). Only one of these is a direct measure of income distribution.
Approach
- Recall the definition of each option.
- Identify which one is specifically designed to measure income inequality.
- Eliminate the others as they measure different concepts.
Step-by-Step Reasoning
-
Option A: a faster rate of economic growth. Economic growth is an increase in the total output of an economy (GDP). It does not directly tell us how that output is shared among the population. Growth could be accompanied by rising inequality (e.g., the benefits go mainly to the rich) or falling inequality. So, a faster growth rate does not necessarily mean a more equal distribution.
-
Option B: a higher Human Development Index (HDI). The HDI is a composite index of life expectancy, education, and per capita income. It measures average achievement in key dimensions of human development, not how those achievements are distributed. A country could have a high HDI but high inequality (e.g., a country with a very rich elite and a poor majority). So, a higher HDI does not guarantee a more equal income distribution.
-
Option C: a lower Gini coefficient. The Gini coefficient is the standard measure of income inequality. A lower value means the Lorenz curve is closer to the line of perfect equality, indicating a more equal distribution. This is the direct and correct answer.
-
Option D: a lower tax/GDP ratio. This ratio measures the size of the government's tax revenue relative to the size of the economy. A lower ratio means the government collects less tax. This has no direct relationship with income equality. A government could have a low tax/GDP ratio and still have a very unequal distribution (e.g., a low-tax, low-redistribution economy). Conversely, a high tax/GDP ratio could be used to fund redistribution, but the ratio itself does not measure the outcome.
Key Takeaways
- The Gini coefficient is the primary statistical measure of income or wealth inequality.
- A lower Gini coefficient means a more equal distribution; a higher coefficient means a more unequal distribution.
- It is important to distinguish between indicators of average well-being (like GDP per capita or HDI) and indicators of distribution (like the Gini coefficient).
Common Mistakes
- Confusing the Gini coefficient with other development indicators. A student might think a higher HDI or faster growth implies less inequality, but this is not necessarily true.
- Misremembering the direction of the Gini coefficient: thinking a higher value means more equality, which is the opposite of the truth.
Things to Be Careful About
- The Gini coefficient is a measure of relative inequality, not absolute poverty. A country could have a low Gini coefficient (more equal) but still have widespread absolute poverty if the average income is very low.
- The question asks for what indicates a more equal distribution has been achieved. The Gini coefficient is the direct indicator. Other options may be correlated with equality in some contexts, but they are not direct measures.
Which policy by a government would increase the negative externalities that result from cigarette smoking?
Options
A a ban on cigarette advertising
B a ban on cigarette smoking in public places
C a ban on substitutes for cigarettes
D a ban on the sale of cigarettes
Answer
A ban on substitutes for cigarettes (option C) would remove the availability of alternatives such as e-cigarettes or nicotine patches. This would force consumers who would otherwise switch to substitutes to continue smoking, thereby increasing the quantity of cigarettes consumed and the associated negative externalities (e.g., harm from second-hand smoke, healthcare costs). The other options (A, B, D) all reduce either the demand for or the supply of cigarettes, which would decrease the negative externalities.
C
Background Concept
A negative externality is a cost imposed on a third party who is not directly involved in a transaction. Cigarette smoking generates negative externalities of consumption: the smoker's private benefit is less than the social benefit because non-smokers suffer from second-hand smoke, and the social cost exceeds the private cost due to healthcare burdens and lost productivity. Policies that reduce the quantity of cigarettes consumed (e.g., advertising bans, smoking bans in public places, or outright sales bans) reduce these externalities. Conversely, a policy that increases consumption or removes alternatives that would otherwise reduce consumption will increase the negative externalities.
Understanding the Question
The question asks which government policy would increase the negative externalities from cigarette smoking. This is a subtle twist: most policies aim to reduce externalities, so the candidate must identify the one option that would have the opposite effect. The four options are all bans, but they target different things: advertising, public smoking, substitutes, and sales. The key is to recognise that banning substitutes removes a way for smokers to reduce their consumption or quit, thereby keeping the quantity of cigarettes higher than it would otherwise be.
Approach
Evaluate each option in turn:
- A ban on advertising reduces demand, lowering consumption and externalities.
- A ban on smoking in public places reduces the externality directly by limiting exposure.
- A ban on substitutes removes alternatives, potentially increasing cigarette consumption.
- A ban on sales eliminates the legal market, drastically reducing consumption.
Only option C would increase the negative externality.
Step-by-Step Reasoning
-
Option A – Ban on cigarette advertising: Advertising increases demand. Banning it reduces demand, shifting the demand curve for cigarettes leftwards. The equilibrium quantity falls, reducing the total negative externality. This decreases, not increases, externalities.
-
Option B – Ban on smoking in public places: This directly reduces the negative externality of second-hand smoke by restricting where smoking can occur. It also may reduce the social acceptability of smoking, further lowering demand. Again, externalities decrease.
-
Option C – Ban on substitutes for cigarettes: Substitutes such as e-cigarettes, nicotine gum, or patches allow smokers to reduce their cigarette consumption or quit. If these substitutes are banned, smokers who would have switched to them are forced to continue smoking. The quantity of cigarettes consumed is higher than it would be with substitutes available, so the negative externalities (second-hand smoke, healthcare costs) increase. This is the correct answer.
-
Option D – Ban on the sale of cigarettes: This eliminates the legal supply of cigarettes. While an illegal market might emerge, the overall quantity consumed would fall dramatically, reducing externalities. This decreases externalities.
Key Takeaways
- Policies can either increase or decrease externalities; the question tests the ability to identify the direction of the effect.
- Banning substitutes removes a harm-reduction option, potentially increasing the original harmful activity.
- Always consider the indirect effects of a policy: removing alternatives can have unintended consequences.
Common Mistakes
- Choosing option A, B, or D because they are commonly associated with reducing smoking, without reading the question carefully (it asks for an increase).
- Misunderstanding that a ban on substitutes would reduce smoking (it actually removes a way to reduce it).
- Failing to distinguish between reducing the externality directly (e.g., public smoking ban) and reducing it indirectly (e.g., advertising ban).
Things to Be Careful About
- Read the question precisely: "increase the negative externalities" is the opposite of the usual policy goal.
- Consider the mechanism: a ban on substitutes does not directly affect cigarettes but changes consumer behaviour by removing alternatives.
- Do not assume all bans are aimed at reducing harm; some may inadvertently increase it.
What determines the amount by which employment is reduced if a minimum wage is set 5% above the equilibrium market wage?
Options
A the average revenue product curve
B the marginal revenue product curve
C the mobility of labour
D the wage rate in other industries
Reasoning
A minimum wage set above the equilibrium wage creates a situation where the wage exceeds the value of the marginal product of labour for the last worker employed. The reduction in employment is determined by how much the quantity of labour demanded falls as the wage rises along the firm's labour demand curve. In a competitive labour market, the firm's labour demand curve is the downward-sloping section of its marginal revenue product (MRP) curve. Therefore, it is the MRP curve that determines the extent of the employment reduction.
Answer
B
B
Background Concept
In a perfectly competitive labour market, a firm hires workers up to the point where the wage rate equals the marginal revenue product (MRP) of labour. The MRP is the extra revenue generated by employing one more unit of labour, calculated as MRP = MPP × MR. The labour demand curve for a competitive firm is derived from its MRP curve and slopes downward because the marginal physical product (MPP) of labour diminishes as more workers are hired. The market labour demand curve is the horizontal sum of individual firms' MRP curves.
Understanding the Question
The question asks: When the government imposes a minimum wage that is 5% above the equilibrium wage, what factor determines by how much employment falls? The minimum wage acts as a price floor, setting the wage above the market-clearing level. At this higher wage, firms will reduce their hiring along their labour demand curve. The key is to identify which of the given options directly defines the shape and position of that labour demand curve.
Approach
The reduction in employment following a minimum wage is a movement along the labour demand curve. Therefore, the determinant of the size of the employment fall is whatever determines the slope and position of the labour demand curve. Among the options, only one directly constitutes the labour demand curve itself.
Step-by-Step Reasoning
- Option A: The average revenue product (ARP) curve – The ARP curve shows revenue per worker, not the marginal contribution. A profit-maximising firm hires labour up to the point where the wage equals MRP, not ARP. The ARP curve may be relevant to the shutdown condition (a firm will exit if wage > ARP), but it does not determine how employment changes as wage rises above the equilibrium.
- Option B: The marginal revenue product (MRP) curve – Correct. In a competitive labour market, the firm's labour demand curve is the downward-sloping portion of its MRP curve. When a minimum wage is set above the equilibrium, the firm moves up along its MRP curve, and the reduction in employment is read off the MRP curve at the new, higher wage.
- Option C: The mobility of labour – Labour mobility would affect the supply curve of labour, not the demand curve. The reduction in employment from a minimum wage is determined by the demand side (firms' willingness to hire), not by workers' ability to move between jobs or locations.
- Option D: The wage rate in other industries – This influences the labour supply curve as workers compare wages across industries. If wages are higher in other industries, the supply of labour to the affected industry may be more elastic, but this does not determine the demand-side response to a minimum wage.
Thus, the correct answer is B.
Key Takeaways
- The labour demand curve for a profit-maximising firm in a competitive market is its MRP curve.
- A minimum wage above equilibrium causes a movement up along the labour demand curve, reducing employment.
- The extent of the reduction depends on the elasticity of the MRP/labour demand curve, not on supply-side factors or average revenue.
Common Mistakes
- Confusing the average revenue product with the marginal revenue product. Since profit maximisation occurs where MRP = wage, it is the MRP curve that matters.
- Focusing on labour supply factors (mobility, wages elsewhere) when the question asks about the determinant of the employment fall, which is a demand-side issue.
Things to Be Careful About
- The question specifies a minimum wage set 5% above the equilibrium. The percentage above is arbitrary – the key principle is that the reduction is determined by the slope of the demand curve (MRP), so any value above equilibrium would still make B the correct answer.
- Distinguish carefully between factors that shift the labour demand curve (e.g., changes in productivity, product demand) and factors that determine the shape along which firms adjust (the MRP curve itself).
What will increase the power of a trade union, allowing it to increase wages without reducing the employment of its members in a particular industry?
Options
A The economy is experiencing a fall in the price of capital.
B The economy is experiencing rising employment.
C The price elasticity of demand for the industry’s goods is equal to 1.
D The price elasticity of demand for the industry’s goods is greater than 1.
Reasoning
A trade union's power to raise wages without reducing employment depends on the employer's ability to pass on the higher costs. If the economy is experiencing rising employment, this signals growing aggregate demand and a likely increase in demand for the industry's output. This shifts the derived demand for labour to the right, allowing the union to negotiate a higher wage without causing a reduction in employment.
Option A is incorrect because a fall in the price of capital encourages substitution away from labour, reducing the demand for labour. Option C is incorrect because unitary elastic demand means a rise in price leads to a proportionate fall in quantity demanded, so the firm cannot pass on all the cost increase without losing sales. Option D is incorrect because elastic demand means a rise in price leads to a more than proportionate fall in quantity demanded, making it harder for the firm to pass on higher costs.
Answer
B
B
Background Concept
Trade unions negotiate for higher wages on behalf of their members. Their power to achieve this without causing job losses depends on the employer's ability to absorb or pass on the increased labour costs. The demand for labour is a derived demand – it depends on the demand for the product the labour produces. If the demand for the product is strong and growing, the employer is more willing to pay higher wages because they can sell more output. Conversely, if the product market is weak, any wage increase will force the employer to cut costs, often by reducing the number of workers.
Understanding the Question
The question asks which factor would increase a trade union's power, specifically allowing it to raise wages without reducing employment. This is a multiple-choice question testing the conditions that make labour demand less sensitive to wage increases. The key is to identify which option strengthens the derived demand for labour or makes it less elastic.
Approach
Evaluate each option in turn, considering how it affects the employer's ability to pay higher wages without cutting jobs. The correct answer will be the one that either increases the demand for labour (shifts the curve right) or makes the demand for labour less elastic (so a wage rise causes a smaller fall in employment).
Step-by-Step Reasoning
-
Option A: The economy is experiencing a fall in the price of capital.
- Capital and labour can be substitutes in production. If capital becomes cheaper, firms have an incentive to substitute capital for labour (e.g., buy more machines and hire fewer workers). This reduces the demand for labour, shifting the labour demand curve to the left. A trade union would find it harder to raise wages without job losses in this scenario. Therefore, this option is incorrect.
-
Option B: The economy is experiencing rising employment.
- Rising employment in the economy as a whole is a sign of strong aggregate demand and economic growth. This is likely to increase the demand for the industry's goods and services. Since the demand for labour is derived from the demand for the product, an increase in product demand shifts the labour demand curve to the right. With a higher demand for labour, the equilibrium wage can rise without a reduction in the quantity of labour employed. In fact, employment could even increase. This gives the trade union significant bargaining power. This is the correct answer.
-
Option C: The price elasticity of demand for the industry’s goods is equal to 1.
- Price elasticity of demand (PED) measures the responsiveness of quantity demanded to a change in price. If PED = 1 (unitary elastic), a percentage change in price leads to an equal percentage change in quantity demanded in the opposite direction. If the union secures a wage increase, the firm's costs rise, and it will likely raise its price. With unitary elastic demand, the firm's total revenue remains constant, but its sales volume falls. To maintain profitability, the firm would need to reduce its output and therefore its labour force. The union cannot raise wages without some job losses. This option is incorrect.
-
Option D: The price elasticity of demand for the industry’s goods is greater than 1.
- If PED > 1 (elastic demand), a price increase leads to a more than proportionate fall in quantity demanded. This is the worst-case scenario for the firm. If the union forces up wages, the firm must raise its price, and it will lose a large amount of sales. To cut costs, the firm will significantly reduce its output and employment. The union has very little power to raise wages without causing substantial job losses. This option is incorrect.
Key Takeaways
- The demand for labour is a derived demand, so the strength of the product market is crucial for union bargaining power.
- A trade union's ability to raise wages without reducing employment depends on the employer's ability to pay (strong product demand) and the employer's ability to pass on costs (inelastic product demand).
- A fall in the price of a substitute factor (capital) weakens union power, while a rise in product demand strengthens it.
Common Mistakes
- Confusing derived demand with direct demand: Students may think a trade union's power comes from its own size or strike threat, forgetting that the employer's ability to pay ultimately depends on the demand for its product.
- Misapplying elasticity: Students might think that elastic demand (D) is good for the union because it means consumers are responsive, but in this context, it means the firm cannot pass on costs. Inelastic demand would be better for the union.
- Ignoring the substitution effect: Option A is a classic distractor. Students may see a fall in capital prices as a sign of a healthy economy, but they must recognise it as a substitute for labour.
Things to Be Careful About
- Read the question carefully: it asks for what will increase the union's power to raise wages without reducing employment. The focus is on the outcome for employment, not just the wage.
- Distinguish between a movement along the labour demand curve (caused by a change in the wage rate) and a shift of the labour demand curve (caused by a change in product demand, productivity, or the price of other factors). Option B causes a shift, while options C and D affect the slope of the demand curve for the product, which in turn affects the elasticity of the derived demand for labour.
- Remember that a trade union's power is not absolute; it is constrained by market forces. The question tests the understanding of these constraints.
In a closed economy with no government, the level of consumption spending is determined by the equation C = a + bY.
What does b represent in this equation?
Options
A autonomous consumption
B autonomous investment
C the average propensity to consume
D the marginal propensity to consume
Answer
The consumption function is C = a + bY, where:
- C is total consumption spending
- a is autonomous consumption (consumption when income is zero)
- b is the marginal propensity to consume (MPC), the fraction of each additional unit of income that is spent on consumption
- Y is national income
Therefore, b represents the marginal propensity to consume.
Answer
D
D
Background Concept
The consumption function is a fundamental building block of the Keynesian macroeconomic model. It describes the relationship between total consumption spending (C) and disposable income (Y). In its simplest linear form, for a closed economy with no government, it is written as:
C = a + bY
Here:
- C is the total planned consumption expenditure.
- a is autonomous consumption. This is the level of consumption that would occur even if income were zero. It represents spending on necessities funded by borrowing or past savings. It is the intercept of the consumption function on the vertical axis.
- b is the marginal propensity to consume (MPC). It is the slope of the consumption function. It tells us how much consumption changes when income changes by one unit (b = ΔC / ΔY). It is a fraction between 0 and 1, as people tend to spend only a portion of any extra income and save the rest.
- Y is national income (or disposable income in a model with government).
Understanding the Question
This is a straightforward multiple-choice question testing knowledge of the standard notation used in the consumption function. The question provides the equation C = a + bY for a closed economy with no government. It asks what the letter 'b' represents. The four options are: autonomous consumption, autonomous investment, the average propensity to consume, and the marginal propensity to consume. The task is to select the correct definition of 'b'.
Approach
The approach is to recall the standard Keynesian consumption function. Identify each component of the equation: 'a' is the intercept (autonomous consumption), 'b' is the slope (the marginal propensity to consume), and 'Y' is the independent variable (income). By matching 'b' to its economic definition, the correct option can be selected.
Step-by-Step Reasoning
- Identify the equation: The question gives the consumption function as C = a + bY.
- Recall the standard form: The standard textbook consumption function is C = a + bY, where 'a' is autonomous consumption and 'b' is the marginal propensity to consume (MPC).
- Evaluate the options:
- Option A (autonomous consumption): This is represented by 'a', not 'b'. Autonomous consumption is the spending that occurs regardless of income.
- Option B (autonomous investment): Investment is a separate component of aggregate demand (I). It is not part of the consumption function. The equation given is specifically for consumption.
- Option C (the average propensity to consume): The average propensity to consume (APC) is total consumption divided by total income (C/Y). It is not a constant parameter in the linear function; it changes as income changes. 'b' is a constant parameter.
- Option D (the marginal propensity to consume): This is the correct definition of 'b'. The marginal propensity to consume is the change in consumption resulting from a change in income (ΔC/ΔY). In the linear equation C = a + bY, the slope 'b' is exactly this ratio.
- Select the correct answer: Based on the analysis, option D is the correct answer.
Key Takeaways
- The consumption function C = a + bY is a core model in macroeconomics.
- 'a' represents autonomous consumption (the intercept).
- 'b' represents the marginal propensity to consume (the slope).
- The MPC is a crucial concept for understanding the multiplier effect.
Common Mistakes
- Confusing 'a' and 'b': A common mistake is to mix up autonomous consumption (a) and the marginal propensity to consume (b). Remember that 'a' is the starting point of consumption, while 'b' is the rate at which consumption changes with income.
- Confusing MPC and APC: The marginal propensity to consume (MPC) is the change in consumption from a change in income. The average propensity to consume (APC) is total consumption divided by total income. They are different concepts.
Things to Be Careful About
- Pay close attention to the notation used in the question. The standard notation is C = a + bY, but some textbooks might use different letters (e.g., C = C0 + cY). The underlying economic meaning is the same.
- Remember that this is a simple linear function. In reality, the consumption function might be more complex, but for this question, the standard model applies.
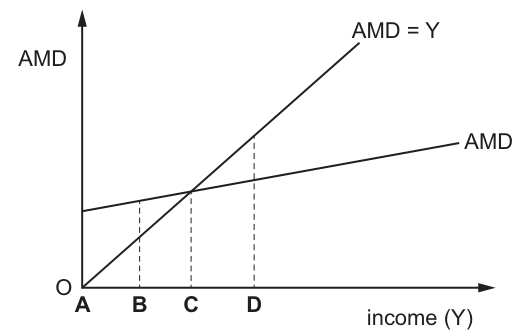
The diagram shows an economy’s aggregate monetary demand curve, AMD1.
Which level of income will produce the greatest difference between autonomous and induced expenditure?
Options
A income level A on Fig. 14.1
B income level B on Fig. 14.1
C income level C on Fig. 14.1
D income level D on Fig. 14.1
Reasoning
Autonomous expenditure is the vertical intercept of the AMD curve and is constant at all income levels. Induced expenditure rises as income rises (the positive slope of AMD1). The difference between them is therefore greatest where income is lowest, because induced expenditure is then smallest. On Fig. 14.1, income level A is the lowest.
Answer
A
A
Background Concept
The diagram is a Keynesian cross, used to illustrate national income determination. Aggregate Monetary Demand (AMD) is composed of two elements: autonomous expenditure and induced expenditure. Autonomous expenditure is the component of aggregate demand that does not vary with national income (for example, autonomous consumption, investment, government spending or exports). It is represented by the vertical intercept of the AMD curve. Induced expenditure is the component that varies directly with national income; as income rises, consumption and other induced components rise. In equation form, AMD = Autonomous Expenditure + cY, where c is the marginal propensity to consume (or the marginal propensity to withdraw in a leakages model) and Y is national income. The 45-degree line (AMD = Y) shows all points where aggregate monetary demand equals national income.
Understanding the Question
The question asks which of the four marked income levels (A, B, C or D) produces the greatest difference between autonomous and induced expenditure. This requires understanding that autonomous expenditure is fixed while induced expenditure increases with Y. The "difference" refers to the numerical gap between the constant autonomous component and the income-dependent induced component at each specific income level.
Approach
Identify that autonomous expenditure is the vertical intercept of AMD1 and does not change across the four points. Identify that induced expenditure equals the slope of AMD1 multiplied by income. Because the slope is positive, induced expenditure is smallest at the lowest income level (A) and largest at the highest income level (D). The difference (Autonomous minus Induced) is therefore maximized at the lowest Y.
Step-by-Step Reasoning
- Autonomous expenditure is represented by the point where AMD1 meets the AMD axis (when Y = 0). This value is constant regardless of which income level is chosen.
- Induced expenditure at any income level Y is the increase in AMD caused by that income. It is calculated as the slope of AMD1 multiplied by Y. Because the slope is positive, induced expenditure rises as we move from A to B to C to D.
- The difference between autonomous and induced expenditure is therefore Autonomous - (slope × Y). This difference is largest when the term (slope × Y) is smallest.
- Since Y is smallest at income level A, induced expenditure is smallest at A, and the gap between autonomous and induced expenditure is greatest at A.
- At income level C, the economy is in equilibrium (AMD = Y), but this does not maximise the gap between the two components. At B and D, the gap is smaller than at A because induced expenditure is larger.
Key Takeaways
- Autonomous expenditure is independent of national income.
- Induced expenditure varies directly with national income.
- In the Keynesian cross model, the numerical gap between autonomous and induced expenditure narrows as national income increases.
- The lowest income level on the diagram yields the greatest difference between these two components.
Common Mistakes
- Confusing the difference between autonomous and induced expenditure with the vertical distance between the AMD curve and the 45-degree line (the deflationary or inflationary gap). These are different concepts.
- Assuming the difference is greatest at the equilibrium point (C) because it is the intersection of the two lines and therefore appears "special" on the diagram.
- Forgetting that induced expenditure rises with income and therefore the gap shrinks as we move rightwards along the horizontal axis from A to D.
Things to Be Careful About
- Ensure you interpret "difference between autonomous and induced expenditure" correctly as A - cY, not as the gap between AMD and Y.
- Note that AMD1 is flatter than the 45-degree line, implying the marginal propensity to consume (or the slope of AMD) is less than 1, but this does not change the fact that induced expenditure rises with Y.
- The question asks for the "greatest difference", which implies the largest numerical gap. Since autonomous is positive and induced is positive and rising, the gap A - cY is largest at the smallest Y.
According to the accelerator theory, what would cause investment in an economy to be lower than in the previous year?
Options
A a lower marginal propensity to consume than in the previous year
B a lower marginal propensity to save than in the previous year
C a smaller fall in national income than occurred in the previous year
D a smaller rise in national income than occurred in the previous year
Reasoning
According to the accelerator theory, net investment (I) is proportional to the change in national income (ΔY). A smaller rise in national income (a smaller positive ΔY) than in the previous year implies that the change in income is less positive, so the induced investment will be lower than in the previous year.
Option A is incorrect because a lower marginal propensity to consume does not directly affect the accelerator relationship; it would affect the size of the multiplier but not the accelerator itself.
Option B is incorrect because a lower marginal propensity to save means a higher MPC, which would increase the multiplier but not directly affect the accelerator.
Option C is incorrect because a smaller fall in national income (a less negative ΔY) means the change is actually larger (less negative), so investment would be higher, not lower.
Answer
D
D
Background Concept
The accelerator theory of investment explains that net investment is induced by changes in national income. The relationship is: I = v * ΔY, where v is the accelerator coefficient (capital-output ratio) and ΔY is the change in national income. This means that investment is positive only when national income is rising. If national income rises at a slower rate (smaller ΔY), investment falls. If national income falls, net investment can be negative (disinvestment).
Understanding the Question
This question asks you to identify which scenario would cause investment to be lower than the previous year. The key is the accelerator principle: investment depends on the change in national income, not the level. Option D states a smaller rise in national income, which means the change (ΔY) is smaller, so induced investment is lower. Option C is a trap: a smaller fall means the change is less negative, which would actually increase investment (or reduce disinvestment), so investment would be higher.
Approach
Recall the basic formula of the accelerator: I = v * ΔY. Then evaluate each option to see if it would make ΔY smaller than the previous year. Only D directly makes ΔY smaller. The other options either affect the multiplier (A, B) or make ΔY larger (C).
Step-by-Step Reasoning
- The accelerator theory states that investment is a function of the change in output: I = v * (Y_t - Y_{t-1}).
- For investment to be lower than in the previous year, the change in national income (ΔY) must be smaller than it was in the previous year.
- Option D: 'a smaller rise in national income' means that the increase this year is smaller than the increase last year. So ΔY_t < ΔY_{t-1}, leading to I_t < I_{t-1}.
- Option C: 'a smaller fall in national income' means that the decrease is smaller, so the change is less negative. For example, if last year's change was -100, and this year's change is -50, then ΔY is actually larger (-50 > -100), so investment would be higher (or less negative).
- Options A and B refer to the marginal propensity to consume or save. These affect the multiplier but not the accelerator directly. The accelerator is about the relationship between investment and changes in output, not about the consumption function. So they are incorrect.
Key Takeaways
- The accelerator theory links investment to the change in national income, not the level.
- A smaller rise or a larger fall in national income reduces investment.
- A smaller fall (less negative) actually increases investment.
- The multiplier and accelerator are separate concepts, though they can interact in the multiplier-accelerator model.
Common Mistakes
- Confusing a smaller fall with a larger fall. A smaller fall means the change is less negative, so investment is higher.
- Thinking that a lower MPC or MPS directly affects the accelerator. These affect the multiplier, not the accelerator coefficient.
- Forgetting that the accelerator applies to net investment, not gross investment. Gross investment includes replacement, which is autonomous.
Things to Be Careful About
- Always interpret 'smaller rise' and 'smaller fall' correctly: they refer to the magnitude of the change, not the direction.
- The accelerator is a different concept from the multiplier. They are often distinguished in macroeconomics.
- In the accelerator formula, the coefficient v is assumed constant, but in reality it may vary.
What is the best description of sustainable economic development?
Options
A a long-term increase in the actual output of an economy
B a long-term increase in living standards without damage to the environment
C a long-term increase in the productive potential of an economy
D a long-term increase in the living standards of every member of society
Answer
Sustainable economic development is best defined as a long-term increase in living standards that does not compromise the ability of future generations to meet their own needs. Option B correctly incorporates both the increase in living standards and the environmental constraint. Options A and C describe economic growth, not development. Option D is unrealistic because it implies that every member of society experiences an increase, which is not required for sustainable development.
B
Background Concept
Economic growth refers to a long-term increase in an economy's actual output (real GDP) or its productive potential. Economic development is a broader concept that includes improvements in living standards, health, education, and well-being, not just output. Sustainable development adds an intergenerational dimension: it meets the needs of the present without compromising the ability of future generations to meet their own needs. This explicitly includes environmental sustainability (preserving natural resources, limiting pollution, and maintaining ecosystem services).
Understanding the Question
The question asks for the "best description" of sustainable economic development. It is a multiple-choice question with four options. The key is to distinguish between economic growth (A and C) and economic development (B and D), and then to apply the sustainability criterion. Option B is the only one that explicitly mentions avoiding damage to the environment, which is a core component of sustainable development.
Approach
Read each option carefully. Identify which refer to growth (output or productive potential) and which refer to development (living standards). Then apply the sustainability test: sustainable development requires that the increase in living standards can be maintained over time, which depends on not degrading the environment. Option D is too broad (every member of society) and is not a standard definition.
Step-by-Step Reasoning
-
Option A: "a long-term increase in the actual output of an economy" – This describes economic growth. It makes no mention of development or sustainability. Even if output increases, it may be achieved by depleting resources, causing environmental damage, and not improving living standards broadly. This is not sustainable development.
-
Option B: "a long-term increase in living standards without damage to the environment" – This captures the essence of sustainable development: improvement in well-being (living standards) that is environmentally sustainable (no damage). This is the correct answer.
-
Option C: "a long-term increase in the productive potential of an economy" – This describes potential growth or an increase in the economy's capacity to produce. Like A, it is about growth, not development. It does not address living standards or sustainability.
-
Option D: "a long-term increase in the living standards of every member of society" – This is unrealistic and not a standard definition. Sustainable development aims for overall improvement, not necessarily that every single member benefits equally. It also omits the environmental dimension.
Therefore, B is the best description.
Key Takeaways
- Sustainable development combines improvements in living standards with environmental stewardship.
- Economic growth is a narrower concept focused on output; development is broader and includes social and environmental factors.
- In multiple-choice questions, eliminate options that miss key elements (here, the environment or a focus on development rather than growth).
Common Mistakes
- Confusing economic growth with economic development. Options A and C are growth-related, but many students might pick them because they sound similar.
- Thinking that sustainable development requires equal benefit for every individual (option D). This is not a requirement.
- Overlooking the environmental component: without the phrase "without damage to the environment", a definition of development is incomplete for sustainability.
Things to Be Careful About
- The word "best" implies that more than one option might be partially correct, but only one is fully accurate. Look for the option that includes all essential elements.
- Ensure you understand the difference between growth (increase in output) and development (improvement in living standards).
- Note that sustainable development is a normative concept: it involves value judgments about what constitutes well-being and how to balance present and future needs.
What is least likely to increase the natural rate of unemployment?
Options
A a decrease in information about vacancies
B a decrease in trade union power
C an increase in unemployment benefits
D an increase in immigration
Reasoning
The natural rate of unemployment consists of frictional and structural unemployment.
- A: A decrease in information about vacancies increases frictional unemployment (harder to match workers to jobs), so it increases the natural rate.
- B: A decrease in trade union power reduces wage rigidity and insider-outsider effects, which tends to decrease structural unemployment and thus the natural rate. It is the least likely to increase it.
- C: An increase in unemployment benefits reduces the incentive to search for work, increasing frictional unemployment and the natural rate.
- D: An increase in immigration may increase labour supply, potentially adding to frictional or structural unemployment if skills mismatch, so it could increase the natural rate.
Therefore, B is the least likely to increase the natural rate.
Answer
B
B
Background Concept
The natural rate of unemployment (also called the non-accelerating inflation rate of unemployment, NAIRU) is the rate of unemployment that exists when the labour market is in equilibrium, with no cyclical (demand-deficient) unemployment. It comprises frictional unemployment (workers between jobs, searching for the best match) and structural unemployment (mismatch between workers' skills and available jobs, often due to technological change or geographical immobility). The natural rate is determined by structural and institutional factors of the labour market, such as the efficiency of job matching, the level of unemployment benefits, the power of trade unions, the degree of labour mobility, and demographic changes.
Understanding the Question
The question asks: "What is least likely to increase the natural rate of unemployment?" This means we must identify which of the four options would have the smallest (or possibly a negative) effect on raising the natural rate. The command word "least likely" requires us to compare the likely impact of each change. We need to apply our knowledge of the determinants of frictional and structural unemployment to each option.
Approach
We will evaluate each option in turn:
- Option A: decrease in information about vacancies
- Option B: decrease in trade union power
- Option C: increase in unemployment benefits
- Option D: increase in immigration
For each, we consider whether it increases frictional or structural unemployment. The option that does not increase either, or actually decreases the natural rate, is the answer.
Step-by-Step Reasoning
Option A: a decrease in information about vacancies
- Information about job vacancies helps workers find suitable jobs quickly. If information decreases, the job search process becomes longer and less efficient. This increases frictional unemployment because workers take longer to match with vacancies. Therefore, this change is likely to increase the natural rate.
Option B: a decrease in trade union power
- Trade unions can push wages above the market-clearing level, causing an excess supply of labour (classical unemployment). This is often considered a form of structural unemployment because it results from institutional wage rigidity. Strong unions may also protect insiders at the expense of outsiders, increasing structural unemployment. If trade union power decreases, wages become more flexible, and the labour market can adjust more easily. This tends to reduce structural unemployment and thus the natural rate. Therefore, a decrease in trade union power is unlikely to increase the natural rate; it may even decrease it. This makes B the least likely to increase the natural rate.
Option C: an increase in unemployment benefits
- Higher unemployment benefits reduce the opportunity cost of being unemployed. Workers may search less intensively or be more selective about job offers, lengthening the duration of unemployment. This increases frictional unemployment and therefore the natural rate. Empirical evidence supports this effect.
Option D: an increase in immigration
- An increase in immigration expands the labour supply. If immigrants have different skills or are willing to work for lower wages, they may increase competition for jobs. This could lead to higher frictional unemployment as native workers adjust, or structural unemployment if there is a skills mismatch. However, immigration can also fill labour shortages and boost demand, potentially reducing unemployment. The net effect is ambiguous, but it is generally considered that immigration can increase the natural rate in the short run due to adjustment frictions. Therefore, it is more likely to increase the natural rate than a decrease in trade union power.
Thus, B is the least likely to increase the natural rate.
Key Takeaways
- The natural rate of unemployment is determined by structural and frictional factors, not by aggregate demand.
- Factors that improve labour market efficiency (better information, flexible wages) tend to reduce the natural rate.
- Factors that increase search costs or reduce incentives to work (higher benefits, poor information) tend to increase the natural rate.
- Trade union power can increase the natural rate by causing wage rigidity; reducing union power is likely to lower the natural rate.
Common Mistakes
- Confusing the natural rate with cyclical unemployment. Some students might think that immigration increases demand and reduces unemployment, but the question is about the natural rate, not the actual rate.
- Assuming that a decrease in trade union power always increases unemployment because unions protect workers. In fact, unions can cause wage rigidity that increases structural unemployment.
- Not considering the direction of change: the question asks for "least likely to increase", so an option that decreases the natural rate is the best answer.
Things to Be Careful About
- The natural rate is a long-run concept; short-run effects may differ.
- Trade union power can have different effects in different institutional contexts, but the standard analysis is that strong unions increase the natural rate.
- Immigration effects are complex; the question expects the conventional view that immigration can increase frictional/structural unemployment, but it is less clear-cut than the other options.
- Always read the question carefully: "least likely" means we are comparing probabilities, not absolutes.
In Keynesian economic theory, what is the purpose of interest?
Options
A to bring national income and expenditure into line
B to control the level of economic growth
C to create a balance between savings and investment
D to provide a reward for surrendering liquidity
Reasoning
In Keynesian theory, the rate of interest is determined by the demand for and supply of money. The demand for money arises from three motives: the transactions motive, the precautionary motive, and the speculative motive. Keynes argued that people hold money (a liquid asset) rather than bonds because of uncertainty about future interest rates. The rate of interest is the reward for parting with liquidity — for giving up the convenience and security of holding money. This is the liquidity preference theory of interest.
Option A describes the role of the price mechanism in the circular flow, not the purpose of interest. Option B describes a possible effect of interest rate changes but not the theoretical purpose. Option C describes the classical (loanable funds) theory, where interest equilibrates saving and investment, but Keynes rejected this view. Option D correctly states the Keynesian view: interest is the reward for surrendering liquidity.
Answer
D
D
Background Concept
In macroeconomics, the rate of interest is a key variable that influences spending, saving, and investment decisions. Two major theories explain how the interest rate is determined:
-
Classical (Loanable Funds) Theory: The interest rate is determined by the supply of savings (from households) and the demand for loanable funds (for investment). In this view, the interest rate equilibrates saving and investment. A higher interest rate encourages more saving and discourages investment, bringing the two into balance.
-
Keynesian (Liquidity Preference) Theory: John Maynard Keynes rejected the classical view. He argued that the interest rate is not determined by saving and investment but by the demand for and supply of money. People demand money (the most liquid asset) for three motives:
- Transactions motive: to make everyday purchases.
- Precautionary motive: to meet unexpected expenses.
- Speculative motive: to hold money rather than bonds when future interest rates are uncertain (if interest rates are expected to rise, bond prices will fall, so people prefer to hold money).
Keynes called the demand for money liquidity preference. The supply of money is determined by the central bank. The interest rate is the price that equates the demand for money with the supply of money. In this framework, the interest rate is the reward for parting with liquidity — for giving up the convenience and security of holding cash.
Understanding the Question
This is a multiple-choice question testing knowledge of Keynesian economic theory. It asks: "What is the purpose of interest?" in the Keynesian framework. The question is not asking what interest does in general or in the classical model — it specifically asks for the Keynesian view. The four options present different possible functions of interest:
- A: to bring national income and expenditure into line (this describes the role of the price level or the multiplier, not interest specifically).
- B: to control the level of economic growth (this is a policy objective, not the theoretical purpose of interest).
- C: to create a balance between savings and investment (this is the classical/loanable funds view).
- D: to provide a reward for surrendering liquidity (this is the Keynesian view).
The correct answer is D.
Approach
- Recall the Keynesian theory of interest (liquidity preference).
- Identify the key phrase: interest is the reward for parting with liquidity.
- Eliminate the other options:
- A is too vague and not specific to interest.
- B is a policy effect, not the theoretical purpose.
- C is the classical view, not Keynesian.
- Select D.
Step-by-Step Reasoning
Step 1: Understand the Keynesian view of interest.
Keynes wrote "The General Theory of Employment, Interest and Money" (1936). He argued that the classical theory, which said interest equilibrates saving and investment, was wrong. Instead, he proposed that the interest rate is determined by the demand for money (liquidity preference) and the supply of money. People hold money because it is liquid — it can be used immediately for transactions. To persuade people to hold less liquid assets (like bonds), they must be offered a reward. That reward is the rate of interest.
Step 2: Match the options to the theory.
-
Option D directly states: "to provide a reward for surrendering liquidity." This is exactly Keynes's definition. When you buy a bond, you are giving up liquidity (you cannot use that money for transactions until the bond matures or is sold). The interest you earn compensates you for that loss of liquidity.
-
Option C says: "to create a balance between savings and investment." This is the classical (loanable funds) theory. In the classical model, the interest rate adjusts to make planned saving equal to planned investment. Keynes rejected this because he believed that saving and investment are not necessarily equal at full employment — the economy could be in equilibrium with unemployment. So C is not the Keynesian view.
-
Option A says: "to bring national income and expenditure into line." This is too vague. In Keynesian theory, it is changes in income (through the multiplier) that bring aggregate demand and output into line, not the interest rate directly. Interest affects investment, which then affects income, but the purpose of interest is not to equilibrate income and expenditure.
-
Option B says: "to control the level of economic growth." This is a possible effect of interest rate changes (e.g., raising interest rates to slow an overheating economy), but it is not the theoretical purpose of interest in Keynesian theory. The purpose is to reward liquidity surrender; controlling growth is a policy application.
Step 3: Conclude.
The correct answer is D.
Key Takeaways
- In Keynesian theory, the interest rate is determined by liquidity preference (demand for money) and the money supply.
- The interest rate is the reward for parting with liquidity — for holding less liquid assets like bonds.
- The classical view (interest equilibrates saving and investment) is not the Keynesian view.
- This question tests the ability to distinguish between different theories of interest rate determination.
Common Mistakes
- Confusing Keynesian and classical theories: Many students associate interest with saving and investment (the classical view) and forget that Keynes had a different explanation. Always check which theory the question is asking about.
- Choosing a policy effect instead of a theoretical purpose: Option B (controlling growth) sounds plausible because central banks do use interest rates to manage the economy, but the question asks for the theoretical purpose, not the policy use.
- Overthinking: Option A might seem related to the circular flow, but it is not specific to interest. Stick to the precise wording of the theory.
Things to Be Careful About
- Read the question carefully: it says "in Keynesian economic theory." If the question said "in classical economic theory," the answer would be C.
- Know the key phrase: "reward for parting with liquidity" or "reward for surrendering liquidity." This is a standard definition in the syllabus.
- Do not confuse the purpose of interest (theoretical) with the effects of interest rate changes (policy).
The quantity theory of money is sometimes represented by the equation MV = PT.
Which statement is not correct?
Options
A M is a measure of the total value of notes and coins in circulation in the country.
B P measures the average level of prices in the country.
C T stands for the quantity of real transactions during the year.
D V represents the number of times a unit of money is spent during a given time period.
Answer
In the equation MV = PT, M is the total stock of money in the economy, which includes not only notes and coins in circulation but also bank deposits (sight deposits and time deposits). Option A incorrectly restricts M to only notes and coins in circulation, so it is the statement that is not correct.
Answer
A
A
Background Concept
The quantity theory of money is expressed by the equation of exchange: MV = PT. This identity states that the total money spending (M × V) equals the total value of transactions (P × T). Each variable has a precise definition:
- M = the total money supply in the economy (a broad measure, not just cash)
- V = the velocity of circulation (how many times a unit of money changes hands in a given period)
- P = the average price level of all transactions
- T = the real volume of transactions (the quantity of goods and services exchanged)
Understanding the Question
The question asks which of the four statements about the variables in MV = PT is NOT correct. This is a straightforward recall question: you must know the standard definition of each variable and spot the one that is wrong. The incorrect statement is option A, because it defines M too narrowly.
Approach
Go through each option one by one, comparing it to the standard definition. The one that deviates from the standard is the answer.
Step-by-Step Reasoning
- Option A: "M is a measure of the total value of notes and coins in circulation in the country." This is incorrect. In the quantity theory, M represents the total money supply, which includes not only notes and coins (currency in circulation) but also bank deposits (demand deposits, time deposits, and other liquid assets). The money supply is broader than just cash. Therefore, A is the statement that is not correct.
- Option B: "P measures the average level of prices in the country." This is correct. P is the price level, typically measured by a price index such as the GDP deflator or the consumer price index.
- Option C: "T stands for the quantity of real transactions during the year." This is correct. T is the real volume of transactions (goods and services exchanged), not the nominal value.
- Option D: "V represents the number of times a unit of money is spent during a given time period." This is correct. V is the velocity of circulation, the average number of times a unit of money is used in transactions per period.
Thus, the only incorrect statement is A.
Key Takeaways
- The quantity theory equation MV = PT is an identity, not a theory, but it is used to derive the quantity theory of money.
- M is the total money supply, not just cash. A common mistake is to think M only means notes and coins.
- V is velocity, P is the price level, and T is real transactions.
Common Mistakes
- Thinking M only refers to currency in circulation. This is the exact trap in this question.
- Confusing T with nominal GDP (which would be PT). T is the real quantity of transactions.
- Forgetting that V is a flow concept (per period), not a stock.
Things to Be Careful About
- Read each option carefully. The question asks for the statement that is "not correct", so you are looking for the false one.
- Know the standard definitions from the syllabus. The quantity theory is a core topic in Money and Banking.
A country is experiencing high unemployment, high inflation and a trade deficit.
Which policy is most likely to solve all of these problems?
Options
A devaluation of the currency
B export subsidies
C lower interest rates
D tariffs on imports
Answer
B — export subsidies
Export subsidies make exports cheaper for foreign buyers, increasing export sales. This raises aggregate demand (AD), reducing unemployment. The increased supply of exports also improves the trade deficit. By boosting domestic output, export subsidies can help reduce cost-push inflationary pressure if the economy has spare capacity, as higher output lowers unit costs. Unlike devaluation (A), which raises import prices and worsens inflation, or lower interest rates (C), which boost AD but worsen the trade deficit and may fuel inflation, or tariffs (D), which protect domestic industries but raise import prices and can worsen inflation, export subsidies are the only policy that can simultaneously reduce unemployment, improve the trade balance, and avoid worsening inflation.
B
Background Concept
This question tests the ability to evaluate macroeconomic policies in the context of the 'policy trilemma' — the difficulty of simultaneously achieving low unemployment, low inflation, and a healthy balance of payments. Each policy tool has multiple effects, and some effects conflict. The key is to trace the chain of causation for each option and see which one can address all three problems without creating a new one.
Understanding the Question
The question presents a country with three simultaneous macroeconomic problems:
- High unemployment (a negative output gap, or demand-deficient unemployment)
- High inflation (rising general price level)
- A trade deficit (imports > exports, a current account deficit)
The task is to select the single policy most likely to solve ALL three. This is a classic 'policy conflict' question — most policies that reduce unemployment (e.g., expansionary monetary or fiscal policy) tend to worsen inflation and/or the trade deficit. The correct answer must be the one that can break this trade-off.
Approach
Evaluate each option systematically:
-
Devaluation (A): Makes exports cheaper and imports dearer. This improves the trade balance (if Marshall-Lerner condition holds) and boosts AD, reducing unemployment. However, it directly raises import prices, worsening inflation. So it fails on inflation.
-
Export subsidies (B): Government pays domestic firms to export, making exports cheaper abroad. This boosts export sales, raising AD (reducing unemployment) and improving the trade balance. By increasing domestic output, it can reduce unit costs (if spare capacity exists), helping to lower inflation. It does not directly raise import prices. So it can address all three.
-
Lower interest rates (C): Expansionary monetary policy. Boosts AD (reducing unemployment) but also fuels inflation (demand-pull) and worsens the trade deficit (higher incomes increase imports). Fails on inflation and trade deficit.
-
Tariffs on imports (D): Protectionist policy. Reduces imports, improving the trade deficit. May protect domestic jobs, reducing unemployment. But tariffs raise import prices, worsening inflation. Fails on inflation.
Only export subsidies avoid worsening inflation.
Step-by-Step Reasoning
Option A — Devaluation
- Mechanism: A lower exchange rate makes exports cheaper in foreign currency and imports more expensive in domestic currency.
- Effect on trade deficit: If PEDx + PEDm > 1 (Marshall-Lerner condition), the trade balance improves.
- Effect on unemployment: Higher net exports increase AD, shifting AD right, raising real output and reducing demand-deficient unemployment.
- Effect on inflation: Import prices rise, directly increasing the cost of imported raw materials and finished goods. This is cost-push inflation. Also, higher AD may add demand-pull pressure. So devaluation worsens inflation.
- Verdict: Fails on inflation.
Option B — Export subsidies
- Mechanism: Government provides a per-unit subsidy to domestic firms for each unit exported. This reduces the price foreign buyers pay, increasing quantity of exports demanded.
- Effect on trade deficit: Export revenue rises (if demand is elastic enough), improving the current account.
- Effect on unemployment: Higher export sales increase AD (C+I+G+(X-M)), shifting AD right, raising output and employment.
- Effect on inflation: The subsidy does not directly raise import prices. By increasing domestic output, it can reduce unit costs (economies of scale, spreading fixed costs), which is disinflationary. If the economy has spare capacity, the increase in output can be achieved without significant demand-pull pressure. So inflation may actually fall.
- Verdict: Can address all three.
Option C — Lower interest rates
- Mechanism: Reduces the cost of borrowing, encouraging consumption and investment. Also may weaken the exchange rate (if capital flows respond).
- Effect on unemployment: Higher C and I increase AD, reducing unemployment.
- Effect on trade deficit: Higher AD increases imports (M is a positive function of Y), worsening the trade deficit. Also, lower interest rates may weaken the currency, but the net effect on the trade balance is uncertain and likely negative in the short run.
- Effect on inflation: Higher AD creates demand-pull inflation. Also, a weaker currency raises import prices (cost-push). So inflation worsens.
- Verdict: Fails on trade deficit and inflation.
Option D — Tariffs on imports
- Mechanism: A tax on imported goods, raising their price.
- Effect on trade deficit: Reduces quantity of imports, improving the trade balance.
- Effect on unemployment: Domestic firms face less import competition, so they can increase output and employment. Also, AD may rise as net exports improve.
- Effect on inflation: Tariffs directly raise the price of imported goods, feeding into the general price level (cost-push inflation). They also reduce competitive pressure on domestic firms, allowing them to raise prices.
- Verdict: Fails on inflation.
Conclusion: Only export subsidies can simultaneously reduce unemployment, improve the trade deficit, and avoid worsening inflation (or even reduce it).
Key Takeaways
- Macroeconomic policy often involves trade-offs — a policy that helps one objective may harm another.
- The 'policy trilemma' is a central concept: it is difficult to achieve all three of low unemployment, low inflation, and a healthy balance of payments with a single tool.
- Export subsidies are a supply-side/industrial policy that can boost exports without directly raising import prices, making them uniquely suited to this combination of problems.
- Always trace the full chain of causation for each policy option, considering both demand-side and supply-side effects.
Common Mistakes
- Choosing devaluation (A) because it 'obviously' helps exports and the trade deficit, without considering its inflationary impact.
- Choosing lower interest rates (C) because it is a standard expansionary policy, forgetting that it worsens the trade deficit and inflation.
- Choosing tariffs (D) because they protect domestic jobs and reduce imports, without realising they raise prices and worsen inflation.
- Failing to consider that export subsidies can reduce inflation by increasing output and lowering unit costs.
Things to Be Careful About
- The question asks for the policy 'most likely to solve all of these problems' — not just one or two. A policy that solves two but worsens the third is not the correct answer.
- Export subsidies are not a standard macroeconomic tool in many textbooks, but they are a valid policy option in the Cambridge syllabus. They are a form of supply-side/industrial policy.
- The effectiveness of export subsidies depends on the price elasticity of demand for exports and the presence of spare capacity in the economy. The question assumes these conditions hold.
- Be careful not to confuse export subsidies with tariffs or devaluation — each has a different mechanism and different effects on inflation.
The United States government has been using a policy of quantitative easing to increase economic growth.
What is the most likely effect of this policy on the internal and external value of the US dollar?
Options
| internal value | external value | |
|---|---|---|
| A | decreases | decreases |
| B | decreases | increases |
| C | increases | increases |
| D | increases | decreases |
Answer
Quantitative easing increases the money supply. According to the quantity theory of money, an increase in the money supply, if not matched by a rise in output, leads to inflation. Inflation reduces the internal value of the dollar (its purchasing power over goods and services). A higher US money supply also tends to lower US interest rates relative to other countries, reducing demand for the dollar on foreign exchange markets and causing the dollar to depreciate. Thus both the internal and external value of the dollar decrease. The correct option is A.
A
Background Concept
Quantitative easing (QE) is an unconventional monetary policy used by central banks to increase the money supply when conventional policy (lowering interest rates) is ineffective. The central bank buys government bonds or other financial assets, injecting money directly into the economy. This increases the monetary base.
Internal value of money refers to the purchasing power of a currency within the domestic economy – how much goods and services a unit of currency can buy. It is inversely related to the price level: if prices rise, the internal value falls.
External value of money is the currency's exchange rate – the price of one currency in terms of another. A decrease in external value means the currency depreciates (or weakens) against other currencies.
Understanding the Question
This question asks about the likely effect of quantitative easing on both the internal and external value of the US dollar. There are four possible combinations: both decrease, internal decreases but external increases, internal increases but external decreases, or both increase. The student must understand the chain of causation from QE to inflation and then to the exchange rate, or directly from QE to interest rates and exchange rates.
Approach
The key is to recognise that QE expands the money supply. This has two main channels:
- Domestic price level: An increase in the money supply, if output is not growing proportionally, will lead to inflation (too much money chasing too few goods). Inflation reduces the internal value of the dollar.
- Exchange rate: The expansion of the money supply tends to lower domestic interest rates (or at least keep them low). Lower interest rates make the dollar less attractive to foreign investors, reducing demand for dollars and causing the currency to depreciate. Alternatively, the higher inflation expected from QE also reduces the attractiveness of holding dollars, leading to depreciation.
Thus both values decrease.
Step-by-Step Reasoning
- The US government/central bank uses quantitative easing, which involves large-scale purchases of assets, increasing the money supply.
- Internal value: With more money in the economy, aggregate demand rises. If the economy is near full capacity, the extra demand pushes up the general price level (inflation). The purchasing power of the dollar falls – i.e., its internal value decreases.
- External value: The increased money supply and expected inflation reduce the real interest rate relative to other countries. Foreign investors seek higher returns elsewhere, so they sell dollars and buy other currencies. This reduces demand for the dollar, causing its exchange rate to depreciate – i.e., its external value decreases.
- Therefore, both internal and external value decrease. That corresponds to option A.
Key Takeaways
- Quantitative easing is expansionary and increases the money supply.
- The internal value of money is its purchasing power; it falls when inflation occurs.
- The external value is the exchange rate; it typically falls when the money supply expands (depreciation).
- It is important to distinguish between internal and external value and to know the standard effects of monetary policy on both.
Common Mistakes
- Confusing internal and external value: some students might think that QE strengthens the economy and therefore the dollar appreciates, but that is not the typical effect of monetary expansion.
- Forgetting the link through interest rates: lower interest rates from QE reduce demand for the currency.
- Thinking that QE only affects one value and not the other; the question tests the simultaneous effect.
Things to Be Careful About
- The question asks for the 'most likely' effect, so general equilibrium effects are considered; there could be exceptional cases (e.g., if QE boosts growth so much that it attracts capital inflows), but the standard expectation is depreciation and inflation.
- The internal value is about the price level, not the value of the dollar relative to other currencies. Keep the two concepts separate.
- In the context of the US dollar as a global reserve currency, there might be some nuances, but the question is testing basic theory.
When will a balance of payments deficit create the most demand-pull inflationary pressure in an economy with a floating exchange rate?
Options
| price elasticity of demand for exports | unemployment rate | |
|---|---|---|
| A | elastic | high |
| B | elastic | low |
| C | inelastic | high |
| D | inelastic | low |
Reasoning
A balance of payments deficit under a floating exchange rate causes the currency to depreciate. A depreciation makes exports cheaper in foreign currency and imports dearer in domestic currency. For demand-pull inflationary pressure to be created, the depreciation must boost net exports (and hence aggregate demand) significantly, and the economy must be operating near or at full capacity so that the rise in AD translates into rising prices rather than rising output.
- Price elasticity of demand for exports: If demand for exports is elastic, the percentage increase in export volume will be greater than the percentage fall in export price, so export revenue rises. This gives a larger boost to AD. If demand is inelastic, export revenue falls, dampening the expansionary effect.
- Unemployment rate: A low unemployment rate indicates the economy is close to full employment. An increase in AD in this situation will mainly raise the price level (demand-pull inflation) rather than real output. A high unemployment rate means there is spare capacity, so the same AD increase would raise output more and prices less.
Therefore, the combination that creates the most demand-pull inflationary pressure is elastic export demand (to maximise the AD boost) and low unemployment (to ensure the AD boost translates into inflation).
Answer
B
B
Background Concept
This question tests two interconnected macroeconomic mechanisms: the effect of a balance of payments deficit on the exchange rate, and the transmission of a depreciation into domestic inflation.
Under a floating exchange rate system, the exchange rate is determined by market forces of demand and supply for the currency. A balance of payments deficit means there is a net outflow of currency (more domestic currency being sold to buy foreign currency for imports, or for capital outflows, than is being bought for exports or capital inflows). This excess supply of the domestic currency causes it to depreciate (fall in value) against foreign currencies.
A depreciation has two immediate price effects:
- Exports become cheaper for foreign buyers (in their own currency).
- Imports become more expensive for domestic buyers (in domestic currency).
This changes the relative prices of domestic and foreign goods, which should, in theory, improve the trade balance over time (the J-curve effect). The improvement in net exports is an injection into the circular flow of income, increasing Aggregate Demand (AD).
Demand-pull inflation occurs when AD rises faster than the economy's capacity to produce goods and services. The key determinant of whether an AD increase causes inflation or real output growth is the position of the economy on its Aggregate Supply (AS) curve. If the economy has spare capacity (high unemployment), the AS curve is relatively flat, and an AD increase raises real output with little price effect. If the economy is near full capacity (low unemployment), the AS curve is steep, and the same AD increase mainly raises the price level.
Price elasticity of demand for exports (PED) determines how much export revenue changes following a price change. If PED > 1 (elastic), the percentage increase in quantity demanded exceeds the percentage fall in price, so total export revenue rises. If PED < 1 (inelastic), the quantity response is proportionally smaller, and total export revenue falls. A larger rise in export revenue means a larger injection into AD.
Understanding the Question
The question asks: "When will a balance of payments deficit create the most demand-pull inflationary pressure in an economy with a floating exchange rate?"
It provides a matrix with two variables, each with two possible states:
- Price elasticity of demand for exports: elastic or inelastic.
- Unemployment rate: high or low.
We must identify which combination (A, B, C, or D) produces the strongest demand-pull inflationary effect. This is not asking whether inflation occurs at all, but which scenario maximises it.
The question is an MCQ, so we need to reason through each variable independently and then combine them.
Approach
- Trace the causal chain: Balance of payments deficit -> currency depreciation -> exports cheaper -> quantity of exports demanded rises -> net exports rise -> AD rises -> if economy is at/near full capacity -> demand-pull inflation.
- Analyse the first variable (PED for exports): Determine whether elastic or inelastic demand leads to a larger increase in export revenue (and thus AD).
- Analyse the second variable (unemployment rate): Determine whether high or low unemployment means the AD increase translates more into inflation rather than output.
- Combine the two: The scenario with the largest AD boost AND the greatest transmission into prices will produce the most demand-pull inflation.
Step-by-Step Reasoning
Step 1: The depreciation and its effect on export revenue
A depreciation makes exports cheaper. The change in export revenue depends on PED:
- If PED is elastic (>1): The % increase in quantity demanded > % decrease in price. Therefore, total export revenue rises. This is a larger injection into AD.
- If PED is inelastic (<1): The % increase in quantity demanded < % decrease in price. Therefore, total export revenue falls. This is a smaller (or negative) injection into AD.
So, for a given depreciation, an elastic demand for exports gives a larger boost to AD than an inelastic demand.
Step 2: The effect of the unemployment rate on the inflation-output trade-off
The unemployment rate is a proxy for the amount of spare capacity in the economy:
- High unemployment: There is a lot of spare capacity (labour and capital are underutilised). The AS curve is relatively flat in the Keynesian range. An increase in AD will mainly increase real output (GDP) and employment, with only a small rise in the price level.
- Low unemployment: The economy is near or at full employment. The AS curve is steep (or vertical in the classical range). An increase in AD will mainly increase the price level (demand-pull inflation), with little increase in real output.
So, for a given increase in AD, a low unemployment rate means more of that increase translates into inflation.
Step 3: Combine the two variables
To maximise demand-pull inflationary pressure, we need:
- The largest possible increase in AD (from the depreciation). This requires elastic export demand.
- The greatest transmission of that AD increase into prices. This requires low unemployment.
Therefore, the combination is elastic demand for exports AND low unemployment rate. This corresponds to option B.
Step 4: Verify the other options
- A (elastic, high unemployment): Large AD boost, but much of it is absorbed by increased output rather than prices. Less inflationary than B.
- C (inelastic, high unemployment): Small (or negative) AD boost, and most of that small boost goes into output. Very little inflation.
- D (inelastic, low unemployment): Small AD boost, but what little boost there is translates into prices. This could cause some inflation, but less than B because the initial AD boost is smaller.
Key Takeaways
- A balance of payments deficit under a floating exchange rate leads to a depreciation, which can be expansionary.
- The size of the expansionary effect depends on the price elasticity of demand for exports and imports (the Marshall-Lerner condition).
- Whether an expansionary shock causes inflation or real growth depends on the position of the economy on its AS curve, proxied by the unemployment rate.
- This question combines microeconomic elasticity concepts with macroeconomic AD/AS analysis.
Common Mistakes
- Confusing the direction of the exchange rate change: A deficit leads to a depreciation (fall in value), not an appreciation. Some students might incorrectly think the currency strengthens.
- Confusing PED for exports with PED for imports: The question specifically asks about exports. The Marshall-Lerner condition involves both, but here only exports are given.
- Thinking high unemployment causes inflation: High unemployment means spare capacity, which is deflationary (or disinflationary), not inflationary. The mistake is to associate "high unemployment" with "bad economy" and therefore "inflation", but the mechanism is the opposite.
- Forgetting the two-stage logic: Some students might correctly identify that elastic demand gives a bigger AD boost, but then pick "high unemployment" thinking that a bigger boost needs more room to grow, missing that the question asks for inflationary pressure, not output growth.
Things to Be Careful About
- Read the question carefully: it asks for the combination that creates the most demand-pull inflationary pressure, not just any inflationary pressure.
- Treat each variable independently before combining them. The PED affects the size of the AD shock; the unemployment rate affects the transmission of that shock into prices.
- Remember that under a floating exchange rate, the exchange rate adjusts automatically to correct a balance of payments deficit. The question is about the side effects of that adjustment process.
- The correct answer (B) is the only option where both variables are in the direction that maximises inflation: elastic (maximises the AD boost) and low unemployment (maximises the price response).
The table gives an economy’s unemployment rate and inflation rate for a five-year period.
| year | unemployment rate % | inflation rate % |
|---|---|---|
| 1 | 7.6 | 2.6 |
| 2 | 6.2 | 1.6 |
| 3 | 5.8 | 1.8 |
| 4 | 5.9 | 2.0 |
| 5 | 5.8 | 2.0 |
Which change between consecutive years was in agreement with the Phillips curve analysis?
Options
A year 1 to year 2
B year 2 to year 3
C year 3 to year 4
D year 4 to year 5
Reasoning
The Phillips curve shows an inverse relationship between unemployment and inflation: as one falls, the other rises, and vice versa.
- Year 1 to year 2: unemployment falls from 7.6% to 6.2% (down), inflation falls from 2.6% to 1.6% (down). Both move in the same direction — not an inverse relationship.
- Year 2 to year 3: unemployment falls from 6.2% to 5.8% (down), inflation rises from 1.6% to 1.8% (up). Inverse relationship — consistent with the Phillips curve.
- Year 3 to year 4: unemployment rises from 5.8% to 5.9% (up), inflation rises from 1.8% to 2.0% (up). Both move in the same direction — not inverse.
- Year 4 to year 5: unemployment falls from 5.9% to 5.8% (down), inflation stays at 2.0% (unchanged). No inverse relationship.
Only year 2 to year 3 shows the inverse relationship.
Answer
B
B
Background Concept
The Phillips curve, originally observed by A.W. Phillips, describes an inverse (trade-off) relationship between the rate of unemployment and the rate of inflation in an economy. In the short run, when aggregate demand increases, unemployment tends to fall (as firms hire more workers) and inflation tends to rise (as wages and prices are bid up). Conversely, when aggregate demand falls, unemployment rises and inflation falls. This inverse relationship is the core of traditional Phillips curve analysis. The expectations-augmented Phillips curve adds the role of inflation expectations, but the basic inverse relationship still holds in the short run.
Understanding the Question
This question provides a table of unemployment rates and inflation rates for five consecutive years. It asks which change between consecutive years (year 1→2, 2→3, 3→4, or 4→5) is "in agreement with the Phillips curve analysis." This means we must identify the year-pair where unemployment and inflation move in opposite directions (one rises while the other falls). The data is given, so we simply compare each pair.
Approach
For each consecutive year pair:
- Determine the direction of change in the unemployment rate (up, down, or unchanged).
- Determine the direction of change in the inflation rate (up, down, or unchanged).
- Check if the two changes are opposite (one up, one down). If yes, it agrees with the Phillips curve. If they move together or one is unchanged, it does not.
Step-by-Step Reasoning
-
Year 1 to Year 2:
- Unemployment: 7.6% → 6.2% (decrease)
- Inflation: 2.6% → 1.6% (decrease)
- Both decreased. This is a positive correlation, not the inverse relationship predicted by the Phillips curve. So this pair does NOT agree.
-
Year 2 to Year 3:
- Unemployment: 6.2% → 5.8% (decrease)
- Inflation: 1.6% → 1.8% (increase)
- Unemployment fell while inflation rose. This is exactly the inverse relationship the Phillips curve describes. So this pair DOES agree.
-
Year 3 to Year 4:
- Unemployment: 5.8% → 5.9% (increase)
- Inflation: 1.8% → 2.0% (increase)
- Both increased. Again, a positive correlation, not inverse. Does NOT agree.
-
Year 4 to Year 5:
- Unemployment: 5.9% → 5.8% (decrease)
- Inflation: 2.0% → 2.0% (no change)
- Unemployment fell but inflation was unchanged. No inverse relationship. Does NOT agree.
Only the change from year 2 to year 3 shows the inverse relationship, so option B is correct.
Key Takeaways
- The Phillips curve predicts an inverse (trade-off) relationship between unemployment and inflation in the short run.
- To test this with data, look for pairs where one variable rises while the other falls.
- If both move in the same direction, or one is unchanged, the data does not support the Phillips curve for that period.
Common Mistakes
- Confusing the direction: thinking that both falling or both rising is the trade-off. The trade-off is opposite directions.
- Not checking all four pairs carefully — it is easy to misread the table.
- Overcomplicating: this is a straightforward data-reading question; no need to bring in the long-run Phillips curve or expectations.
Things to Be Careful About
- Read the table accurately: note the exact percentages and the direction of change.
- Remember that the Phillips curve relationship is about the change in both variables, not their absolute levels.
- The question asks for "agreement with the Phillips curve analysis" — this refers to the traditional short-run inverse relationship, not the long-run vertical Phillips curve.
The diagram shows the international trading position of a country that had tariffs on imports. The country removed the tariffs on imports.
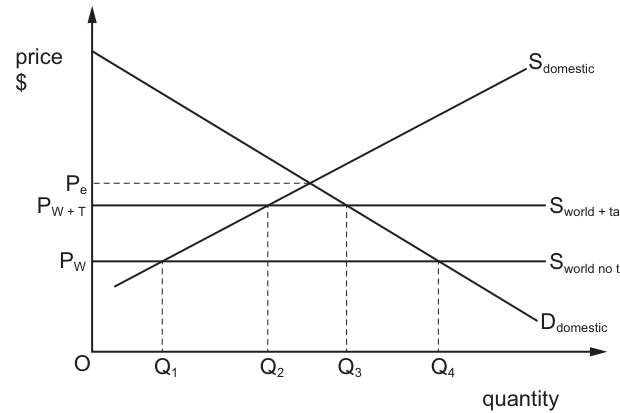
What was the change in imports into this country resulting from the removal of the tariffs?
Options
A Q1Q4
B Q1Q4 – Q1Q2
C Q1Q4 – Q1Q3
D Q1Q4 – Q2Q3
Working
Imports are equal to domestic demand minus domestic supply at the prevailing domestic price.
- With the tariff in place, the domestic price is PW + T. At this price, domestic supply is Q2 and domestic demand is Q3, so imports = Q3 - Q2 (the quantity Q2Q3).
- After the tariff is removed, the domestic price falls to PW. At this price, domestic supply is Q1 and domestic demand is Q4, so imports = Q4 - Q1 (the quantity Q1Q4).
- The change in imports is the new import quantity minus the original import quantity: (Q4 - Q1) - (Q3 - Q2) = Q1Q4 - Q2Q3.
Answer
D
D
Background Concept
This question relies on the standard small-country model of international trade, where a country is assumed to be a price taker in world markets (it cannot influence the world price of the imported good). In this model, the domestic price of the good is determined by the world price plus any trade barriers (such as tariffs) imposed by the government. A tariff is a tax levied on each unit of an imported good, which raises the domestic price above the world price. The quantity of imports is the difference between the quantity of the good that domestic consumers want to buy (domestic demand) and the quantity that domestic producers are willing to supply (domestic supply) at the prevailing domestic price, because imports fill this gap between domestic demand and supply.
Understanding the Question
The question provides a diagram showing the domestic market for a good in a country that initially imposes a tariff on imports. The diagram labels the world price without the tariff as PW, the world price plus the tariff as PW + T, domestic supply as Sdomestic, and domestic demand as Ddomestic, with four quantity markers (Q1 to Q4) showing the quantities supplied and demanded at each price. The question asks for the change in the quantity of imports when the tariff is removed. The options are expressed as differences between the labelled quantity segments on the horizontal axis. This is a 1-mark multiple-choice question that tests the ability to apply the import demand model to a policy change, requiring interpretation of the diagram and basic arithmetic to calculate the change in import quantity.
Approach
To answer this question, follow these steps:
- First, calculate the original quantity of imports when the tariff is in place. Use the higher domestic price (PW + T) to find the quantity supplied by domestic producers and the quantity demanded by domestic consumers at that price. Imports are the difference between these two quantities.
- Next, calculate the new quantity of imports after the tariff is removed. Use the lower world price (PW) to find the new domestic supply and domestic demand quantities, then find the difference between them to get the new import quantity.
- Calculate the change in imports by subtracting the original import quantity from the new import quantity. Match this result to the given options.
Step-by-Step Reasoning
- Original imports with the tariff: The tariff raises the domestic price to PW + T. At this price:
- Domestic producers are willing to supply Q2 (the quantity where the Sdomestic curve intersects the PW + T line).
- Domestic consumers demand Q3 (the quantity where the Ddomestic curve intersects the PW + T line).
- Since domestic demand (Q3) exceeds domestic supply (Q2), the difference is made up by imports. So original imports = Q3 - Q2, which is the length of the segment Q2Q3.
- New imports without the tariff: Removing the tariff lowers the domestic price to the world price PW. At this lower price:
- Domestic producers are willing to supply Q1 (the quantity where Sdomestic intersects PW), which is lower than Q2 because the lower price reduces the incentive to produce.
- Domestic consumers demand Q4 (the quantity where Ddomestic intersects PW), which is higher than Q3 because the lower price increases the quantity demanded.
- The gap between domestic demand (Q4) and domestic supply (Q1) is now larger, so new imports = Q4 - Q1, which is the length of the segment Q1Q4.
- Calculate the change in imports: The change in a variable is the new value minus the original value. So change in imports = new imports - original imports = (Q4 - Q1) - (Q3 - Q2). Since Q1Q4 represents the length Q4 - Q1 and Q2Q3 represents the length Q3 - Q2, this can be written as Q1Q4 - Q2Q3, which matches option D.
- Eliminate other options:
- Option A (Q1Q4) is the new import quantity, not the change in imports.
- Option B (Q1Q4 - Q1Q2) simplifies to Q4 - Q2, which has no economic meaning in this context.
- Option C (Q1Q4 - Q1Q3) simplifies to Q4 - Q3, which is the increase in domestic demand, not the change in total imports.
Key Takeaways
- A tariff is a tax on imports that raises the domestic price, reducing import quantity by increasing domestic supply and decreasing domestic demand.
- Import quantity in a small country is always equal to domestic demand minus domestic supply at the prevailing domestic price.
- When calculating the change in a variable, always subtract the original value from the new value to get the correct sign and magnitude.
- Segment labels on a quantity axis represent the difference between the two endpoint quantities (e.g., Q1Q4 = Q4 - Q1).
Common Mistakes
- Confusing import quantity with domestic supply or demand: Imports are the gap between the two, not the quantity produced or consumed domestically.
- Reversing the subtraction: Calculating original imports minus new imports would give a negative value, which does not match any of the positive options.
- Misidentifying the quantities at each price: For example, using Q3 as the import quantity with the tariff, rather than the difference Q3 - Q2.
- Selecting option A, which is the final import quantity, not the change from the original level.
Things to Be Careful About
- Always match the correct price to the correct policy: the higher price PW + T applies when the tariff is in place, and the lower price PW applies after the tariff is removed.
- Remember that the labels Q1Q4, Q2Q3 etc. refer to the length of the segment between the two quantities, not the product of the two quantities.
- Ensure you calculate the change in imports, not the change in domestic supply, domestic demand, or the total quantity consumed.
What would be the most effective long-term solution to a persistent deficit on the current account of the balance of payments?
Options
A to increase borrowing from foreign financial institutions
B to persuade foreign firms to increase direct investment in the economy
C to revalue the currency to make it stronger on foreign exchange markets
D to reduce the reserves of foreign exchange to zero
Reasoning
A persistent current account deficit means the country is spending more on imports than it earns from exports. Long-term correction requires improving the competitiveness of export industries or attracting foreign investment that boosts productive capacity.
- Option A: Borrowing from foreign institutions provides temporary financing but does not address the underlying deficit; it increases external debt.
- Option B: Persuading foreign firms to increase direct investment (FDI) brings capital inflows that finance the deficit in the short run and, more importantly, can expand export capacity and improve productivity, leading to a sustainable improvement in the current account over time.
- Option C: Revaluation makes exports more expensive and imports cheaper, worsening the current account deficit in the short run and, unless the economy is at full capacity with strong export demand, does not provide a long-term solution.
- Option D: Reducing foreign exchange reserves can only finance the deficit temporarily; reserves are finite and cannot be reduced to zero without causing a crisis.
Therefore, the most effective long-term solution is to attract FDI, which can improve the supply side of the economy and enhance export performance.
Answer
B
B
Background Concept
The balance of payments records all transactions between residents of a country and the rest of the world. It has two main accounts: the current account (trade in goods and services, income, and transfers) and the financial account (capital flows, including foreign direct investment, portfolio investment, and borrowing). A persistent current account deficit means the country is a net borrower from the rest of the world. To correct this deficit in the long run, the economy must either increase its export competitiveness or reduce its reliance on imports. Short-term measures (borrowing, using reserves) only postpone the adjustment.
Understanding the Question
The question asks for the "most effective long-term solution" to a persistent current account deficit. The key word is "long-term" — the solution must address the root cause, not just finance the deficit temporarily. Each option is a possible policy response, but only one offers a sustainable improvement.
Approach
Evaluate each option against the criterion of long-term effectiveness. Consider whether the option merely finances the deficit (short-term) or actually improves the current account balance by boosting exports or reducing imports over time.
Step-by-Step Reasoning
-
Option A (borrowing from foreign financial institutions): This increases the financial account inflow, offsetting the current account deficit in the balance of payments. However, it does nothing to change the underlying trade imbalance. The borrowed funds must be repaid with interest, worsening the current account in the future. This is a short-term fix, not a long-term solution.
-
Option B (persuading foreign firms to increase direct investment): Foreign direct investment (FDI) involves foreign firms building factories, acquiring companies, or expanding operations in the domestic economy. FDI brings capital inflows that finance the current account deficit in the short run. More importantly, FDI can transfer technology, improve productivity, and increase the country's export capacity. Over time, this can lead to higher exports and a more competitive economy, helping to reduce the current account deficit sustainably. This addresses the root cause.
-
Option C (revaluation of the currency): Revaluation makes the domestic currency stronger, so exports become more expensive for foreign buyers and imports become cheaper. This would likely worsen the current account deficit in the short run (unless demand is very inelastic). In the long run, if the economy is at full capacity and has strong export demand, revaluation might reduce inflationary pressure and encourage firms to become more efficient, but this is uncertain and often counterproductive. Revaluation is not a reliable long-term solution for a persistent deficit.
-
Option D (reducing foreign exchange reserves): The central bank can sell foreign exchange reserves to buy domestic currency, supporting the exchange rate and financing the deficit. However, reserves are finite; reducing them to zero would deplete the country's ability to intervene and could trigger a currency crisis. This is a temporary measure, not a long-term solution.
Thus, only option B offers a genuine long-term improvement by enhancing the supply side of the economy.
Key Takeaways
- A persistent current account deficit requires structural policies to improve competitiveness, not just financing.
- Foreign direct investment can improve the current account in the long run by boosting export capacity.
- Short-term measures (borrowing, using reserves) do not correct the underlying imbalance.
- Exchange rate changes may have short-run effects but are not a guaranteed long-term solution.
Common Mistakes
- Confusing the current account with the overall balance of payments: a deficit can be financed by capital inflows, but that does not solve the problem.
- Thinking that revaluation always helps a deficit: revaluation makes exports more expensive, worsening the deficit unless the Marshall-Lerner condition holds and there is spare capacity.
- Assuming that borrowing is a solution: it only postpones the adjustment and increases debt.
Things to Be Careful About
- The question specifies "long-term solution" — focus on sustainability.
- Understand the difference between financing (financial account) and correcting (current account).
- FDI is a supply-side policy that can improve productivity and export competitiveness over time.
A country has a deficit on the current account of the balance of payments. The government can try to reduce this deficit by using either an expenditure-switching policy or an expenditure-reducing policy.
Under which conditions will an expenditure-reducing policy be more successful than an expenditure-switching policy?
Options
| price elasticity of demand for imports | price elasticity of demand for exports | marginal propensity to import | |
|---|---|---|---|
| A | 0.2 | 0.2 | 0.1 |
| B | 0.2 | 0.2 | 0.4 |
| C | 0.6 | 0.2 | 0.1 |
| D | 0.6 | 0.6 | 0.4 |
Reasoning
An expenditure-reducing policy (e.g. contractionary fiscal or monetary policy) reduces national income, which reduces the demand for imports. Its success depends on a high marginal propensity to import (MPM), so that a given fall in income causes a large fall in import spending.
An expenditure-switching policy (e.g. devaluation) makes imports more expensive and exports cheaper. Its success depends on high price elasticities of demand for both imports and exports (the Marshall-Lerner condition: PEDx + PEDm > 1).
The question asks when the expenditure-reducing policy is more successful. This occurs when the MPM is high (so the income effect on imports is strong) AND the elasticities are low (so the switching policy is weak).
Option B: PEDm = 0.2, PEDx = 0.2 (very low, so switching fails), MPM = 0.4 (high, so reducing works well). This is the combination that makes the reducing policy relatively more successful.
Answer
B
B
Background Concept
A current account deficit means a country is spending more on imports than it earns from exports. Two broad policy approaches exist to correct this:
-
Expenditure-switching policies aim to shift domestic and foreign spending away from imports and towards domestically produced goods and exports. The classic example is a devaluation (or depreciation) of the exchange rate. This makes imports more expensive in domestic currency and exports cheaper in foreign currency. For this to improve the current account, the Marshall-Lerner condition must hold: the sum of the price elasticities of demand for exports and imports must be greater than 1 (PEDx + PEDm > 1). If elasticities are low, the volume response is weak and devaluation may worsen the deficit initially (the J-curve effect).
-
Expenditure-reducing policies aim to reduce the total level of spending (aggregate demand) in the economy. Contractionary fiscal policy (higher taxes, lower government spending) or monetary policy (higher interest rates) reduces national income. Since imports are a function of income (M = MPM x Y), a fall in income directly reduces import spending. The effectiveness of this policy depends on the marginal propensity to import (MPM): the fraction of each additional unit of income spent on imports. A higher MPM means a given reduction in income produces a larger fall in imports.
Understanding the Question
The question presents a scenario: a country has a current account deficit. The government can use either an expenditure-switching policy (like devaluation) or an expenditure-reducing policy (like contractionary demand management). The question asks: under which combination of conditions (given by the table of PEDm, PEDx, and MPM values) will the expenditure-reducing policy be more successful than the expenditure-switching policy?
This is a comparative effectiveness question. We are not asked whether either policy works in isolation, but which one works better relative to the other. The answer depends on identifying the conditions that make one policy strong and the other weak.
Approach
- Identify what makes each policy successful.
- For expenditure-switching (devaluation): success requires high PEDm and PEDx (Marshall-Lerner condition). Low elasticities mean it fails.
- For expenditure-reducing: success requires a high MPM, so that reducing income has a large effect on imports.
- The reducing policy is more successful when it is strong (high MPM) AND the switching policy is weak (low elasticities).
- Evaluate each option against this logic.
Step-by-Step Reasoning
Step 1: Assess the switching policy for each option.
- Option A: PEDm = 0.2, PEDx = 0.2. Sum = 0.4. Marshall-Lerner condition fails (0.4 < 1). Devaluation would worsen the deficit. Switching policy is ineffective.
- Option B: PEDm = 0.2, PEDx = 0.2. Sum = 0.4. Same as A. Switching fails.
- Option C: PEDm = 0.6, PEDx = 0.2. Sum = 0.8. Still less than 1. Switching fails.
- Option D: PEDm = 0.6, PEDx = 0.6. Sum = 1.2. Marshall-Lerner condition holds (1.2 > 1). Devaluation would improve the deficit. Switching policy is effective.
Step 2: Assess the reducing policy for each option.
- Option A: MPM = 0.1 (low). A reduction in income reduces imports only a little. Reducing policy is weak.
- Option B: MPM = 0.4 (high). A reduction in income reduces imports substantially. Reducing policy is strong.
- Option C: MPM = 0.1 (low). Reducing policy is weak.
- Option D: MPM = 0.4 (high). Reducing policy is strong.
Step 3: Compare the two policies for each option.
- Option A: Switching fails (low elasticities). Reducing is weak (low MPM). Neither works well. The reducing policy is not clearly more successful.
- Option B: Switching fails (low elasticities). Reducing is strong (high MPM). The reducing policy is clearly more successful.
- Option C: Switching fails (low elasticities). Reducing is weak (low MPM). Neither works well. The reducing policy is not clearly more successful.
- Option D: Switching works (high elasticities). Reducing is strong (high MPM). Both could work. The question asks when reducing is more successful. Here, switching is also effective, so reducing is not necessarily the better choice. The switching policy directly targets the price mechanism and may have fewer side effects (like causing unemployment). So D does not satisfy the condition.
Step 4: Conclusion.
Only Option B combines a weak switching policy (low elasticities) with a strong reducing policy (high MPM). This is the condition under which the expenditure-reducing policy is more successful than the expenditure-switching policy.
Key Takeaways
- The effectiveness of devaluation depends on price elasticities (Marshall-Lerner condition).
- The effectiveness of expenditure-reducing policies depends on the marginal propensity to import.
- Comparative policy questions require evaluating the strengths and weaknesses of each policy under given conditions.
- A policy is 'more successful' when it works well while the alternative works poorly.
Common Mistakes
- Only checking one policy: Some students might check only the Marshall-Lerner condition and pick D, forgetting to compare the two policies.
- Misinterpreting 'more successful': The question is comparative, not absolute. Option D has both policies working, but the reducing policy is not necessarily more successful than the switching policy.
- Confusing MPM with elasticities: The MPM is about income responsiveness, not price responsiveness. A high MPM helps the reducing policy, not the switching policy.
- Ignoring the 'more successful' condition: Students might pick the option where the reducing policy works best in isolation (D has high MPM), without checking whether the switching policy also works.
Things to Be Careful About
- Read the question carefully: it asks when the reducing policy is more successful, not when it is successful at all.
- Remember the Marshall-Lerner condition: PEDx + PEDm > 1 for devaluation to improve the current account.
- The MPM is a key parameter for expenditure-reducing policies; a low MPM means the policy has little effect on the trade balance.
- In comparative questions, always evaluate both sides of the comparison.
The table gives the values for an economy’s short-run and long-run elasticities of demand for exports and imports.
In which circumstance does depreciation lead to a J curve where the current account of the balance of payments worsens in the short run and improves in the long run?
Options
| short-run elasticity of demand for exports | short-run elasticity of demand for imports | long-run elasticity of demand for exports | long-run elasticity of demand for imports | |
|---|---|---|---|---|
| A | 0.5 | 0.2 | 0.6 | 0.6 |
| B | 0.5 | 0.6 | 1.2 | 1.0 |
| C | 0.6 | 0.6 | 0.5 | 0.2 |
| D | 1.2 | 1.0 | 0.5 | 0.6 |
Reasoning
The J-curve describes the current account initially worsening after a depreciation, then improving in the long run. For the long-run improvement, the Marshall-Lerner condition must be satisfied: the sum of the long-run elasticities of demand for exports and imports must be greater than 1.
Check each option:
-
A: Long-run export elasticity = 0.6, long-run import elasticity = 0.6. Sum = 1.2 > 1. Condition satisfied. Short-run elasticities are both low (0.5 and 0.2), so the initial response is inelastic, causing the current account to worsen first. This matches the J-curve.
-
B: Long-run sum = 1.2 + 1.0 = 2.2 > 1. Condition satisfied. However, short-run elasticities (0.5 and 0.6) sum to 1.1 > 1, so the Marshall-Lerner condition is already met in the short run. The current account would improve immediately, not worsen first. No J-curve.
-
C: Long-run sum = 0.5 + 0.2 = 0.7 < 1. Condition not satisfied. The current account would not improve in the long run.
-
D: Long-run sum = 0.5 + 0.6 = 1.1 > 1. Condition satisfied. However, short-run elasticities (1.2 and 1.0) sum to 2.2 > 1, so the current account improves immediately. No J-curve.
Only option A has low short-run elasticities (sum < 1, causing initial worsening) and high enough long-run elasticities (sum > 1, causing eventual improvement).
Answer
A
A
Background Concept
The J-curve effect describes the time path of a country's current account balance following a depreciation (or devaluation) of its currency. Immediately after depreciation, the prices of exports and imports change, but the quantities traded adjust slowly due to contracts, habits, and production lags. In the very short run, the current account often worsens because the value of imports (now more expensive in domestic currency) rises immediately, while the value of exports (now cheaper in foreign currency) does not increase much. Over time, as consumers and firms adjust, export volumes rise and import volumes fall, and the current account improves.
The Marshall-Lerner condition states that for a depreciation to improve the current account in the long run, the sum of the price elasticities of demand for exports and imports must be greater than 1. If the sum is less than 1, the current account will worsen permanently. If the sum is exactly 1, there is no change.
For the J-curve pattern to occur, two conditions must hold simultaneously:
- In the short run, the sum of elasticities is less than 1 (so the current account worsens initially).
- In the long run, the sum of elasticities becomes greater than 1 (so the current account eventually improves).
This question tests the ability to apply both concepts to a table of elasticity values.
Understanding the Question
The question provides a table with four options (A, B, C, D), each showing four elasticity values: short-run elasticity of demand for exports, short-run elasticity of demand for imports, long-run elasticity of demand for exports, and long-run elasticity of demand for imports. The task is to identify which set of values would produce a J-curve pattern: the current account worsens in the short run and improves in the long run.
The command word is "in which circumstance" — this is a multiple-choice question requiring selection of the correct option based on economic reasoning.
Approach
- Recall the J-curve pattern: short-run worsening, long-run improvement.
- Recall the Marshall-Lerner condition: long-run improvement requires sum of long-run elasticities > 1.
- For short-run worsening, the sum of short-run elasticities must be < 1 (so the initial price effect dominates the volume effect).
- Check each option against both conditions.
- Select the option where short-run sum < 1 AND long-run sum > 1.
Step-by-Step Reasoning
Step 1: Calculate the sum of short-run elasticities for each option.
- Option A: 0.5 + 0.2 = 0.7 (< 1, so short-run worsening is possible)
- Option B: 0.5 + 0.6 = 1.1 (> 1, so the current account would improve immediately — no J-curve)
- Option C: 0.6 + 0.6 = 1.2 (> 1, so the current account would improve immediately — no J-curve)
- Option D: 1.2 + 1.0 = 2.2 (> 1, so the current account would improve immediately — no J-curve)
Only option A has a short-run sum less than 1. This means that in the short run, the volume responses are too weak to offset the price effect, so the current account worsens.
Step 2: Calculate the sum of long-run elasticities for each option.
- Option A: 0.6 + 0.6 = 1.2 (> 1, so the Marshall-Lerner condition is satisfied — long-run improvement is possible)
- Option B: 1.2 + 1.0 = 2.2 (> 1, condition satisfied)
- Option C: 0.5 + 0.2 = 0.7 (< 1, condition NOT satisfied — the current account would worsen permanently)
- Option D: 0.5 + 0.6 = 1.1 (> 1, condition satisfied)
Step 3: Combine the conditions.
For the J-curve pattern, we need BOTH:
- Short-run sum < 1 (initial worsening)
- Long-run sum > 1 (eventual improvement)
Only option A satisfies both. Options B and D satisfy the long-run condition but not the short-run condition (their short-run sums are already > 1, so the current account improves from the start). Option C fails the long-run condition entirely.
Step 4: Verify option A in detail.
- Short-run export elasticity = 0.5 (inelastic demand for exports — a 10% fall in export prices leads to only a 5% rise in export volume, so export revenue falls)
- Short-run import elasticity = 0.2 (very inelastic demand for imports — a 10% rise in import prices leads to only a 2% fall in import volume, so import spending rises sharply)
- Result: export revenue falls and import spending rises, so the current account worsens.
- Long-run export elasticity = 0.6 (still inelastic, but higher than short-run)
- Long-run import elasticity = 0.6 (now more elastic)
- Sum = 1.2 > 1, so eventually the volume effects dominate: export revenue rises and import spending falls, improving the current account.
This is the classic J-curve pattern.
Key Takeaways
- The J-curve is a dynamic phenomenon: the current account's response to depreciation changes over time as elasticities increase.
- The Marshall-Lerner condition is a long-run condition; it does not guarantee short-run improvement.
- For the J-curve to occur, short-run elasticities must be low (sum < 1) and long-run elasticities must be high enough (sum > 1).
- In multiple-choice questions, always check both the short-run and long-run sums systematically.
Common Mistakes
- Applying the Marshall-Lerner condition to the short run: The condition is a long-run condition. Some students check only the long-run sum and forget to check the short-run sum, leading them to select option B or D.
- Confusing the direction of the condition: The condition is sum > 1 for improvement, not sum < 1. Option C has a long-run sum of 0.7, which would cause permanent worsening, not improvement.
- Misreading the table: The table has four columns, and it is easy to mix up which elasticity belongs to which period (short-run vs long-run) or which good (exports vs imports). Always label them clearly.
- Assuming that any depreciation causes a J-curve: The J-curve is not automatic; it depends on the specific elasticities. If short-run elasticities are already high, the current account improves immediately (no J-curve).
Things to Be Careful About
- The Marshall-Lerner condition uses the sum of the absolute values of the elasticities (ignoring the negative sign for demand elasticities). All elasticities in the table are positive numbers representing absolute values.
- The J-curve is about the current account balance, not the trade balance alone, but in this context they are treated as equivalent.
- The question asks for the circumstance where depreciation "leads to a J curve" — meaning the pattern is observed. Option A is the only one where the pattern occurs.
- Always check both the short-run and long-run conditions. A common trick in multiple-choice questions is to include options that satisfy only one of the two conditions.
Which combination of characteristics is usually associated with a low-income country?
Options
A high death rate and low levels of productivity
B high gross domestic product and low infant mortality
C low birth rate and a large proportion of income from primary industries
D low exports of capital and a large tertiary sector
Answer
Low-income countries typically have high death rates due to poor healthcare and nutrition, and low levels of productivity because of limited capital and technology. Option A correctly combines these two characteristics.
Answer
A
A
Background Concept
Low-income countries (also called developing or less developed countries) share a set of common characteristics that distinguish them from high-income (developed) countries. These include:
- Demographic indicators: high birth rates, high death rates, high infant mortality, low life expectancy.
- Economic indicators: low GDP per capita, low productivity, high dependence on primary sector (agriculture, mining), small industrial and service sectors.
- Trade and investment: low exports of capital goods, low foreign direct investment, often rely on commodity exports.
- Social indicators: low literacy, poor healthcare, high poverty.
Understanding the Question
The question asks which combination of characteristics is "usually associated with a low-income country." This is a straightforward recall question testing knowledge of the typical profile of a developing economy. Each option pairs two characteristics; we need to identify the pair that is both accurate and typical.
Approach
Evaluate each option against the known profile of low-income countries:
- Check each characteristic individually.
- Eliminate any option that contains a characteristic typical of high-income countries.
- Select the option where both characteristics fit the low-income profile.
Step-by-Step Reasoning
Option A: high death rate and low levels of productivity
- High death rate: Yes, low-income countries have poor healthcare, nutrition, and sanitation, leading to higher mortality.
- Low levels of productivity: Yes, due to limited capital, technology, and skilled labour.
- Both fit. This is a strong candidate.
Option B: high gross domestic product and low infant mortality
- High GDP: This is typical of high-income countries, not low-income ones.
- Low infant mortality: Also typical of high-income countries.
- Neither fits. Eliminate.
Option C: low birth rate and a large proportion of income from primary industries
- Low birth rate: This is typical of high-income countries (demographic transition). Low-income countries have high birth rates.
- Large proportion of income from primary industries: This is true for low-income countries.
- One fits, one does not. Eliminate.
Option D: low exports of capital and a large tertiary sector
- Low exports of capital: This could be true for low-income countries (they export primary goods, not capital goods).
- Large tertiary sector: This is typical of high-income countries (services dominate). Low-income countries have small tertiary sectors.
- One fits, one does not. Eliminate.
Only Option A has both characteristics that are typical of low-income countries.
Key Takeaways
- Low-income countries are characterised by high birth/death rates, low productivity, primary-sector dominance, and low capital exports.
- High-income countries have low birth/death rates, high productivity, large tertiary sectors, and high capital exports.
- When evaluating multiple-choice questions on development characteristics, check each part of the option independently.
Common Mistakes
- Confusing birth rate patterns: low-income countries have high birth rates, not low.
- Assuming a large tertiary sector is a sign of development (it is, but it is a characteristic of high-income countries).
- Thinking "low exports of capital" is unique to low-income countries — it is true, but it must be paired with another correct characteristic.
Things to Be Careful About
- Read each option carefully — both parts must be correct.
- Remember the demographic transition: low-income countries are in the early stages with high birth and death rates.
- Do not confuse "primary sector" (agriculture, mining) with "tertiary sector" (services).
How would a depreciation of the currency of a low-income economy be most likely to affect its macroeconomic policy objectives?
Options
| increasing the rate of growth | reducing the current account deficit | reducing the rate of unemployment | |
|---|---|---|---|
| A | yes | no | yes |
| B | yes | yes | yes |
| C | yes | yes | no |
| D | no | yes | yes |
Answer
A depreciation makes exports cheaper in foreign currency and imports dearer in domestic currency. This raises net exports, increasing aggregate demand. Higher AD raises real GDP (growth) and reduces demand-deficient unemployment. The improvement in net exports directly reduces the current account deficit. Therefore all three objectives are helped.
Answer
B
B
Background Concept
A depreciation of a currency means its value falls relative to other currencies. For a low-income economy, this has several predictable effects on its macroeconomic objectives. The key mechanism is the change in relative prices of traded goods: exports become cheaper for foreign buyers, and imports become more expensive for domestic consumers. This alters the balance of trade and aggregate demand.
Understanding the Question
This multiple-choice question asks which combination of three macroeconomic objectives — increasing the rate of growth, reducing the current account deficit, and reducing the rate of unemployment — would be helped by a currency depreciation. The answer is a row from the table: each row shows 'yes' or 'no' for each objective. The correct row is the one where all three are 'yes'.
Approach
Trace the effect of depreciation through each objective separately:
- Growth: Depreciation raises net exports (X-M), which is a component of AD. Higher AD, if the economy has spare capacity, raises real GDP.
- Current account deficit: Cheaper exports and dearer imports directly improve the trade balance, assuming the Marshall-Lerner condition holds (sum of PED for exports and imports > 1).
- Unemployment: Higher AD increases demand for labour, reducing demand-deficient unemployment.
All three are positively affected, so the correct row is B.
Step-by-Step Reasoning
- Growth: AD = C + I + G + (X-M). A depreciation makes exports cheaper, so foreign demand for exports rises. Imports become more expensive, so domestic consumers switch to domestic substitutes. Net exports (X-M) rises, shifting AD right. If the economy is below full employment, this raises real GDP — i.e., growth.
- Current account deficit: The current account balance = exports - imports + net income flows. The trade balance (exports - imports) improves directly because export revenue rises (volume effect) and import spending falls (volume and price effects). The Marshall-Lerner condition is typically satisfied for low-income economies with elastic demand for their exports and imports.
- Unemployment: Higher AD means firms produce more, so they hire more workers. This reduces demand-deficient (cyclical) unemployment. Structural unemployment is unaffected, but the question asks about the rate of unemployment overall, which falls.
All three objectives are helped, so the correct answer is B.
Key Takeaways
- A depreciation is an expansionary policy for an economy with spare capacity: it boosts AD and improves the trade balance.
- The three objectives of growth, current account balance, and unemployment are often complementary in the short run when the economy is below full employment.
- The Marshall-Lerner condition is the key assumption for the current account effect to be positive.
Common Mistakes
- Thinking that depreciation causes inflation (which it can, via higher import prices) and therefore harms growth — but the question asks about the most likely effect, and for a low-income economy with spare capacity, the growth effect dominates.
- Confusing depreciation with devaluation — they are similar in effect but occur under different exchange rate systems.
- Forgetting that the current account deficit is reduced only if the Marshall-Lerner condition holds, but the question assumes the typical case.
Things to Be Careful About
- The question specifies a 'low-income economy' — such economies often have elastic demand for exports (primary commodities) and imports (manufactures), so the Marshall-Lerner condition is likely to hold.
- The effects are not guaranteed in the very short run (J-curve effect), but the question asks for the 'most likely' effect, which is positive for all three objectives.
- The answer is B: all three objectives are helped.
What is least likely to improve as a result of the decision by high-income countries to increase their aid to low-income countries?
Options
A exchange rate of low-income countries
B financial account of the balance of payments of low-income countries
C political relationships between high-income and low-income countries
D reserves of foreign currencies held by low-income countries
Working
Aid from high-income countries is recorded as a transfer in the current account of the balance of payments, not in the financial account. The financial account records transactions in financial assets and liabilities, such as foreign direct investment, portfolio investment, and changes in reserves. While aid may increase foreign currency reserves (option D) and potentially improve the exchange rate (option A) and political relationships (option C), it does not directly improve the financial account. Therefore, the financial account is least likely to improve.
Answer
B
B
Background Concept
The balance of payments records all transactions between residents of one country and the rest of the world. It has two main accounts: the current account (which includes trade in goods and services, income, and unilateral transfers) and the financial account (which records transactions in financial assets, including foreign direct investment, portfolio investment, and changes in reserve assets). Foreign aid is a unilateral transfer and is recorded in the current account. The financial account reflects changes in ownership of financial assets; it does not typically record transfers.
Understanding the Question
The question asks which of the four options is least likely to improve when high-income countries increase their aid to low-income countries. "Improve" means to become more favourable or positive. We need to evaluate the likely effect of increased aid on each of the given indicators: the exchange rate, the financial account of the balance of payments, political relationships, and reserves of foreign currencies.
Approach
Consider each option in turn, using knowledge of how aid is recorded in the balance of payments and its macroeconomic effects. Identify the option that is not directly improved by the aid inflow. The correct answer is the one that is least likely to improve.
Step-by-Step Reasoning
-
Option D: Reserves of foreign currencies. Aid is typically provided in the form of foreign currency (e.g., US dollars) or goods that can be sold for foreign currency. This directly increases the low-income country's foreign currency reserves. Therefore, reserves are likely to improve.
-
Option A: Exchange rate of low-income countries. An inflow of foreign currency (from aid) increases the supply of foreign exchange or reduces the demand for it, depending on how the central bank manages the exchange rate. Under a floating exchange rate, the increased supply of foreign currency tends to appreciate the domestic currency. Under a fixed exchange rate, the central bank can use the reserves to maintain the peg. In either case, the exchange rate is likely to become stronger (improve) or at least more stable. So option A is likely to improve.
-
Option C: Political relationships between high-income and low-income countries. Aid is often given as part of diplomatic relations and can improve political ties between donor and recipient countries. It is very likely that political relationships improve. Thus option C is likely to improve.
-
Option B: Financial account of the balance of payments of low-income countries. The financial account records transactions in financial assets, such as foreign direct investment, portfolio investment, and changes in official reserve assets. Aid itself is a transfer, not a financial transaction; it is recorded in the current account. While aid might indirectly influence the financial account (e.g., if the aid is used to attract foreign investment), it does not directly improve the financial account. In fact, the financial account could even worsen if the aid is tied to conditions that increase liabilities. Therefore, the financial account is the least likely to improve among the four options.
Thus, the correct answer is B.
Key Takeaways
- Aid is a transfer and is recorded in the current account, not the financial account.
- The financial account captures investment flows and changes in reserve assets, not transfers.
- When evaluating the effects of aid, it is important to distinguish between direct and indirect effects and to understand the structure of the balance of payments.
Common Mistakes
- Confusing the financial account with the current account. Many students think that any inflow of foreign currency improves the financial account, but aid is a transfer, not a financial asset transaction.
- Assuming that aid always improves all macroeconomic indicators; in reality, its effects are nuanced and depend on how the aid is used and recorded.
Things to Be Careful About
- The balance of payments classification: aid is a unilateral transfer in the current account. Changes in reserves are part of the financial account, but the financial account itself is not directly improved by the aid inflow.
- The question asks for "least likely" – do not simply choose the option that seems negative; evaluate each logically.
- Remember that the financial account can be affected indirectly, but the question asks for the direct result of the decision to increase aid.
Your score so far
Answer a question to start scoring
Your marks add up here as you work through the paper.