Economics 9708/32 — May/June 2025
Cambridge A-Level · A Level Multiple Choice · answer key with instant marking and worked solutions
Topics Government Policies to Correct Market Failure · Wage Determination and Labour Market Intervention · Money and Banking · Macroeconomic Objectives and Policy Conflicts · Externalities, Social Costs and Benefits · Economic Growth and Sustainability · +18 more
Tap an option under each question to check it — your score builds as you go.
The diagram shows budget lines for an individual consumer.
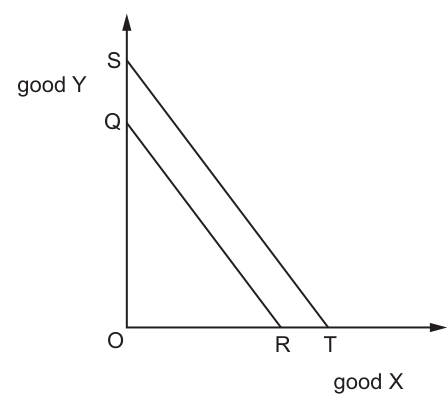
What could explain the shift in the budget line from QR to ST?
Options
A a decrease in the consumer’s real income
B a decrease in the quality of both goods
C an increase in the consumer’s money income
D an increase in the price of both goods
Answer
The shift from QR to ST is an outward parallel shift, meaning the consumer can now afford more of both goods X and Y while the slope (the relative price ratio) is unchanged. This occurs when the consumer's money income increases, raising both the X-intercept and the Y-intercept.
Answer
C
C
Background Concept
A budget line (or budget constraint) shows all combinations of two goods that a consumer can afford given their money income and the market prices of the goods. The equation of the budget line is Px × X + Py × Y = M, where Px and Py are the prices of goods X and Y, and M is money income.
The vertical intercept (where the line meets the Y-axis) equals M / Py — the maximum quantity of good Y the consumer could buy if they spent all their income on Y. The horizontal intercept (where the line meets the X-axis) equals M / Px — the maximum quantity of good X. The slope of the budget line is -Px / Py, which represents the relative price of the two goods, or the opportunity cost of one good in terms of the other.
A parallel shift of the budget line occurs when the slope does not change, meaning relative prices are unchanged. An outward parallel shift happens when M increases (or when both prices fall by the same proportion), because both intercepts rise. An inward parallel shift happens when M decreases (or when both prices rise by the same proportion). By contrast, a rotation of the budget line occurs when the price of only one good changes, altering the slope while one intercept stays fixed.
Understanding the Question
The question presents a diagram with two parallel budget lines. The inner line QR is the original budget constraint, and the outer line ST is the new one. The shift is outward and parallel. The question asks which of the four options could explain this specific change.
The four options test different potential causes: a change in real income (A), a change in product quality (B), a change in money income (C), and a change in the prices of both goods (D). The command word is implicit (identify/explain), and the task is to match the observed change in the diagram to the correct economic cause.
Approach
To answer this, first identify the nature of the shift: it is parallel (same slope) and outward (further from the origin). This immediately rules out any explanation involving a change in relative prices, because a change in the price of only one good would rotate the line. It also rules out an inward shift.
Next, test each option against the observed change:
- Option A suggests a decrease in real income. This would shift the budget line inward parallel, not outward.
- Option B suggests a decrease in quality. Quality is not a variable in the standard budget line model; it affects utility but not the affordability constraint.
- Option C suggests an increase in money income. With prices unchanged, higher income raises both intercepts equally, producing an outward parallel shift.
- Option D suggests an increase in the price of both goods. This would shift the budget line inward parallel, not outward.
Only option C matches the diagram.
Step-by-Step Reasoning
- The budget line equation is Px × X + Py × Y = M. The vertical intercept is M / Py and the horizontal intercept is M / Px.
- The diagram shows the budget line moving from QR to ST. Both the Y-intercept (from Q to S) and the X-intercept (from R to T) have increased.
- Because the two lines are parallel, their slopes are identical. The slope is -Px / Py, so the relative price of X in terms of Y has not changed. This means the price of one good has not changed relative to the other.
- An increase in both intercepts with unchanged slope can only be caused by an increase in M (money income), assuming prices are constant. Higher income allows the consumer to reach points further from the origin on both axes.
- Option A is incorrect because a decrease in income would shift the line inward to a position closer to the origin, such as from ST back to QR.
- Option B is incorrect because the quality of goods is not part of the budget constraint; it might shift an indifference curve but not the budget line.
- Option D is incorrect because an increase in the price of both goods would reduce both intercepts, shifting the budget line inward parallel, not outward.
- Therefore, the only valid explanation is an increase in the consumer's money income.
Key Takeaways
- The budget line is determined by money income and the prices of the two goods.
- A parallel shift signals that relative prices are unchanged; the shift is caused by a change in money income (or an equiproportionate change in both prices).
- An outward parallel shift means the consumer is better off in terms of purchasing power; an inward parallel shift means they are worse off.
- A rotation of the budget line is caused by a change in the price of exactly one good.
- Always check both the direction (outward vs inward) and the shape (parallel vs rotation) when interpreting budget line diagrams.
Common Mistakes
- Confusing a parallel shift with a rotation. Students sometimes think any change in prices shifts the line parallel, but a change in only one price rotates it.
- Getting the direction wrong. An increase in income shifts the line outward; a decrease shifts it inward. Option D describes a price increase, which would shift the line inward, not outward.
- Ignoring the slope. The fact that the lines are parallel is the crucial clue that relative prices have not changed.
- Overcomplicating the answer. The budget line model is a static, one-period model; quality changes or preferences do not shift the budget line itself.
Things to Be Careful About
- Verify that the shift is indeed parallel by checking that both intercepts move by the same proportion. In this diagram, both Q to S and R to T are outward movements.
- Distinguish between money income and real income. In this simple two-good model with constant prices, a change in money income is equivalent to a change in real income, but the direct cause of the parallel shift is the change in money income.
- Note that an increase in the price of both goods by the same proportion would also produce a parallel shift, but it would be inward, not outward. Therefore, option D is definitely wrong.
- Ensure you read the axes correctly: good Y is on the vertical axis and good X on the horizontal axis, so the vertical intercept relates to the price of Y and the horizontal intercept to the price of X.
When is allocative efficiency achieved?
Options
A when a perfectly competitive market is in equilibrium
B when everybody who needs the product can obtain it
C when firms produce at the lowest possible cost
D when monopolistic firms make normal profits
Answer
Allocative efficiency is achieved when it is impossible to make one person better off without making another person worse off (Pareto optimality). In a market, this occurs when price equals marginal cost (P = MC). A perfectly competitive market in long-run equilibrium satisfies P = MC because firms are price takers and produce where MC = MR = AR = P. Therefore, option A is correct.
Answer
A
A
Background Concept
Allocative efficiency is a key concept in welfare economics. It describes a situation where resources are distributed in a way that maximises the net benefit to society. The formal condition is that the price consumers are willing to pay for the last unit (which equals the marginal benefit to society) is exactly equal to the marginal cost of producing that unit. In symbols: P = MC. When this holds, society cannot reallocate resources to make anyone better off without making someone else worse off — this is the Pareto criterion.
Understanding the Question
The question asks: "When is allocative efficiency achieved?" It is a multiple-choice question with four options. The correct answer is the one that correctly states the condition under which allocative efficiency occurs. The distractors are plausible but incorrect statements that relate to other concepts (productive efficiency, equity, or normal profit).
Approach
Recall the precise definition of allocative efficiency and the market condition that guarantees it. Then evaluate each option against that definition.
Step-by-Step Reasoning
-
Definition: Allocative efficiency is achieved when P = MC. This means that the value consumers place on the last unit (the price they pay) equals the opportunity cost of producing it (marginal cost).
-
Option A: "when a perfectly competitive market is in equilibrium." In perfect competition, firms are price takers. In the short run, equilibrium occurs where P = MC (since firms maximise profit by producing where MR = MC, and MR = P). In the long run, entry and exit drive profits to normal, but P = MC still holds. So this option is correct.
-
Option B: "when everybody who needs the product can obtain it." This is a statement about equity or access, not efficiency. Allocative efficiency does not require universal access; it only requires that the marginal benefit equals marginal cost. Even if some people cannot afford the product, the market can still be allocatively efficient.
-
Option C: "when firms produce at the lowest possible cost." This describes productive efficiency, which occurs when firms produce at the minimum point of the average cost curve. Productive efficiency is a separate concept from allocative efficiency.
-
Option D: "when monopolistic firms make normal profits." A monopolist can make normal profits in the long run if barriers to entry are low, but it still produces where P > MC (since it faces a downward-sloping demand curve and MR < P). Therefore, allocative efficiency is not achieved.
Thus, only option A is correct.
Key Takeaways
- Allocative efficiency: P = MC.
- Perfect competition in equilibrium satisfies P = MC.
- Distinguish allocative efficiency from productive efficiency (lowest cost) and equity (universal access).
Common Mistakes
- Confusing allocative efficiency with productive efficiency (option C).
- Thinking that normal profit implies efficiency (option D). Normal profit is a long-run equilibrium condition in perfect competition, but it does not guarantee allocative efficiency in other market structures.
- Believing that equity (everyone can obtain the product) is the same as efficiency (option B).
Things to Be Careful About
- The question asks for the condition for allocative efficiency, not for productive efficiency or equity.
- In perfect competition, both short-run and long-run equilibrium satisfy P = MC, so option A is correct regardless of the time horizon.
- For a monopolist, even if it makes normal profit, P > MC, so allocative efficiency is not achieved.
A consumer spends all of their income on only two goods, X and Y. The consumer is initially in equilibrium, maximising their total utility. The consumer’s tastes change and they get less utility from consuming good Y. The prices of both goods are unchanged.
What would be a rational response from the consumer?
Options
| good X | good Y | |
|---|---|---|
| A | buy less | buy more |
| B | buy more | buy less |
| C | buy more | unchanged |
| D | unchanged | buy less |
Reasoning
The consumer maximises utility by allocating spending so that the marginal utility per dollar (MU/P) is equal for both goods. A fall in the utility from good Y reduces its marginal utility at every quantity. At the initial allocation, MUx/Px > MUy/Py. To restore equality, the consumer should buy less of Y (raising its MU as diminishing marginal utility reverses) and more of X (lowering its MU), until MUx/Px = MUy/Py again.
Answer
B
B
Background Concept
The equi-marginal principle states that a rational consumer maximises total utility from a given income by spending each unit of money on the good that gives the highest marginal utility per unit of currency. Formally, the consumer is in equilibrium when:
MUx / Px = MUy / Py
where MU is marginal utility and P is price. If this equality does not hold, the consumer can increase total utility by reallocating spending from the good with the lower MU/P to the good with the higher MU/P. This reallocation continues until the ratios are equal again, because of the law of diminishing marginal utility: as more of a good is consumed, its marginal utility falls, and as less is consumed, its marginal utility rises.
Understanding the Question
The question describes a consumer who initially spends all income on two goods, X and Y, and is in equilibrium (MUx/Px = MUy/Py). Then the consumer's tastes change: they get less utility from consuming good Y. This means the marginal utility of Y falls at every quantity. Prices of both goods are unchanged. The question asks what the rational response is — how should the consumer adjust their consumption of X and Y to restore utility maximisation?
Approach
- Recognise that the change in tastes reduces MUy at the initial quantity of Y.
- Compare the new MUy/Py with MUx/Px at the initial allocation.
- Apply the equi-marginal principle: the consumer should reallocate spending from the good with the lower MU/P to the good with the higher MU/P.
- Use the law of diminishing marginal utility to determine the direction of adjustment: buying less of Y raises its MU; buying more of X lowers its MU.
- Identify the option that matches this adjustment.
Step-by-Step Reasoning
-
Initial equilibrium: The consumer is maximising utility, so MUx/Px = MUy/Py.
-
The change: Tastes change, reducing the utility from good Y. This means the marginal utility of Y falls at every quantity. At the initial quantity of Y, MUy is now lower than before.
-
New MU/P ratios: Since MUy has fallen and Px and Py are unchanged, MUy/Py is now lower than before. At the initial allocation, MUx/Px > MUy/Py.
-
Restoring equilibrium: To maximise utility, the consumer should reallocate spending from the good with the lower MU/P (Y) to the good with the higher MU/P (X). This means:
- Buy less of Y: as consumption of Y falls, its marginal utility rises (due to diminishing marginal utility in reverse). This raises MUy/Py.
- Buy more of X: as consumption of X rises, its marginal utility falls. This lowers MUx/Px.
-
New equilibrium: The consumer continues to adjust until MUx/Px = MUy/Py again. The final outcome is that the consumer buys more of X and less of Y.
-
Matching the options: Option B states "buy more" of X and "buy less" of Y, which matches the rational response.
Key Takeaways
- The equi-marginal principle is the foundation of rational consumer choice: utility is maximised when the marginal utility per dollar is equal across all goods.
- A change in tastes changes marginal utilities, disrupting the equilibrium and requiring a reallocation of spending.
- The law of diminishing marginal utility explains why buying less of a good raises its marginal utility and buying more lowers it.
- This question tests the ability to apply a core microeconomic principle to a simple change in conditions.
Common Mistakes
- Choosing A (buy less of X, buy more of Y): This would be the response if the consumer got less utility from X, not Y. It reverses the direction of the change.
- Choosing C (buy more of X, unchanged Y): This ignores that the consumer must adjust both goods to restore the equality of MU/P. If only X is increased, MUx/Px falls but MUy/Py remains below it, so the consumer is not maximising utility.
- Choosing D (unchanged X, buy less of Y): This partially corrects the imbalance but does not fully restore equilibrium. The consumer could increase total utility further by also buying more of X.
- Confusing total utility with marginal utility: The change in tastes affects marginal utility, not just total utility. The consumer responds to the change in the marginal benefit of each good.
Things to Be Careful About
- The question specifies that the consumer gets "less utility from consuming good Y". This means the marginal utility of Y falls at every quantity, not that the consumer suddenly dislikes Y entirely.
- Prices are unchanged, so the adjustment is entirely through quantities.
- The rational response is to reallocate spending until the MU/P ratios are equal again. This requires adjusting both goods, not just one.
- The law of diminishing marginal utility is the mechanism that makes the adjustment work: buying less of Y raises its MU, buying more of X lowers its MU.
When might a moral hazard occur?
Options
A When a consumer does not have full information about a product.
B When a person undertakes an activity that causes harm to another person.
C When a person undertakes a risky activity, knowing another person bears the risk.
D When the seller of a product has more information than the buyer.
Answer
Moral hazard occurs when a person undertakes a risky activity, knowing that another person bears the risk. This changes their incentive to take precautions, because they do not face the full consequences of their actions.
C
C
Background Concept
Moral hazard is a specific type of market failure that arises from asymmetric information. It occurs after a transaction has taken place. The key idea is that one party to an agreement changes their behaviour in a way that is costly or risky for the other party, precisely because the other party bears the cost of that behaviour. The classic example is insurance: once a person has taken out fire insurance, they may be less careful about preventing a fire because the insurance company will pay for the damage. The insured person's behaviour has changed (they take more risks) because the risk has been transferred to the insurer.
It is important to distinguish moral hazard from two other related concepts:
- Adverse selection (also from asymmetric information) occurs before a transaction. It happens when one party has hidden information that leads them to select a contract that is unfavourable to the other party. For example, a person with a high risk of illness is more likely to buy health insurance, but they do not reveal this risk to the insurer.
- Negative externalities occur when a person's actions impose a cost on a third party, but the person does not change their behaviour because they do not bear that cost. The difference is that with a negative externality, the harm is a direct by-product of the activity (e.g., pollution from a factory). With moral hazard, the harm arises because the person changes their behaviour in response to knowing they are protected from the consequences.
Understanding the Question
This is a multiple-choice question that asks for the definition of a specific economic concept: moral hazard. The question is straightforward: "When might a moral hazard occur?" The four options present different scenarios, and only one correctly describes the core condition for moral hazard. The task is to select the option that matches the precise definition.
Approach
The best approach is to recall the textbook definition of moral hazard and then test each option against it. The definition has two essential parts:
- A person undertakes a risky activity (or changes their behaviour to be more risky).
- They do this because another person (or entity) bears the risk or the cost of that activity.
Option C is the only one that contains both of these elements. The other options describe different but related concepts: asymmetric information (D), adverse selection (A), and negative externalities (B).
Step-by-Step Reasoning
Let's examine each option:
-
Option A: "When a consumer does not have full information about a product." This describes a general situation of asymmetric information, but it does not specify the consequence of that information gap. A consumer lacking information might lead to adverse selection (e.g., buying a 'lemon' of a car) or market failure, but it is not the specific definition of moral hazard. Moral hazard requires a change in behaviour after a contract or agreement is in place.
-
Option B: "When a person undertakes an activity that causes harm to another person." This is the definition of a negative externality. The key difference is that in a negative externality, the person causing the harm does not necessarily change their behaviour because of a transfer of risk. They simply do not pay the full social cost of their action. Moral hazard is a specific cause of a negative externality, but not all negative externalities are moral hazard.
-
Option C: "When a person undertakes a risky activity, knowing another person bears the risk." This is the precise definition. The phrase "knowing another person bears the risk" is the crucial element. It implies that the person's behaviour is altered because the consequences are shifted. This is the core of moral hazard.
-
Option D: "When the seller of a product has more information than the buyer." This describes a situation of asymmetric information, which is a necessary condition for both adverse selection and moral hazard. However, it is too broad. It does not specify the type of behaviour change (the risky activity) or the transfer of risk. This is the general condition for information failure, not the specific definition of moral hazard.
Therefore, only option C correctly and completely defines the condition under which moral hazard occurs.
Key Takeaways
- Moral hazard is a specific type of market failure caused by asymmetric information after a transaction.
- The defining feature is a change in behaviour (taking more risk) because the cost of that risk is borne by someone else.
- It is distinct from adverse selection (which occurs before a transaction) and negative externalities (which are a broader category of cost imposition).
- For multiple-choice questions, always look for the option that contains the most specific and complete definition of the term.
Common Mistakes
- Confusing moral hazard with adverse selection: This is the most common error. Students often remember that both involve asymmetric information but forget the timing. Adverse selection is about hidden information before a deal; moral hazard is about hidden action after a deal.
- Choosing a broad, correct-sounding option: Option D is true in a general sense (information asymmetry exists), but it is not the specific definition of moral hazard. The question asks for the definition of moral hazard, not a related concept.
- Choosing the negative externality option: Option B is a correct statement about externalities, but it misses the crucial element of a transfer of risk that changes the person's incentive.
Things to Be Careful About
- Pay close attention to the precise wording. The phrase "knowing another person bears the risk" is the key differentiator.
- Do not overthink the question. The definition of moral hazard is a standard part of the syllabus. Recall the textbook definition and match it to the options.
- Be aware of the common traps: the examiners often include options that describe related concepts (adverse selection, asymmetric information, negative externalities) to test whether you know the precise boundaries of each term.
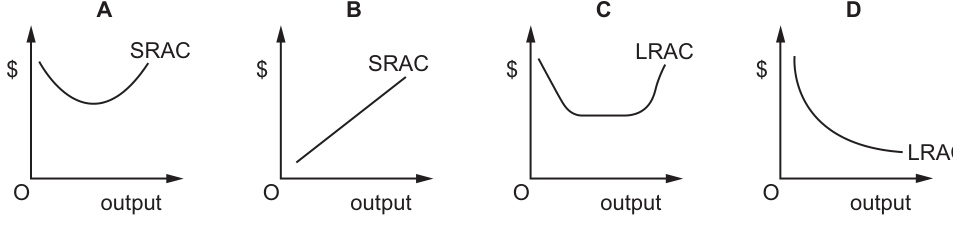
The diagrams show four average cost curves.
Which diagram illustrates diseconomies of scale?
Options
Working
Diseconomies of scale occur when a firm's long-run average costs rise as output increases. This is represented by the upward-sloping portion of the Long Run Average Cost (LRAC) curve. Diagram A shows a U-shaped SRAC curve, which reflects short-run diminishing returns rather than long-run diseconomies of scale. Diagram B shows an upward-sloping SRAC curve, which is not the standard representation for diseconomies of scale. Diagram D shows a downward-sloping LRAC curve that levels off, illustrating economies of scale and constant returns to scale, but not diseconomies. Diagram C shows a U-shaped LRAC curve; the upward-sloping section (right side) of this curve specifically illustrates diseconomies of scale.
Answer
C
C
Background Concept
Diseconomies of scale are a long-run phenomenon that occurs when a firm expands output beyond its optimal size, causing its long-run average costs (LRAC) to rise. This contrasts with economies of scale, where LRAC falls as output increases, and constant returns to scale, where LRAC remains constant. The LRAC curve is typically U-shaped, with the downward-sloping portion representing economies of scale, the flat portion representing constant returns to scale, and the upward-sloping portion representing diseconomies of scale. It is crucial to distinguish this from the short-run average cost (SRAC) curve, which is also U-shaped but for a different reason: the upward slope of the SRAC is caused by the law of diminishing marginal returns as variable factors are added to fixed factors. Diseconomies of scale arise from factors such as coordination problems, communication difficulties, and bureaucratic inefficiencies in large organisations.
Understanding the Question
The question asks which of the four provided diagrams illustrates diseconomies of scale. This requires identifying the diagram that shows the characteristic shape associated with rising long-run average costs. The key is to recognize that diseconomies of scale are represented by the upward-sloping section of the LRAC curve, not the SRAC curve. The candidate must also distinguish between the LRAC curve (which can show all three phases) and curves that only show economies of scale or short-run cost behaviour.
Approach
To answer this question, analyze each diagram based on two criteria: (1) whether the curve is a short-run (SRAC) or long-run (LRAC) average cost curve, and (2) whether its shape includes an upward-sloping portion representing rising average costs. Diseconomies of scale are exclusively a long-run concept, so any diagram showing SRAC can be eliminated. Among the LRAC diagrams, identify which one includes the upward-sloping segment that signifies diseconomies of scale.
Step-by-Step Reasoning
Diagram A shows a U-shaped curve labelled SRAC. This represents short-run average cost, where the initial downward slope is due to increasing marginal returns and the upward slope is due to diminishing marginal returns. Since diseconomies of scale are a long-run concept involving the expansion of all factors of production, Diagram A is incorrect.
Diagram B shows an upward-sloping straight line starting from the origin, labelled SRAC. This is not a standard representation of average cost behaviour and does not specifically illustrate diseconomies of scale. Even if it showed rising costs, it is a short-run curve, so it cannot represent diseconomies of scale.
Diagram C shows a U-shaped curve labelled LRAC. The LRAC curve is composed of three sections: the downward-sloping left portion (economies of scale), the flat middle portion (constant returns to scale), and the upward-sloping right portion (diseconomies of scale). The upward-sloping section of Diagram C explicitly illustrates diseconomies of scale, where average costs increase as output rises due to factors such as managerial inefficiencies and coordination problems in very large firms.
Diagram D shows a downward-sloping LRAC curve that levels off. This illustrates economies of scale (the downward slope) and constant returns to scale (the flat portion), but it does not show the upward-sloping section required to represent diseconomies of scale.
Therefore, Diagram C is the correct answer because it is the only diagram that shows an LRAC curve with an upward-sloping portion, which is the graphical representation of diseconomies of scale.
Key Takeaways
The LRAC curve is U-shaped in theory, with the upward-sloping portion specifically representing diseconomies of scale. Diseconomies of scale are distinct from the upward slope of the SRAC curve, which is caused by short-run diminishing returns rather than long-run organisational inefficiencies. When identifying cost curve diagrams, always check the label (SRAC vs LRAC) and the direction of the slope in the relevant section.
Common Mistakes
A common mistake is to select Diagram A, confusing the upward-sloping portion of the SRAC curve with diseconomies of scale. While both show rising average costs, the SRAC upward slope results from adding variable inputs to fixed inputs in the short run (diminishing marginal returns), whereas diseconomies of scale result from expanding all inputs in the long run, leading to organisational inefficiencies. Another mistake is selecting Diagram D, which only shows economies and constant returns, missing the requirement for an upward-sloping section. Candidates may also overlook the label and focus only on the shape, failing to distinguish between short-run and long-run curves.
Things to Be Careful About
Always verify whether the curve is labelled SRAC or LRAC, as this determines whether the concept being illustrated is short-run or long-run. Diseconomies of scale can only be shown on an LRAC curve. Additionally, ensure you identify the specific portion of the curve: a downward-sloping LRAC shows economies of scale, while only the upward-sloping portion shows diseconomies. The question asks which diagram 'illustrates' diseconomies of scale, meaning the diagram must contain the relevant section, which Diagram C does as part of its U-shape.
What would enable a firm to increase its market share in a monopolistically competitive market?
Options
A barriers to entry
B collusion
C lack of competition
D successful advertising
Reasoning
In monopolistic competition, there are many firms, low barriers to entry, and products are differentiated. A firm cannot increase market share through barriers to entry (A) because entry is relatively free. Collusion (B) is unlikely due to the large number of firms. Lack of competition (C) is not a feature of this market structure. Successful advertising (D) can increase demand for a firm's differentiated product, allowing it to gain market share from rivals.
Answer
D
D
Background Concept
Monopolistic competition is a market structure characterised by:
- Many buyers and sellers.
- Low barriers to entry and exit.
- Product differentiation: each firm produces a slightly different version of the product (e.g., different brands of soap, restaurants, clothing lines).
- Firms have some degree of market power because their product is not a perfect substitute for others, but this power is limited by the availability of close substitutes.
Because products are differentiated, firms compete on factors other than price, known as non-price competition. This includes advertising, branding, product quality, packaging, and customer service. Successful non-price competition can shift the demand curve for a firm's product to the right, allowing it to sell more at a given price, thereby increasing its market share.
Understanding the Question
The question asks what would enable a firm to increase its market share in a monopolistically competitive market. Market share is the proportion of total sales in a market that is held by one firm. The key is to identify a strategy that is both feasible and effective given the specific characteristics of monopolistic competition. The options present four different strategies or market conditions.
Approach
- Recall the defining features of monopolistic competition: many firms, product differentiation, low barriers to entry, no collusion.
- Evaluate each option against these features:
- A (barriers to entry): Are barriers to entry high or low in this market? Low. So this is not a feature a firm can use.
- B (collusion): Is collusion likely with many firms? No, it is very difficult to coordinate.
- C (lack of competition): Is there a lack of competition? No, there are many competitors.
- D (successful advertising): Does advertising fit with the market structure? Yes, it is a key form of non-price competition to differentiate the product.
- Select the option that is consistent with the market structure and would logically lead to an increase in market share.
Step-by-Step Reasoning
- Option A: Barriers to entry. In monopolistic competition, barriers to entry are low. A firm cannot unilaterally create high barriers to entry to protect its market share. Even if it could, this would prevent new firms from entering, but it would not directly increase the firm's own market share relative to existing rivals. Therefore, A is incorrect.
- Option B: Collusion. Collusion (agreeing with rivals to fix prices or output) is very difficult to sustain in a market with many firms. The incentive to cheat is high, and the large number of firms makes monitoring and enforcement nearly impossible. Therefore, collusion is not a viable strategy in monopolistic competition. B is incorrect.
- Option C: Lack of competition. Monopolistic competition is defined by the presence of many competitors. A lack of competition is a feature of monopoly or oligopoly, not monopolistic competition. Therefore, C is incorrect.
- Option D: Successful advertising. This is the correct answer. In monopolistic competition, firms sell differentiated products. Advertising is a primary tool for non-price competition. Successful advertising can:
- Increase consumer awareness and preference for the firm's specific brand.
- Make the perceived demand for the firm's product less price-elastic (consumers become more loyal).
- Shift the firm's demand curve to the right, allowing it to sell a larger quantity at any given price.
- This directly increases the firm's sales and, consequently, its market share relative to its competitors.
Key Takeaways
- The key to answering multiple-choice questions about market structures is to know the defining characteristics of each structure (number of firms, barriers to entry, product differentiation, etc.).
- A strategy that works in one market structure (e.g., collusion in oligopoly) may be impossible in another (e.g., monopolistic competition).
- Non-price competition, especially advertising, is a central feature of monopolistic competition.
Common Mistakes
- Confusing market structures: A student might incorrectly associate 'barriers to entry' with any imperfect market, forgetting that they are low in monopolistic competition.
- Overlooking the 'many firms' condition: A student might think collusion is possible, forgetting that it is practically impossible to coordinate among a large number of firms.
- Misunderstanding 'market share': A student might think that a lack of competition would help a firm, but this is a market condition, not an action the firm can take. The question asks what the firm can do.
Things to Be Careful About
- Read the question carefully: it asks what would enable a firm to increase its market share. The answer must be a feasible action or condition within the given market structure.
- Distinguish between a market structure's features (e.g., low barriers to entry) and a firm's strategies (e.g., advertising). The question asks for a strategy that works given the features.
- Remember that in monopolistic competition, firms have some market power, but it is limited. Advertising is a way to exercise that power to gain a competitive edge.
Two manufacturing firms in the same industry, producing similar products, are considering merging together.
What would be the least convincing reason for merging?
Options
A It would enable greater bargaining power when buying raw materials.
B It would enable technical economies of scale.
C It would produce savings in management and administration costs.
D It would reduce the dependence of the firms on the suppliers of raw materials.
Reasoning
Firms merge to increase market power, reduce costs, or secure supply chains.
- A – Greater bargaining power when buying raw materials is a genuine benefit of horizontal integration: a larger firm can negotiate bulk discounts, lowering average costs.
- B – Technical economies of scale (e.g. spreading fixed costs over more output, using larger, more efficient machinery) are a standard and convincing reason for merging.
- C – Savings in management and administration costs (e.g. combining head offices, eliminating duplicate roles) are a common source of cost reduction after a merger.
- D – Reducing dependence on suppliers of raw materials is a reason for backward vertical integration (merging with a supplier), not for merging with another manufacturing firm in the same industry. A horizontal merger between two firms at the same stage of production does not reduce reliance on suppliers; it may even increase the volume of raw materials purchased. This is therefore the least convincing reason.
Answer
D
D
Background Concept
A merger is the combining of two separate firms into one. The type of merger depends on the relationship between the firms:
- Horizontal integration: firms at the same stage of production in the same industry (e.g. two car manufacturers).
- Vertical integration: firms at different stages of the same supply chain (e.g. a car manufacturer merging with a tyre supplier – backward vertical – or with a dealership – forward vertical).
- Conglomerate integration: firms in unrelated industries.
The question specifies that the two firms are in the same industry producing similar products – this is a horizontal merger. The reasons for merging must therefore be reasons that apply to a horizontal combination.
Understanding the Question
The question asks for the least convincing reason for merging. All four options sound plausible at first glance, but one does not logically follow from a horizontal merger. The task is to identify which reason is inconsistent with the type of integration described.
Approach
Evaluate each option against the type of merger (horizontal). For each, ask: does this benefit arise from combining two firms at the same production stage? If the benefit is more naturally associated with a different type of integration (vertical), it is the least convincing.
Step-by-Step Reasoning
-
Option A – Greater bargaining power when buying raw materials.
- When two firms in the same industry merge, the combined entity buys a larger total quantity of raw materials. Suppliers are more willing to offer bulk discounts to a larger customer. This is a genuine and common benefit of horizontal mergers. It is convincing.
-
Option B – Technical economies of scale.
- Merging increases the scale of output. The larger firm can invest in more efficient machinery, spread fixed costs (like R&D or factory overheads) over more units, and benefit from specialisation. This is a classic reason for horizontal integration. It is convincing.
-
Option C – Savings in management and administration costs.
- After a merger, the two firms can combine their head offices, accounting departments, HR functions, etc., eliminating duplicate roles. This reduces average administrative costs. It is a standard and convincing reason.
-
Option D – Reduce the dependence of the firms on the suppliers of raw materials.
- Reducing dependence on suppliers means gaining more control over the supply of inputs. This is achieved by backward vertical integration – merging with or acquiring a supplier. A horizontal merger between two manufacturers does not change the relationship with suppliers; the merged firm still buys from the same (or similar) suppliers, possibly in even larger volumes. It does not reduce dependence. Therefore, this reason is not convincing for a horizontal merger.
Key Takeaways
- Always identify the type of integration (horizontal, vertical, conglomerate) before evaluating reasons for a merger.
- Horizontal mergers primarily yield benefits from increased market power, economies of scale, and elimination of duplication.
- Vertical integration is the strategy for controlling the supply chain (backward) or distribution (forward).
Common Mistakes
- Confusing horizontal and vertical integration: a student might think that any merger reduces supplier dependence, but that is only true for backward vertical integration.
- Choosing an option that is actually a valid reason (A, B, or C) because all four sound plausible – the key is to spot the mismatch with the type of merger.
Things to Be Careful About
- Read the question carefully: it asks for the least convincing reason, not the most convincing.
- The phrase "in the same industry, producing similar products" is the critical clue that this is a horizontal merger.
- Option D is a classic distractor: it sounds like a benefit of integration in general, but it is specific to vertical integration.
The marginal social benefit of consuming a drink is less than the marginal private benefit.
What would be the best policy to improve resource allocation in this market?
Options
A give a subsidy to the producers of the drink
B increase competition in the drink industry
C impose a maximum price for the drink above the market equilibrium price
D impose a per unit tax on the drink
Reasoning
MSB < MPB means the consumption of the drink creates a negative externality — the social benefit is less than the private benefit because the activity imposes external costs on third parties. The market over-consumes the drink because consumers ignore these external costs. A per unit tax raises the private cost to the consumer, reducing consumption towards the socially optimal level where MSB = MSC. This internalises the externality and improves resource allocation.
Answer
D
D
Background Concept
When a good is consumed, the total benefit to society is the sum of the private benefit enjoyed by the consumer and any external benefit (or cost) imposed on third parties. The marginal social benefit (MSB) is the extra benefit to society from one more unit. The marginal private benefit (MPB) is the extra benefit to the consumer alone.
If MSB < MPB, the external effect is negative — the consumption harms others. For example, drinking alcohol may lead to noise, litter, or health costs borne by the wider community. The market equilibrium occurs where MPB = MPC (marginal private cost), which is above the socially optimal quantity where MSB = MSC. This over-consumption creates a deadweight welfare loss.
Understanding the Question
The question states: "The marginal social benefit of consuming a drink is less than the marginal private benefit." This is a clear signal of a negative externality of consumption. The task is to choose the policy that would best improve resource allocation — i.e., move the market towards the socially optimal output.
Approach
We need to evaluate each option against the specific failure:
- A subsidy would lower the price and encourage even more consumption, worsening the over-consumption.
- Increasing competition might lower price and increase output, again worsening the problem.
- A maximum price above equilibrium would have no effect (it is not binding) and would not reduce consumption.
- A per unit tax raises the cost to consumers, shifting the effective demand curve down (or the supply curve up) and reducing quantity towards the social optimum.
Only the tax directly addresses the divergence between private and social costs.
Step-by-Step Reasoning
-
Identify the externality: MSB < MPB implies a negative externality of consumption. The drink is over-consumed because consumers do not pay for the external costs.
-
Goal of policy: Reduce consumption from the market equilibrium Qm to the socially optimal Qs where MSB = MSC.
-
Evaluate each option:
- A: A subsidy lowers the price paid by consumers, increasing quantity demanded. This would move the market further away from Qs, worsening the deadweight loss. Incorrect.
- B: More competition typically lowers price and increases output. Again, this would increase consumption, not reduce it. Incorrect.
- C: A maximum price above equilibrium is not binding — the market price is already lower. It has no effect on quantity. Incorrect.
- D: A per unit tax raises the price consumers pay (or reduces the price producers receive), shifting the supply curve upward by the amount of the tax. This reduces the equilibrium quantity. If the tax is set equal to the marginal external cost (MEC = MPB - MSB), the new equilibrium will be at Qs, achieving allocative efficiency. Correct.
-
Conclusion: Option D is the best policy.
Key Takeaways
- MSB < MPB signals a negative externality of consumption (over-consumption).
- The corrective policy must reduce consumption towards the social optimum.
- A per unit tax (Pigouvian tax) internalises the externality by making consumers pay the full social cost.
- Subsidies, competition, and non-binding price controls are inappropriate for this type of failure.
Common Mistakes
- Confusing MSB < MPB with a positive externality (where MSB > MPB). A subsidy would be correct for a positive externality, but here it is the wrong instrument.
- Thinking a maximum price could reduce consumption — a maximum price below equilibrium would create a shortage, but above equilibrium it has no effect.
- Assuming that increasing competition always improves resource allocation — in the presence of externalities, more competition can worsen the market failure.
Things to Be Careful About
- Read the inequality carefully: MSB < MPB means the social benefit is lower than the private benefit, so the activity is harmful to society.
- Remember that the policy must target the source of the failure — here, the divergence between private and social costs — not just any intervention.
- In MCQ format, eliminate obviously wrong options first (A and B increase output, C is ineffective) to narrow down to the correct one.
A country’s government banned cigarette smoking in enclosed public spaces, such as offices, shops, bars and restaurants.
What is a government failure arising from this ban?
Options
A decreased consumption of cigarettes by smokers
B decreased levels of passive cigarette smoking by non-smokers
C increased litter from used cigarettes outside offices and shops
D increased sales of cigarette substitutes like nicotine patches and gum
Answer
Government failure occurs when government intervention creates an unintended negative consequence that makes the outcome worse than the original market failure. The ban on smoking in enclosed public spaces was intended to reduce passive smoking. However, it led to smokers congregating outside buildings, increasing litter from discarded cigarette butts. This is an unintended negative consequence, so option C is correct.
Answer
C
C
Background Concept
Government failure occurs when a government intervention intended to correct a market failure actually makes the situation worse, either by creating new inefficiencies or by failing to achieve its intended objective. It can arise from:
- Unintended consequences (policies that produce side effects worse than the original problem)
- Information problems (the government lacks perfect knowledge)
- Administrative costs
- Regulatory capture
- Political self-interest
In this case, the ban on smoking in enclosed public spaces was a government policy aimed at reducing the negative externality of passive smoking (second-hand smoke). The intended effect was to protect non-smokers from health risks in workplaces and public venues.
Understanding the Question
The question asks which of the four options represents a government failure arising from the ban. The key is to distinguish between:
- Intended effects (the policy working as planned)
- Market responses (private agents adapting to the new rules, which may be efficient)
- Government failure (an unintended negative consequence that makes the outcome worse)
Options A and B are intended positive outcomes of the ban. Option D is a market response (substitute goods). Only option C describes an unintended negative side effect that represents a new problem created by the policy.
Approach
- Define government failure.
- Evaluate each option against that definition.
- Identify which option is an unintended negative consequence, not an intended benefit or a neutral market adjustment.
Step-by-Step Reasoning
-
Option A: decreased consumption of cigarettes by smokers – This is the intended effect of the ban. By making it harder to smoke in public places, the government hoped to reduce smoking. This is a success of the policy, not a failure.
-
Option B: decreased levels of passive cigarette smoking by non-smokers – This is also an intended effect. The ban was specifically designed to protect non-smokers from second-hand smoke. Again, a policy success.
-
Option C: increased litter from used cigarettes outside offices and shops – This is an unintended negative consequence. Smokers who cannot smoke inside now congregate outside, and they discard cigarette butts on the street. This creates a new externality (litter, environmental damage, cleaning costs) that was not present before. It represents government failure because the intervention created a new problem.
-
Option D: increased sales of cigarette substitutes like nicotine patches and gum – This is a market response to the ban. Some smokers may switch to substitutes to satisfy their nicotine addiction without breaking the law. This is not a failure; it may even be a positive outcome if it helps people quit. It is not an unintended negative consequence.
Therefore, only option C qualifies as government failure.
Key Takeaways
- Government failure is not simply any outcome of a policy; it must be an unintended negative consequence that worsens welfare.
- Intended positive effects (A, B) and neutral market adjustments (D) are not government failures.
- The question tests the ability to apply the definition of government failure to a real-world example.
Common Mistakes
- Choosing A or B because they are effects of the ban, without checking whether they are intended or unintended.
- Choosing D because it is a change in the market, without recognising that it is a rational private response, not a failure.
- Confusing government failure with any negative outcome; the outcome must be unintended and welfare-reducing.
Things to Be Careful About
- Read the question carefully: it asks for government failure, not just any consequence.
- Distinguish between the policy's goal (reducing passive smoking) and its side effects.
- Remember that government failure is about the intervention making things worse, not about the original market failure persisting.
A worker has a low wage. They have little incentive to earn extra income because they will pay more income tax and receive fewer means-tested benefits.
What describes this worker’s situation?
Options
A employment trap
B liquidity trap
C poverty trap
D unemployment trap
Answer
The worker is in the poverty trap. This occurs when a low-income individual faces a high effective marginal tax rate because earning more income leads to both higher income tax and the withdrawal of means-tested benefits, leaving little or no net gain from additional work.
Answer
C
C
Background Concept
The poverty trap is a situation where low-income individuals face a disincentive to increase their earnings because any extra income is largely offset by a combination of higher income tax payments and the loss of means-tested benefits (such as housing benefit, tax credits, or universal credit). The effective marginal tax rate — the proportion of each additional pound earned that is taken in tax or lost in withdrawn benefits — can approach or even exceed 100%, meaning the worker is no better off, or may even be worse off, for working more. This traps the worker in poverty, as there is little financial reward from extra effort or promotion.
Other economic traps include:
- Unemployment trap: occurs when the level of out-of-work benefits is so high relative to potential wages that an unemployed person has little financial incentive to take a job.
- Liquidity trap: a Keynesian concept where interest rates are so low that monetary policy becomes ineffective because people hoard cash rather than spend or invest.
- Employment trap: not a standard economic term; sometimes used loosely but not a recognised concept in the Cambridge syllabus.
Understanding the Question
The question describes a worker who is already employed (they have a low wage) but faces a disincentive to earn more because extra income triggers higher tax and reduced benefits. The key phrase is "little incentive to earn extra income" due to the combined effect of tax and benefit withdrawal. This is the classic definition of the poverty trap. The question asks you to select the correct term from four options.
Approach
Read the scenario carefully: the worker is in work (low wage), not unemployed. This immediately rules out the unemployment trap. The liquidity trap is a macroeconomic concept about monetary policy, not about individual work incentives. The employment trap is not a standard term. The only option that matches the description of a low-wage worker facing a high effective marginal tax rate due to benefit withdrawal is the poverty trap.
Step-by-Step Reasoning
-
Identify the key elements in the scenario:
- The worker is employed ("has a low wage").
- They face a disincentive to earn more.
- The disincentive comes from two sources: higher income tax and loss of means-tested benefits.
-
Match these elements to the definitions:
- Poverty trap: exactly this — low-paid workers lose benefits as earnings rise, combined with tax, creating a high effective marginal tax rate that discourages extra work.
- Unemployment trap: applies to someone who is not working and finds benefits more attractive than low wages. The worker here is already employed, so this does not fit.
- Liquidity trap: a macroeconomic condition where nominal interest rates are near zero and monetary policy fails. Irrelevant to an individual's work incentive.
- Employment trap: not a standard economic term in the syllabus; it is a distractor.
-
Conclude that the correct answer is C, the poverty trap.
Key Takeaways
- The poverty trap is a microeconomic concept about work incentives for low-income individuals.
- It arises from the interaction of the tax system and means-tested benefits.
- The effective marginal tax rate is the key measure: if it is very high, the trap is severe.
- Distinguish it from the unemployment trap (out-of-work benefits vs wages) and the liquidity trap (monetary policy ineffectiveness).
Common Mistakes
- Choosing unemployment trap because the word "trap" and "benefits" appear. The scenario explicitly says the worker has a low wage, meaning they are employed, so the unemployment trap is incorrect.
- Confusing the poverty trap with the unemployment trap. Remember: poverty trap = in work but disincentivised to earn more; unemployment trap = out of work and disincentivised to take a job.
- Selecting liquidity trap because it sounds like a general economic problem. It is a specific macroeconomic term unrelated to individual labour supply.
Things to Be Careful About
- Read the scenario carefully: the worker is already employed ("has a low wage"). This is the critical clue.
- Know the standard definitions of the four traps as they appear in the syllabus. The poverty trap is specifically about the interaction of tax and means-tested benefits for low-income workers.
- Do not overthink: this is a straightforward definitional question worth 1 mark.
What is not an outcome of the existence of private property rights?
Options
A They encourage private owners to conserve property when its value is expected to rise.
B They give private owners the incentive to manage their property carefully.
C They make private owners accountable for damage to others from property misuse.
D They prevent private owners gaining from using resources to benefit others.
Answer
Private property rights give owners the incentive to conserve, manage carefully, and be accountable for damage. They do not prevent owners from gaining from using resources to benefit others; in fact, they enable such gains through voluntary exchange. Therefore, option D is the statement that is not an outcome of private property rights.
Answer
D
D
Background Concept
Private property rights are a key institution in a market economy. They give individuals or firms the legal authority to own, use, and dispose of resources (land, capital, goods) as they see fit, subject to certain legal constraints. The existence of well-defined and enforced property rights is widely regarded as a necessary condition for markets to function efficiently. They create incentives for owners to use resources in ways that maximise their value over time, because the owner bears both the costs and the benefits of their decisions. This includes the incentive to conserve resources expected to rise in value, to manage property carefully to maintain its value, and to be held accountable for any harm the property causes to others (e.g., through nuisance or pollution laws). Property rights also facilitate voluntary exchange, allowing owners to gain by using resources to produce goods and services that others value.
Understanding the Question
This is a multiple-choice question that asks: "What is not an outcome of the existence of private property rights?" The question presents four statements (A, B, C, D) and requires you to identify the one that is false — i.e., the statement that does not describe a consequence or benefit of having private property rights. The key is to recall the fundamental functions and incentives created by property rights and then test each option against that understanding.
Approach
- Recall the core functions of private property rights: they create incentives for conservation, careful management, and accountability, and they enable voluntary exchange and gains from trade.
- Evaluate each option in turn:
- A: Does it encourage conservation when value is expected to rise? Yes, because the owner captures the future gain.
- B: Does it give an incentive to manage property carefully? Yes, because the owner bears the loss from poor management.
- C: Does it make owners accountable for damage to others? Yes, through laws of tort and nuisance.
- D: Does it prevent owners from gaining from using resources to benefit others? This is the opposite of what property rights do — they enable such gains.
- Identify the option that is inconsistent with the theory.
Step-by-Step Reasoning
-
Option A: "They encourage private owners to conserve property when its value is expected to rise." This is a standard outcome. If an owner expects the value of their land or a resource to increase in the future, they have an incentive to hold onto it and not deplete it now, because they will capture the capital gain. This is a key argument for property rights as a conservation tool. So A is a true outcome.
-
Option B: "They give private owners the incentive to manage their property carefully." Again, this is a core incentive. If you own something, you bear the cost of neglect (e.g., a house falling into disrepair reduces its sale price). So you have a strong incentive to maintain and improve it. B is a true outcome.
-
Option C: "They make private owners accountable for damage to others from property misuse." Property rights come with legal responsibilities. For example, if a factory owner's emissions damage neighbouring crops, the owner can be sued for compensation. This accountability internalises some external costs. C is a true outcome.
-
Option D: "They prevent private owners gaining from using resources to benefit others." This is false. In fact, property rights enable owners to gain by using resources to produce goods and services that others value. Through voluntary exchange, both parties benefit — the owner gains revenue, and the buyer gains utility. Without property rights, such mutually beneficial transactions would be far more difficult. Therefore, D is the statement that is not an outcome.
Key Takeaways
- Private property rights create powerful incentives for conservation, careful management, and accountability.
- They are essential for voluntary exchange and the gains from trade.
- A common exam trick is to present a statement that is the opposite of the truth; always check each option against the core theory.
Common Mistakes
- Misreading the question as "which is an outcome" instead of "which is not an outcome". Always read the question carefully.
- Assuming that property rights only give benefits and never impose costs or responsibilities — but accountability (option C) is a real and important outcome.
- Thinking that property rights prevent owners from benefiting others — this confuses property rights with restrictions on use. In a market system, owners benefit others precisely because they seek their own gain.
Things to Be Careful About
- The word "not" in the question stem is critical. Underline it mentally.
- Do not overthink: the theory is clear. Option D directly contradicts the fundamental purpose of property rights.
- Remember that property rights are about both rights and responsibilities — accountability is part of the package.
The diagram shows the labour market for a profit maximising industry with a monopsony employer.
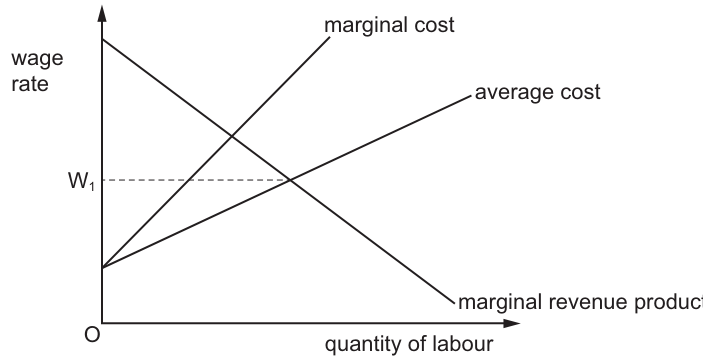
What will decrease if a minimum wage of W1 is introduced?
Options
A economic rent
B transfer earnings
C unemployment
D wages
Working
In a monopsony labour market, the single employer faces an upward-sloping labour supply curve (average cost of labour, AC) and a marginal cost of labour (MC) curve that lies above AC. Without a minimum wage, the profit-maximising employer hires where marginal revenue product (MRP) equals MC, paying a wage below the competitive equilibrium level and employing fewer workers than in a competitive market.
Introducing a minimum wage at W1 (the competitive equilibrium wage, where MRP = AC) acts as a binding price floor. This raises the wage rate above the original monopsony wage, and increases employment towards the competitive level.
- Wages rise to W1, so option D (wages) is incorrect, as it increases rather than decreases.
- Higher wages and higher employment increase total economic rent (the excess of wages over workers' transfer earnings), so option A is incorrect.
- Higher employment also increases total transfer earnings (the sum of workers' opportunity costs), so option B is incorrect.
- Under monopsony, employment is below the competitive level, meaning there are workers willing to work at the competitive wage who are not employed. The minimum wage raises employment to the competitive level, reducing this gap, so unemployment decreases.
Answer
C
C
Background Concept
A monopsony is a labour market with a single dominant employer, giving the firm market power to set wages below the level that would prevail in a perfectly competitive labour market. The labour supply curve faced by the monopsonist is the average cost (AC) of labour, which is upward sloping because higher wages are required to attract a larger quantity of workers. The marginal cost (MC) of labour lies above the AC curve: this is because hiring an additional worker requires the firm to raise the wage for all existing workers, so the cost of the extra worker is higher than the average wage paid to all workers. The firm's demand for labour is given by the downward-sloping marginal revenue product (MRP) curve, which represents the additional revenue generated by hiring one more worker. The profit-maximising level of employment is where MRP equals MC of labour. The wage paid is the minimum needed to attract this quantity of workers, read from the AC curve at this employment level, and is always below the competitive equilibrium wage (where MRP = AC, the point where labour demand equals labour supply).
Two key concepts for distributing labour income are transfer earnings and economic rent. Transfer earnings are the minimum payment required to keep a factor of production in its current use: for labour, this is the wage a worker could earn in their next best alternative job, represented by the labour supply curve. Economic rent is any payment to a factor of production above its transfer earnings: for labour, this is the excess of the actual wage over the worker's transfer earnings, represented by the area between the wage line and the supply curve up to the quantity of labour employed.
Unemployment is defined as the situation where the quantity of labour supplied (the number of workers willing to work at the current wage rate) exceeds the quantity of labour demanded (the number of workers employers are willing to hire at that wage rate).
Understanding the Question
The question provides a diagram of a monopsony labour market, with a downward-sloping MRP curve (labour demand), an upward-sloping AC curve (labour supply), and a steeper upward-sloping MC curve. A minimum wage of W1 is introduced, and the task is to identify which of the four options (economic rent, transfer earnings, unemployment, wages) will decrease as a result. The question tests application of monopsony theory to minimum wage policy, as well as understanding of labour market income distribution concepts. The diagram shows that W1 is a horizontal line that intersects both the MC and AC curves at the same point, which corresponds to the competitive equilibrium wage where MRP = AC.
Approach
To solve this question, follow these steps:
- First, recall the baseline outcome for a monopsony without a minimum wage: lower wages, lower employment than the competitive equilibrium, and no involuntary unemployment (quantity of labour supplied equals quantity demanded at the monopsony wage, but employment is below the full-employment competitive level).
- Next, analyse the effect of the minimum wage at W1: first eliminate options that will clearly increase. A minimum wage is a price floor that raises the wage rate, so wages will increase, eliminating option D immediately.
- Assess the impact on economic rent and transfer earnings: both depend on the wage level and the quantity of labour employed. A higher wage and higher employment (as will occur here, since W1 is the competitive wage) will increase both total economic rent (higher wages for existing workers, plus rent for newly employed workers) and total transfer earnings (more workers employed, each with their own opportunity cost), eliminating options A and B.
- The remaining option is unemployment: under monopsony, employment is below the competitive level, meaning there are workers willing to work at the competitive wage who are not employed. The minimum wage raises employment to the competitive level, reducing this gap, so unemployment decreases.
Step-by-Step Reasoning
- Monopsony baseline outcome: Without a minimum wage, the monopsonist maximises profit by hiring where MC = MRP, at quantity Qm. The wage paid is Wm, read from the AC curve at Qm. At Wm, the quantity of labour supplied is exactly Qm, so there is no gap between labour supply and demand — but Qm is below the competitive equilibrium quantity Qc (where MRP = AC). This means there are workers who are willing to work at the higher competitive wage W1 but are not employed by the monopsonist, representing a form of labour market underutilisation that the question refers to as unemployment.
- Effect of the minimum wage W1: The diagram shows W1 intersects MC and AC at the same point, which is the competitive equilibrium point where MRP = AC. Introducing this minimum wage acts as a binding price floor: the firm is legally required to pay at least W1 for all workers. This changes the firm's marginal cost of labour: for quantities up to the point where the original MC curve equals W1, the marginal cost of labour is fixed at W1 (since all workers must be paid W1). The firm will now hire where this new MC curve equals MRP, which occurs at a higher quantity of labour than Qm, closer to Qc.
- Wages increase: The minimum wage is set above the original monopsony wage Wm, so the wage rate rises to W1. This means option D (wages) increases, not decreases, so D is incorrect.
- Economic rent increases: Economic rent is the area between the wage line and the labour supply (AC) curve up to the quantity of labour employed. Under monopsony, this is the small triangle between Wm and the AC curve up to Qm. With the minimum wage, employment rises to Qc, and the wage is W1. The area between W1 and the AC curve up to Qc is larger than the original economic rent, so total economic rent increases. Option A is incorrect.
- Transfer earnings increase: Transfer earnings are the area under the labour supply (AC) curve up to the quantity of labour employed. Under monopsony, this is the area under AC up to Qm. With higher employment Qc, the area under AC up to Qc is larger, so total transfer earnings increase. Option B is incorrect.
- Unemployment decreases: Under monopsony, employment is Qm, which is below the competitive level Qc. The difference Qc - Qm represents workers who are willing to work at the competitive wage W1 but are not employed by the monopsonist. The minimum wage raises employment to Qc, eliminating this gap, so the level of unemployment decreases. Option C is correct.
Key Takeaways
- A monopsony in the labour market leads to wages and employment below the perfectly competitive equilibrium level, as the single employer suppresses wages to maximise profit.
- A minimum wage set at the competitive equilibrium wage can counteract monopsony power: it raises wages and increases employment towards the competitive level, reducing the underutilisation of labour caused by monopsony.
- Economic rent and transfer earnings are both positively related to the wage rate and the quantity of labour employed: higher wages and higher employment increase both total economic rent and total transfer earnings.
- The effect of a minimum wage depends on the structure of the labour market: it creates unemployment in perfectly competitive markets, but can increase employment and reduce monopsony-induced underemployment in monopsony markets.
Common Mistakes
- Assuming a minimum wage always increases unemployment: this is only true in perfectly competitive labour markets. In monopsony markets, an appropriately set minimum wage can raise employment and reduce underutilisation.
- Confusing economic rent and transfer earnings: economic rent is the excess of wages over transfer earnings, so both rise when wages and employment increase.
- Forgetting that monopsony does not create involuntary unemployment at the monopsony wage, but does create underemployment relative to the competitive level, which the question refers to as unemployment.
- Eliminating options incorrectly: for example, assuming that higher wages reduce economic rent, when in fact higher wages increase the surplus above workers' opportunity costs.
Things to Be Careful About
- Always distinguish between the marginal cost and average cost of labour in a monopsony: the MC curve lies above the AC (supply) curve, and the profit-maximising employment level is where MC = MRP, not where AC = MRP.
- When analysing minimum wage effects, first identify whether the wage is set below, at, or above the competitive equilibrium: this determines whether employment rises, stays the same, or falls.
- Remember that economic rent and transfer earnings are area-based measures: they depend on both the wage level and the quantity of labour employed, so changes to either will affect both.
- For multiple-choice questions, eliminate clearly incorrect options first to narrow down the correct answer: in this case, wages must rise with a minimum wage, and economic rent and transfer earnings both rise with higher wages and employment, leaving unemployment as the only option that decreases.
What is not a factor affecting the supply of labour?
Options
A emigration rates
B labour participation rate
C labour productivity
D unemployment benefits
Answer
The supply of labour refers to the number of workers willing and able to work at a given wage rate. Factors affecting it include emigration rates (A), the labour participation rate (B), and unemployment benefits (D), as these influence the willingness or ability of people to offer their labour. Labour productivity (C) affects the demand for labour, not the supply, because it determines how much output a worker can produce, which influences a firm's willingness to hire. Therefore, the correct answer is C.
C
Background Concept
The supply of labour in a market is the total number of workers (or hours of work) that workers are willing and able to offer at various wage rates. It is determined by factors that affect workers' decisions to participate in the labour force, such as wages, non-wage benefits, preferences for leisure, demographic factors, and government policies. Labour productivity, on the other hand, is a measure of output per worker per unit of time. It is a key determinant of the demand for labour because firms hire workers based on the value of what they produce (the marginal revenue product). A change in productivity shifts the demand curve for labour, not the supply curve.
Understanding the Question
This is a multiple-choice question asking which of the four options is NOT a factor affecting the supply of labour. The question tests the distinction between supply-side and demand-side influences in the labour market. The correct answer is the one that affects the demand for labour, not the supply.
Approach
Recall the standard list of factors that shift the labour supply curve: changes in population (including migration), changes in the participation rate (e.g., more women entering the workforce), changes in preferences for work versus leisure, changes in non-wage benefits (e.g., unemployment benefits, pensions), and changes in education/training that affect the quality of labour. Labour productivity is not on this list because it affects how many workers firms want to hire, not how many workers are willing to work.
Step-by-Step Reasoning
- Option A: Emigration rates – Emigration reduces the number of workers in a country, shifting the labour supply curve to the left. This is a supply-side factor.
- Option B: Labour participation rate – The participation rate is the proportion of the working-age population that is in the labour force (either employed or actively seeking work). A higher participation rate increases labour supply. This is a supply-side factor.
- Option C: Labour productivity – Labour productivity is output per worker. Higher productivity means each worker produces more, making workers more valuable to firms. This increases the demand for labour (shifts the demand curve right), not the supply. It is a demand-side factor.
- Option D: Unemployment benefits – Higher unemployment benefits reduce the opportunity cost of not working, making some workers less willing to supply labour at any given wage. This shifts the labour supply curve to the left. This is a supply-side factor.
Since the question asks for what is NOT a factor affecting the supply of labour, the answer is C.
Key Takeaways
- The supply of labour is determined by factors that influence workers' willingness and ability to work.
- Labour productivity is a demand-side factor because it affects firms' willingness to hire.
- Always distinguish between shifts of the labour supply curve (caused by supply-side factors) and shifts of the labour demand curve (caused by demand-side factors).
Common Mistakes
- Confusing labour productivity with labour supply. Productivity is about output per worker, not the number of workers available.
- Thinking that higher productivity might attract more workers (e.g., through higher wages) – but that is an indirect effect via demand, not a direct supply factor.
- Misreading the question as asking for a factor that DOES affect supply, rather than one that does NOT.
Things to Be Careful About
- Read the question carefully: "What is NOT a factor..." – the correct answer is the one that does NOT belong.
- Remember that factors like emigration, participation rate, and unemployment benefits are classic supply-side determinants.
- Labour productivity is a key concept in labour demand (marginal revenue product theory).
The diagrams show the demand for and supply of labour.
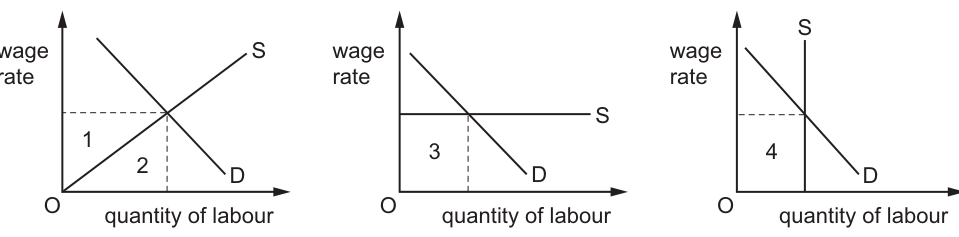
Which two areas represent transfer earnings?
Options
A 1 and 3
B 1 and 4
C 2 and 3
D 2 and 4
Answer
Transfer earnings are the minimum payment required to keep a factor of production in its current use, represented by the area under the supply curve and below the equilibrium wage rate.
In the first diagram, with an upward-sloping supply curve, area 2 lies below the supply curve and represents total transfer earnings. Area 1 lies above the supply curve and represents economic rent.
In the second diagram, with a perfectly elastic (horizontal) supply curve, area 3 lies below the supply curve and represents total transfer earnings. There is no economic rent because the supply curve is horizontal at the equilibrium wage.
In the third diagram, with a perfectly inelastic (vertical) supply curve, area 4 represents the total wage bill below the equilibrium wage. Because the supply curve is vertical, this area includes both transfer earnings and any economic rent, so it does not purely represent transfer earnings.
Therefore, the areas representing transfer earnings are 2 and 3.
Answer
C
C
Background Concept
Transfer earnings are the minimum payment required to keep a factor of production in its current use. For labour, transfer earnings represent the opportunity cost of supplying labour - the wage a worker could earn in their next best alternative employment. Economic rent is any payment received by the factor of production in excess of its transfer earnings. The supply curve of labour illustrates the minimum wage workers require to supply each quantity of labour. Consequently, the area under the supply curve and below the equilibrium wage rate represents total transfer earnings, while the area between the supply curve and the equilibrium wage represents economic rent.
Understanding the Question
The question presents three distinct labour market diagrams, each with a different supply curve elasticity, and asks which two numbered areas represent transfer earnings. The diagrams show: (1) a standard upward-sloping supply curve, (2) a perfectly elastic horizontal supply curve, and (3) a perfectly inelastic vertical supply curve. The task requires applying the definition of transfer earnings to each diagram to determine which shaded areas correspond to this concept.
Approach
The key principle is that transfer earnings are always measured by the area under the supply curve and below the equilibrium wage rate, regardless of the supply curve's shape. The approach is to examine each diagram individually:
- For the upward-sloping supply curve, identify the area beneath it.
- For the horizontal supply curve, identify the area beneath it.
- For the vertical supply curve, recognise that the rectangular area to the left of the curve and below the wage represents total earnings, which includes both transfer earnings and economic rent, and is therefore not a pure measure of transfer earnings.
Step-by-Step Reasoning
-
Definition: Transfer earnings are the minimum payment necessary to keep a factor of production in its present occupation. Graphically, this is the area under the supply curve up to the quantity employed, valued at the equilibrium wage.
-
Diagram 1 (Upward-sloping supply): The supply curve slopes upward, indicating that higher wages are needed to attract more labour. Area 2 is bounded by the supply curve, the quantity axis, and the equilibrium wage line. This area represents the sum of all individual workers' transfer earnings. Area 1, located between the wage line and the supply curve, represents economic rent - payments above the minimum required.
-
Diagram 2 (Perfectly elastic supply): The supply curve is horizontal at the equilibrium wage, meaning workers will supply any quantity at this specific wage. Area 3 is the rectangle below this supply curve. Since the supply curve coincides with the wage line, the entire payment constitutes transfer earnings, and there is no economic rent.
-
Diagram 3 (Perfectly inelastic supply): The supply curve is vertical, indicating a fixed quantity of labour supplied regardless of the wage (above some minimum). Area 4 is the rectangle bounded by the equilibrium wage, the quantity axis, and the vertical supply curve. This represents the total wage bill. However, because the supply curve is vertical, the area under the supply curve (the true transfer earnings) is only the portion up to the minimum acceptable wage. If the equilibrium wage exceeds this minimum, area 4 includes both transfer earnings and economic rent. Therefore, area 4 does not purely represent transfer earnings.
-
Conclusion: Only areas 2 and 3 purely and completely represent transfer earnings.
Key Takeaways
- Transfer earnings are consistently defined as the area under the supply curve and below the equilibrium wage.
- Economic rent is the area above the supply curve and below the equilibrium wage.
- The elasticity of supply affects the distribution between transfer earnings and economic rent, but the method of identification remains the same.
- With a vertical supply curve, the rectangular area under the wage includes both transfer earnings and rent unless the supply curve originates at the wage level.
Common Mistakes
- Selecting area 1: Students often confuse economic rent with transfer earnings, not realising that area 1 is above the supply curve.
- Selecting area 4: Students may incorrectly assume the rectangular area in the vertical supply diagram represents transfer earnings, failing to recognise that it includes economic rent when the wage exceeds the minimum supply price.
- Failing to apply the definition consistently across different supply curve shapes.
- Misinterpreting the horizontal supply curve: some students think area 3 is zero or irrelevant, not realising it represents the total transfer earnings when supply is perfectly elastic.
Things to Be Careful About
- Always locate the supply curve first; it defines the minimum acceptable wage.
- Ensure you are identifying the area strictly under the supply curve, not merely any area below the wage.
- In diagram 3, note that the supply curve is vertical and area 4 is to the left of it. This makes it the total wage bill, not just transfer earnings.
- Check that you are not confusing the demand curve with the supply curve; transfer earnings are always related to the supply of labour.
An initial injection into the circular flow of income causes a much larger increase in GDP.
What does this define?
Options
A autonomous investment
B demand-pull inflation
C the accelerator principle
D the national income multiplier
The national income multiplier is defined as the ratio of a change in national income (GDP) to the initial change in aggregate expenditure that caused it. The phrase 'much larger increase in GDP' directly describes the multiplier effect. Autonomous investment (A) is a component of aggregate demand, not a mechanism causing amplified changes. Demand-pull inflation (B) is a rise in the price level resulting from excess demand. The accelerator principle (C) states that the level of investment depends on the rate of change of national income, not on an initial injection leading to a multiplied output increase. Therefore, the correct definition is the national income multiplier.
Answer
D
D
Background Concept
The circular flow of income model shows that an injection (e.g., investment, government spending, exports) into the economy sets off a chain of additional spending rounds because one person's spending becomes another person's income, which is then partly re-spent. The national income multiplier is the factor by which GDP changes in response to an initial change in aggregate expenditure. Its size depends on the marginal propensities to consume, tax, and import. The multiplier effect is central to understanding how changes in spending affect national income.
Understanding the Question
The question presents a statement: 'An initial injection into the circular flow of income causes a much larger increase in GDP.' It asks which economic concept this defines. This is a straightforward recall of the multiplier's definition. The options test whether you can distinguish the multiplier from other macro concepts: autonomous investment (a component of AD that does not itself describe a multiplied effect), demand-pull inflation (a rise in the price level), and the accelerator principle (investment induced by changes in output). The correct answer is D.
Approach
Recognise the key phrase 'much larger increase' indicating a multiplied effect. Eliminate options that do not match:
- A: autonomous investment is simply investment independent of income; it is an injection but does not describe a multiplied effect.
- B: demand-pull inflation is about rising prices, not an increase in real GDP.
- C: the accelerator principle links investment to the rate of change of output, not the multiple from a single injection.
- D: the national income multiplier exactly describes the amplified effect of an injection on GDP.
Step-by-Step Reasoning
- The statement is the textbook definition of the multiplier: an initial injection (e.g., an increase in investment) leads to a final increase in national income that is a multiple of the initial injection.
- Option A, autonomous investment, refers to investment that is independent of income, often driven by interest rates or business confidence. It does not inherently cause a multiplied increase in GDP.
- Option B, demand-pull inflation, occurs when aggregate demand exceeds supply at full employment, raising the price level. It is a possible consequence of the multiplier process but not its definition.
- Option C, the accelerator principle, states that investment is proportional to the change in output (I = v * change in Y). It describes induced investment, not the multiplied effect of an injection on output.
- Therefore, only option D correctly identifies the concept described.
Key Takeaways
- The multiplier is a fundamental concept explaining how initial spending changes are amplified through the circular flow.
- It is distinct from the accelerator (which relates investment to output changes) and from inflation (which is about price levels).
- Recognising key phrases like 'much larger increase' points directly to the multiplier.
Common Mistakes
- Confusing the multiplier with the accelerator. The accelerator relates investment to the change in output; the multiplier relates output change to an initial injection.
- Thinking that the multiplier definition includes autonomous investment. Autonomous investment is a type of injection, but the multiplier is the process, not the injection itself.
- Associating 'much larger increase' with inflation, but the question specifies 'increase in GDP', not prices.
Things to Be Careful About
- Read the question exactly: 'increase in GDP' implies real output, not prices.
- The multiplier can lead to either real GDP growth or inflation depending on the economy's capacity, but the definition is about the change in output.
- Always check each option against the precise definition; do not assume a concept just because it sounds related.
An increase in a country’s inflation rate causes real incomes to decline, but consumers decide to maintain their living standards.
What has increased?
Options
A autonomous consumer spending
B autonomous saving
C induced consumer spending
D induced savings
Reasoning
When real incomes decline due to higher inflation, induced consumption, which depends on income, would be expected to fall. However, the scenario states that consumers maintain their living standards, meaning total consumption stays constant. For total consumption to remain unchanged despite the fall in induced consumption, autonomous consumption must have increased. Autonomous consumption is spending that is independent of current income, such as spending financed by savings or borrowing. Therefore, autonomous consumer spending has increased.
Answer
A
A
Background Concept
Consumption has two components: autonomous consumption (independent of income) and induced consumption (dependent on income). The consumption function is C = a + bY, where a is autonomous consumption and bY is induced consumption. Similarly, saving function S = -a + (1-b)Y. When income changes, induced consumption changes, but autonomous consumption is constant. In this question, consumers maintain their living standards despite falling real incomes, which implies that total consumption does not fall as much as induced consumption would predict. This suggests that autonomous consumption has increased to offset the fall in induced consumption.
Understanding the Question
The question presents a scenario: inflation causes real incomes to decline, but consumers decide to maintain their living standards. They ask: what has increased? The options are different types of consumer spending and saving. The key is to understand that maintaining living standards means keeping consumption spending constant despite lower income. If consumption were purely induced, it would fall. So there must be an increase in the autonomous part of consumption to keep total consumption unchanged. Alternatively, if consumers reduced saving, that would also support consumption, but the option "autonomous saving" is about saving independent of income, not about dissaving. Autonomous saving is the negative of autonomous consumption, so an increase in autonomous saving would reduce consumption. So only autonomous consumer spending (consumption) fits.
Approach
Identify the components of consumption: autonomous and induced. Recognize that induced consumption changes with income, while autonomous consumption is independent. Given that real income falls but consumption is maintained, the only way to keep total consumption constant is if autonomous consumption increases. Then check the other options: induced consumption would fall, not increase; autonomous saving would increase consumption? Actually, if autonomous saving increases, that means consumers save more at each income level, which would reduce consumption. So that would not maintain consumption. Induced savings would also fall with income. Therefore, only option A is correct.
Step-by-Step Reasoning
- Inflation reduces real incomes -> disposable income falls.
- Normally, a fall in income leads to a fall in induced consumption and induced saving (since both depend on income).
- However, the scenario says consumers maintain their living standards, meaning total consumption remains constant.
- Total consumption = autonomous consumption + induced consumption.
- Induced consumption falls as income falls.
- To keep total consumption constant, autonomous consumption must increase.
- Autonomous consumption is spending that does not depend on current income, e.g., spending financed by savings or borrowing.
- Therefore, autonomous consumer spending has increased.
- Option B: autonomous saving – if autonomous saving increased, that would mean consumers save more at each income level, reducing consumption, so cannot maintain living standards.
- Option C: induced consumer spending – this falls with income, so it cannot increase.
- Option D: induced savings – also falls with income, so cannot increase.
Hence, A is correct.
Key Takeaways
- Distinguish between autonomous and induced components of consumption and saving.
- Understand that autonomous consumption is independent of income, while induced consumption changes with income.
- In real-world scenarios, consumers can maintain consumption by drawing on savings or borrowing, which increases autonomous consumption.
- This question tests the application of the consumption function to a macroeconomic situation.
Common Mistakes
- Confusing autonomous and induced: assuming that all consumption falls with income.
- Thinking that saving autonomous means dissaving.
- Not realizing that maintaining consumption despite falling income implies an increase in autonomous consumption.
- Selecting induced consumption because they think consumers are spending more on consumption, but it's induced by income, not autonomous.
Things to Be Careful About
- The question says "consumers decide to maintain their living standards" – that means they keep consumption constant, not increase it.
- The increase in inflation reduces real incomes, so nominal incomes may be rising but real incomes fall.
- The terms "autonomous" and "induced" are specific to the consumption function; ensure you know their definitions.
- Watch out for the wording: "autonomous consumer spending" is the same as autonomous consumption.
Which combination of income tax and government benefit payment systems will produce automatic stabilisation?
Options
| income tax | benefit payments system | |
|---|---|---|
| A | progressive | means tested |
| B | progressive | universal |
| C | regressive | means tested |
| D | regressive | universal |
Reasoning
Automatic stabilisers are fiscal mechanisms that reduce the amplitude of economic fluctuations without discretionary government action. They work by automatically increasing government spending and decreasing tax revenue during a recession, and doing the opposite during a boom.
A progressive income tax system takes a higher proportion of income as income rises. During a boom, rising incomes push people into higher tax brackets, increasing the tax burden and dampening aggregate demand. During a recession, falling incomes push people into lower brackets, reducing the tax burden and supporting disposable income.
A means-tested benefit system pays benefits only to those whose income falls below a threshold. During a recession, more people qualify, so benefit spending rises automatically, supporting aggregate demand. During a boom, fewer qualify, so spending falls.
A universal benefit system pays the same amount to everyone regardless of income, so it does not automatically respond to the economic cycle. A regressive tax system takes a lower proportion of income as income rises, so it does not automatically dampen booms or support recessions.
Therefore, the combination that produces automatic stabilisation is a progressive income tax and a means-tested benefit system.
Answer
A
A
Background Concept
Automatic stabilisers are features of a government's fiscal system that automatically reduce the size of economic fluctuations without the need for new legislation or discretionary policy changes. They are a key part of the 'built-in' stabilising mechanism of a modern economy.
They work through two main channels:
- Taxation: When the economy booms and incomes rise, tax revenues automatically increase. This takes some of the extra income out of the circular flow, dampening the rise in aggregate demand. When the economy slows and incomes fall, tax revenues automatically decrease, leaving more disposable income in the hands of households and firms, which cushions the fall in aggregate demand.
- Government Spending: Certain types of government spending, particularly on welfare benefits, automatically increase during a recession (as more people become eligible) and decrease during a boom (as fewer people are eligible). This provides a direct injection of spending into the economy when it is weak and reduces it when it is strong.
The effectiveness of automatic stabilisers depends on the structure of the tax and benefit system.
Understanding the Question
This question asks you to identify which combination of an income tax system and a government benefit payment system will produce automatic stabilisation. The key is to understand how each system behaves over the economic cycle.
- Income Tax: The question asks about 'progressive' vs 'regressive' income tax.
- Progressive: The average tax rate rises as income rises. Higher earners pay a larger percentage of their income in tax.
- Regressive: The average tax rate falls as income rises. Lower earners pay a larger percentage of their income in tax. (A flat-rate tax is proportional, not regressive, but a regressive system takes a higher proportion from the poor).
- Benefit Payments System: The question asks about 'means tested' vs 'universal' benefits.
- Means Tested: Benefits are paid only to individuals or households whose income or wealth falls below a certain threshold. Eligibility is based on a test of means.
- Universal: Benefits are paid to everyone in a certain category (e.g., all children, all pensioners) regardless of their income or wealth.
Approach
To answer this, we need to evaluate each combination against the definition of an automatic stabiliser. An automatic stabiliser must automatically increase the budget deficit (or reduce the surplus) during a recession and automatically decrease the deficit (or increase the surplus) during a boom.
- Evaluate the tax system: Does it automatically take more out of the economy during a boom and less during a recession?
- Evaluate the benefit system: Does it automatically put more into the economy during a recession and less during a boom?
- The correct answer is the combination where BOTH the tax and benefit systems act as automatic stabilisers.
Step-by-Step Reasoning
Let's analyse each option:
Option A: Progressive income tax + Means-tested benefits
- Progressive Tax: During a boom, incomes rise. People move into higher tax brackets, so the government takes a larger share of the increased income. This dampens the rise in disposable income and aggregate demand. During a recession, incomes fall. People move into lower tax brackets, so the government takes a smaller share. This supports disposable income. This acts as an automatic stabiliser.
- Means-tested Benefits: During a recession, more people lose their jobs or see their incomes fall below the threshold, so they become eligible for benefits. Government spending on benefits automatically rises, injecting money into the economy. During a boom, fewer people are eligible, so benefit spending falls. This acts as an automatic stabiliser.
- Conclusion: Both components work to stabilise the economy. This is the correct combination.
Option B: Progressive income tax + Universal benefits
- Progressive Tax: Acts as an automatic stabiliser (as explained above).
- Universal Benefits: These are paid regardless of income. The amount paid does not change with the economic cycle. A child benefit paid to all families, for example, is the same in a boom as in a recession. This does NOT act as an automatic stabiliser.
- Conclusion: Only one component works. This is not the best combination for automatic stabilisation.
Option C: Regressive income tax + Means-tested benefits
- Regressive Tax: During a boom, the incomes of the rich rise, but they pay a lower percentage. The tax system does not take a significantly larger share of the increased national income. During a recession, the poor, who pay a higher percentage of their income, see their incomes fall, but the tax burden on them remains high. This system does not effectively dampen booms or cushion recessions. This does NOT act as an automatic stabiliser.
- Means-tested Benefits: Acts as an automatic stabiliser (as explained above).
- Conclusion: Only one component works. This is not the best combination.
Option D: Regressive income tax + Universal benefits
- Regressive Tax: Does not act as an automatic stabiliser.
- Universal Benefits: Does not act as an automatic stabiliser.
- Conclusion: Neither component works. This is the worst combination for automatic stabilisation.
Therefore, only Option A provides a combination where both the tax and benefit systems work together to automatically stabilise the economy.
Key Takeaways
- Automatic stabilisers are built-in fiscal mechanisms that reduce economic fluctuations without discretionary policy changes.
- Progressive taxes are automatic stabilisers because the tax burden rises in booms and falls in recessions.
- Means-tested benefits are automatic stabilisers because spending rises in recessions and falls in booms.
- Regressive taxes and universal benefits do not provide automatic stabilisation.
Common Mistakes
- Confusing progressive and regressive taxes: A common mistake is to think a regressive tax (which takes a higher proportion from the poor) is the same as a proportional tax. A regressive tax does not automatically adjust to the economic cycle in a stabilising way.
- Thinking all government spending is an automatic stabiliser: Only spending that is sensitive to the economic cycle (like means-tested benefits) acts as an automatic stabiliser. Universal benefits are a fixed cost and do not fluctuate with the cycle.
- Focusing on only one side of the fiscal system: The question asks for a combination. A student might correctly identify that progressive taxes are a stabiliser but forget to check the benefit system, or vice versa.
Things to Be Careful About
- Definition of 'automatic': The key is that the stabilisation happens automatically, without any new government decision. Discretionary fiscal policy (e.g., a new stimulus package) is different.
- The direction of the effect: An automatic stabiliser must dampen the cycle. It should reduce the boom and cushion the recession. A system that amplifies the cycle (e.g., a regressive tax that takes more from the poor during a recession) is a destabiliser.
- 'Means-tested' vs 'Universal': Understand the difference. Means-tested benefits are conditional on income; universal benefits are not. This conditionality is what makes them responsive to the economic cycle.
The diagram shows the actual and forecast changes in GDP for a country between 2020 and 2040.
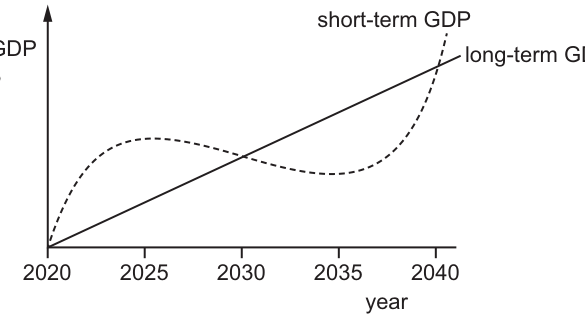
What is the longest period over which this country is expected to experience a recession?
Options
A 2025 to 2030
B 2025 to 2035
C 2030 to 2035
D 2030 to 2040
Reasoning
A recession is a period of falling real GDP (negative economic growth). On the diagram, the dashed short-term GDP line falls continuously from its peak in 2025 until it reaches its trough in 2035. This 10-year period is the longest interval of decline shown.
Answer
B
B
Background Concept
Economic growth is measured by the annual percentage increase in real GDP. The business cycle describes the recurring fluctuations in economic activity around the long-term trend growth path. The cycle has four main phases: expansion (GDP rising), peak (GDP stops rising), contraction or recession (GDP falling), and trough (GDP stops falling). A recession is specifically defined as a period of falling real GDP. It is important to distinguish between the long-term trend growth (the straight line showing the economy's underlying growth potential) and short-term actual GDP (the fluctuating line showing the economy's performance around that trend). When the short-term line is above the trend, the economy is in an expansionary phase; when it is below and falling, it is in recession.
Understanding the Question
The question presents a diagram (Fig. 18.1) showing GDP on the vertical axis and years from 2020 to 2040 on the horizontal axis. There are two lines: a solid straight line representing long-term GDP growth, and a dashed line representing short-term GDP. The question asks for the longest period over which the country is expected to experience a recession. This requires identifying the longest continuous downward-sloping section of the dashed short-term GDP line, as a recession corresponds to a period where GDP is falling from year to year.
Approach
To answer this question, follow these steps:
- Identify which line represents actual short-term GDP (the dashed line).
- Identify what a recession looks like on the graph: a period where the short-term GDP line is sloping downwards.
- Trace the dashed line from left to right (2020 to 2040) and note the direction of movement:
- Rising from 2020 to approximately 2025 (expansion)
- Falling from approximately 2025 to 2035 (recession)
- Rising from 2035 to 2040 (recovery)
- Determine the longest continuous falling period: this is from 2025 to 2035.
- Match this to the given options.
Step-by-Step Reasoning
-
Identify the relevant curve: The dashed line is labelled 'short-term GDP' and represents the actual GDP path around the long-term trend. This is the line that fluctuates and shows the business cycle.
-
Define recession on the graph: A recession occurs when GDP is falling. On the graph, this appears as a downward-sloping section of the short-term GDP line. The economy is in recession as long as the dashed line is moving downwards from one year to the next.
-
Analyse the timeline:
- From 2020 to 2025: The dashed line rises, meaning GDP is increasing. This is economic growth/expansion.
- From 2025 to 2035: The dashed line falls continuously. GDP is decreasing each year. This is a recession. The duration is 10 years (2035 minus 2025).
- From 2035 to 2040: The dashed line rises again, meaning GDP is increasing. This is recovery/expansion.
-
Evaluate the options:
- Option A (2025 to 2030): This covers only the first half of the recession period. Incorrect.
- Option B (2025 to 2035): This covers the entire period during which the short-term GDP line is falling. Correct.
- Option C (2030 to 2035): This covers only the second half of the recession period. Incorrect.
- Option D (2030 to 2040): This incorrectly includes the recovery period from 2035 to 2040, during which GDP is rising. Incorrect.
-
Conclusion: The longest recession period is from 2025 to 2035, so the correct answer is B.
Key Takeaways
- A recession is a period of falling real GDP (negative economic growth).
- On a GDP time-series graph, a recession is shown by a downward-sloping section of the actual GDP line.
- The business cycle consists of alternating periods of expansion (rising GDP) and contraction/falling GDP (recession).
- Always distinguish between the long-term trend (straight line) and short-term actual GDP (fluctuating line) when analysing business cycle diagrams.
Common Mistakes
- Confusing the lines: Some students look at the straight long-term line and think it shows fluctuations. The long-term line always slopes upward (growth); only the dashed short-term line shows the cycle.
- Selecting a partial period: Options A and C represent only portions of the recession. The question asks for the longest period, which requires identifying the full extent of the decline.
- Including recovery years: Option D includes 2035-2040, when GDP is rising again. A recession ends when GDP stops falling, not when it returns to the trend line.
- Misreading the peak or trough: The peak is at 2025 (where the line stops rising and starts falling), and the trough is at 2035 (where the line stops falling and starts rising).
Things to Be Careful About
- Ensure you are reading the dashed short-term GDP line, not the solid long-term trend line.
- A recession is defined by the direction of change (falling GDP), not by whether GDP is above or below the trend line. While the short-term line is below the trend during much of the recession, the defining feature is the downward slope.
- Check the horizontal axis labels carefully. The fall begins at 2025 and ends at 2035, giving a 10-year recession period.
The diagram outlines the monetary transmission mechanism following quantitative easing. Key words have been omitted from the process.
central bank ......1...... government assets
↓
short-term interest rates ......2......
↓
investment ......3......
↓
real GDP rises
Which words complete gaps 1, 2 and 3?
Options
| 1 | 2 | 3 | |
|---|---|---|---|
| A | buys | fall | rises |
| B | buys | rise | rises |
| C | sells | fall | rises |
| D | sells | fall | falls |
Quantitative easing (QE) involves the central bank buying government assets (bonds) from commercial banks. This increases the money supply and reduces short-term interest rates. Lower interest rates encourage investment (capital spending) by firms, which increases aggregate demand and raises real GDP. Therefore, the correct sequence is: central bank buys government assets → short-term interest rates fall → investment rises → real GDP rises. This matches option A.
Answer
A
A
Background Concept
Quantitative easing (QE) is an unconventional monetary policy tool used by central banks when conventional policy (adjusting the policy interest rate) is no longer effective, typically when interest rates are already near zero. The central bank creates new money electronically to purchase financial assets, usually government bonds, from commercial banks and other financial institutions. This increases the reserves of the banking system, lowers long-term interest rates, and encourages lending and investment. The monetary transmission mechanism describes the chain of cause and effect through which a change in monetary policy affects the real economy.
Understanding the Question
The question presents a simplified diagram of the monetary transmission mechanism following quantitative easing. Three key words are missing: the action of the central bank (buys or sells assets), the effect on short-term interest rates (rise or fall), and the effect on investment (rise or fall). The candidate must select the correct combination from four options. The correct answer is A: buys, fall, rises.
Approach
Recall the purpose and mechanics of quantitative easing. QE is an expansionary policy: the central bank injects money into the economy by purchasing assets. This increases the money supply, which puts downward pressure on interest rates. Lower interest rates reduce the cost of borrowing, stimulating investment spending. Higher investment increases aggregate demand, leading to a rise in real GDP. The chain is: central bank buys assets → interest rates fall → investment rises → GDP rises.
Step-by-Step Reasoning
- Gap 1: central bank ______ government assets.
- In QE, the central bank buys government assets (bonds) from the private sector. This is the opposite of selling assets, which would be contractionary. So 'buys' is correct.
- Gap 2: short-term interest rates ______.
- When the central bank buys assets, it increases the demand for bonds, raising their prices. Bond prices and interest rates are inversely related, so interest rates fall. Also, the increase in bank reserves tends to lower short-term rates. So 'fall' is correct.
- Gap 3: investment ______.
- Lower interest rates reduce the cost of borrowing for firms, making investment projects more profitable. Firms increase capital spending, so investment rises. This increases aggregate demand and ultimately real GDP. So 'rises' is correct.
Thus, the only option with buys, fall, rises is A.
Key Takeaways
- Quantitative easing is an expansionary monetary policy involving the purchase of assets by the central bank.
- The transmission mechanism: asset purchases → lower interest rates → higher investment → higher aggregate demand and GDP.
- Understanding the direction of each step is crucial: buying assets lowers rates; lower rates stimulate investment.
Common Mistakes
- Confusing QE with conventional monetary policy: in conventional policy, the central bank buys or sells short-term government securities to influence the policy rate. QE targets longer-term assets and is used when short-term rates are already at the zero lower bound.
- Thinking that QE raises interest rates: because QE increases the money supply, some might incorrectly assume it raises interest rates. In fact, it lowers both short-term and long-term rates.
- Misidentifying the effect on investment: if interest rates fall, investment rises; if they rise, investment falls.
Things to Be Careful About
- The diagram is a simplified representation; in reality, the transmission mechanism is more complex and includes effects on asset prices, exchange rates, and expectations.
- The question specifically refers to 'short-term interest rates' – QE primarily affects long-term rates, but the diagram simplifies to short-term rates. Accept the simplified chain as given.
- Always read the options carefully: the combination must be consistent across all three gaps.
A government decreases interest rates to reduce unemployment but finds this has little effect due to hysteresis.
What causes this hysteresis?
Options
A capital investment increases
B fewer people are encouraged to save
C skills of unemployed workers become outdated
D the money supply increases
Answer
Hysteresis refers to the persistence of high unemployment after the initial cause (e.g. a recession) has passed. The key mechanism is that long-term unemployed workers lose their skills and become less attractive to employers, so even when aggregate demand recovers, they remain unemployed. This is a structural change in the labour market, not a cyclical one.
Answer
C
C
Background Concept
Hysteresis in economics describes a situation where the long-run equilibrium of a variable depends on its past path. In the labour market, it means that a temporary rise in unemployment can become permanent because the unemployed workers' characteristics change. The natural rate of unemployment (the rate consistent with stable inflation) can therefore rise after a deep recession, even if the recession itself was purely cyclical.
Understanding the Question
The question states that a government cuts interest rates (expansionary monetary policy) to reduce unemployment, but the policy has little effect because of hysteresis. The question asks: what causes this hysteresis? The answer must be the specific mechanism that makes unemployment persist after demand recovers.
Approach
Identify the core mechanism of hysteresis in the labour market: the deterioration of human capital among the long-term unemployed. Then eliminate the other options that describe different phenomena.
Step-by-Step Reasoning
- Option A: capital investment increases – This would typically raise labour demand and reduce unemployment, not cause it to persist. It is the opposite of hysteresis.
- Option B: fewer people are encouraged to save – This is a short-run effect of lower interest rates on consumption, not a cause of persistent unemployment.
- Option C: skills of unemployed workers become outdated – This is the classic hysteresis mechanism. When workers are unemployed for a long time, they lose job-specific skills, become less productive, and may be perceived as less employable. Even when aggregate demand rises, firms prefer to hire workers who have remained employed or are more recently unemployed. This raises the natural rate of unemployment.
- Option D: the money supply increases – This is a consequence of the interest rate cut (monetary policy), not a cause of hysteresis. It would tend to stimulate AD and reduce unemployment in the short run, not cause persistence.
Therefore, the correct answer is C.
Key Takeaways
- Hysteresis explains why unemployment can remain high long after the original shock has passed.
- The key mechanism is the erosion of skills and employability of the long-term unemployed.
- This concept is critical for understanding why expansionary demand-side policies may be insufficient to reduce unemployment after a deep recession.
Common Mistakes
- Confusing hysteresis with cyclical unemployment: hysteresis is about the persistence of unemployment, not its initial cause.
- Selecting option B because lower interest rates reduce saving, but that is a short-run demand effect, not a cause of hysteresis.
- Selecting option D because the money supply increases when interest rates are cut, but that is the policy itself, not the reason it fails.
Things to Be Careful About
- Hysteresis is a structural phenomenon, not a cyclical one. It changes the natural rate of unemployment.
- The question asks for the cause of hysteresis, not the definition or the policy response.
In a closed economy, the central bank raises interest rates to reduce an increasing rate of inflation.
Which macroeconomic policy objective is this targeting?
Options
A a surplus on the current account of the balance of payments
B faster economic growth
C full employment
D stable prices
Raising interest rates is a monetary policy tool used to reduce aggregate demand and curb inflation. The objective of reducing an increasing rate of inflation is to achieve stable prices. Among the options, only stable prices (option D) directly corresponds to this goal. A surplus on the current account (A) is a balance of payments objective, faster economic growth (B) is a growth objective, and full employment (C) is an employment objective. Therefore, the correct answer is D.
Answer
D
D
Background Concept
Macroeconomic policy objectives are the goals that governments and central banks aim to achieve through economic policies. Common objectives include stable prices (low inflation), full employment, economic growth, and a sustainable balance of payments. Monetary policy, such as changing interest rates, is often used to influence aggregate demand and thereby affect these objectives. In a closed economy, there is no international trade, so the balance of payments is not a direct concern.
Understanding the Question
The question describes a scenario: a closed economy where the central bank raises interest rates to reduce an increasing rate of inflation. It asks which macroeconomic policy objective this action is targeting. The options are: a surplus on the current account (A), faster economic growth (B), full employment (C), and stable prices (D). The key is to recognise that raising interest rates is a contractionary monetary policy aimed at reducing inflation, which is directly linked to the objective of stable prices.
Approach
Identify the primary effect of raising interest rates: it reduces borrowing and spending, which lowers aggregate demand and helps control inflation. Then match this effect to the correct objective among the options. Eliminate options that are not directly targeted by this policy: a current account surplus is not a typical objective in a closed economy; faster economic growth is usually promoted by lower interest rates, not higher; full employment is also supported by lower interest rates. Therefore, stable prices is the correct objective.
Step-by-Step Reasoning
- The central bank raises interest rates. This makes borrowing more expensive and saving more attractive, reducing consumption and investment.
- Lower consumption and investment reduce aggregate demand (AD).
- With lower AD, there is less pressure on prices, so the rate of inflation decreases.
- The goal of reducing inflation is to achieve price stability, which is the objective of stable prices.
- Option A (surplus on current account) is not relevant in a closed economy and is not directly targeted by interest rate changes.
- Option B (faster economic growth) would be hindered by higher interest rates, as they slow down economic activity.
- Option C (full employment) would also be negatively affected, as higher interest rates can increase unemployment.
- Therefore, the only objective that aligns with raising interest rates to reduce inflation is stable prices (option D).
Key Takeaways
- Raising interest rates is a contractionary monetary policy used to combat inflation.
- The primary objective of such a policy is price stability.
- Different macroeconomic objectives may conflict; for example, reducing inflation can slow growth and increase unemployment.
- In a closed economy, balance of payments objectives are not applicable.
Common Mistakes
- Confusing the objective of stable prices with other objectives like growth or employment. Students might think that raising interest rates could promote growth by reducing inflation, but the direct effect is contractionary.
- Overlooking the closed economy condition and selecting a balance of payments objective.
- Assuming that any policy that reduces inflation automatically promotes growth, which is not necessarily true in the short run.
Things to Be Careful About
- Always read the question carefully: note that the economy is closed, so external objectives are irrelevant.
- Understand that raising interest rates is a tool to reduce inflation, not to achieve growth or employment.
- Remember that macroeconomic objectives are often in conflict; a policy that targets one objective may harm another.
A government sets a target for the annual rate of inflation to be no more than 3%.
Which circumstances would make it difficult to achieve the target?
Options
A if devaluation of the currency leads to a trade surplus
B if interest rates are increased to control effective demand
C if the government increases its tax revenue
D if wage increases are kept in line with productivity
Answer
A devaluation makes imports more expensive in domestic currency. This directly raises the domestic price of imported raw materials and finished goods, increasing the general price level. If the Marshall-Lerner condition is met and the trade balance improves, the resulting trade surplus adds to aggregate demand, further increasing inflationary pressure. Therefore, devaluation makes it harder to keep inflation below 3%.
Option B is incorrect because higher interest rates reduce aggregate demand and dampen inflation. Option C is incorrect because higher tax revenue (from higher tax rates or a growing economy) reduces disposable income and spending, lowering inflationary pressure. Option D is incorrect because wage increases matching productivity growth do not raise unit labour costs and are not inflationary.
Answer
A
A
Background Concept
Inflation is a sustained increase in the general price level. A government may target a specific rate, such as 3% per year. The question tests the candidate's understanding of the channels through which different economic events affect inflation. A devaluation (a fall in the value of the domestic currency under a managed or floating exchange rate system) has two main inflationary channels: a direct cost-push effect through higher import prices, and a potential demand-pull effect if the trade balance improves.
Understanding the Question
The question asks which of four circumstances would make it difficult for a government to achieve a 3% inflation target. The candidate must identify the option that is inflationary (or at least not disinflationary) and distinguish it from the other three options, which are all deflationary or neutral. The correct answer is A: devaluation leading to a trade surplus.
Approach
Evaluate each option in turn, tracing the chain of causation to its effect on the price level. For option A, consider both the direct effect (higher import prices) and the indirect effect (increased aggregate demand from a trade surplus). For options B, C, and D, explain why each reduces or does not increase inflationary pressure.
Step-by-Step Reasoning
Option A: devaluation of the currency leads to a trade surplus.
A devaluation makes exports cheaper in foreign currency and imports more expensive in domestic currency. This directly raises the domestic price of imported goods, including raw materials, components, and finished consumer goods. Firms facing higher input costs may pass these on to consumers, causing cost-push inflation. Additionally, if the Marshall-Lerner condition holds (the sum of the price elasticities of demand for exports and imports is greater than 1), the trade balance improves, creating a trade surplus. A trade surplus means net exports (X-M) increase, which is a component of aggregate demand (AD = C+I+G+(X-M)). Higher AD, if the economy is near full capacity, pulls up the general price level (demand-pull inflation). Thus, devaluation makes it harder to keep inflation below 3%.
Option B: if interest rates are increased to control effective demand.
Higher interest rates raise the cost of borrowing and increase the return on saving. This reduces consumption and investment spending, lowering aggregate demand. Lower AD reduces demand-pull inflationary pressure. This helps achieve the inflation target.
Option C: if the government increases its tax revenue.
Higher tax revenue could result from higher tax rates or from economic growth. Higher tax rates reduce disposable income and consumption, lowering AD and inflationary pressure. Even if the revenue comes from growth, the government is not necessarily spending it; if it runs a budget surplus, this is contractionary fiscal policy, reducing AD. This helps achieve the inflation target.
Option D: if wage increases are kept in line with productivity.
If wages rise at the same rate as labour productivity, unit labour costs remain constant. Firms have no cost-push reason to raise prices. This is non-inflationary and consistent with stable prices. This helps achieve the inflation target.
Key Takeaways
- A devaluation is inflationary through both cost-push (higher import prices) and demand-pull (improved trade balance) channels.
- Contractionary monetary policy (higher interest rates) and contractionary fiscal policy (higher taxes) reduce aggregate demand and help control inflation.
- Wage increases matched by productivity growth do not cause inflation.
- The Marshall-Lerner condition is a key concept linking devaluation to the trade balance.
Common Mistakes
- Confusing devaluation with depreciation: devaluation is a deliberate policy under a fixed exchange rate; depreciation is a market-driven fall under a floating rate. Both have the same inflationary effects.
- Thinking that a trade surplus is always good: while it may boost GDP, it also adds to demand-pull inflation.
- Assuming higher tax revenue automatically means higher government spending (it does not; the government could run a surplus).
- Forgetting that wage increases matching productivity are non-inflationary.
Things to Be Careful About
- Read the question carefully: it asks which circumstance makes it difficult to achieve the target, i.e., which is inflationary.
- Trace the full chain of causation for each option, not just the first step.
- Remember that a trade surplus is an injection into the circular flow, increasing AD.
- Distinguish between cost-push and demand-pull inflation channels.
The central bank of a country decreases interest rates.
What are the likely consequences?
Options
| internal value of the currency | external value of the currency | |
|---|---|---|
| A | falls | falls |
| B | falls | rises |
| C | rises | falls |
| D | rises | rises |
Answer
A decrease in interest rates reduces the cost of borrowing and the return on saving, increasing consumption and investment. This raises aggregate demand, which tends to increase the price level, causing the internal value of the currency (its domestic purchasing power) to fall.
At the same time, lower interest rates reduce the return on holding assets in that currency, decreasing demand for the currency on foreign exchange markets. This causes the currency to depreciate, so its external value (the exchange rate) also falls.
Both the internal and external value fall.
Answer
A
A
Background Concept
The internal value of a currency refers to its purchasing power within the domestic economy — how many goods and services one unit of the currency can buy. This is inversely related to the domestic price level: if the price level rises (inflation), the internal value falls.
The external value of a currency is its price in terms of other currencies — the exchange rate. This is determined by supply and demand on the foreign exchange market.
A central bank's interest rate is a key policy tool. Changes in the interest rate affect both aggregate demand (and therefore the price level) and capital flows (and therefore the exchange rate).
Understanding the Question
The question asks what happens to both the internal and external value of a currency when the central bank decreases interest rates. It presents four combinations of 'falls' and 'rises' for the two values. The candidate must trace the causal chain from the interest rate change to each outcome.
Approach
- Internal value: Trace the effect of lower interest rates on aggregate demand, then on the price level, then on purchasing power.
- External value: Trace the effect of lower interest rates on capital flows and demand for the currency, then on the exchange rate.
- Combine the two results to identify the correct option.
Step-by-Step Reasoning
Step 1: Effect on the internal value
- A decrease in the central bank's interest rate makes borrowing cheaper for households and firms. It also reduces the return on savings, making saving less attractive relative to spending.
- Consumption (C) and investment (I) both rise. Since C and I are components of aggregate demand (AD = C + I + G + X - M), AD increases.
- If the economy is operating near or above full capacity, the increase in AD puts upward pressure on the general price level — demand-pull inflation occurs.
- As the price level rises, each unit of currency buys fewer goods and services. Therefore, the internal value of the currency falls.
Step 2: Effect on the external value
- Lower domestic interest rates reduce the return on financial assets (e.g., government bonds, bank deposits) denominated in that currency.
- International investors seeking the highest return will sell assets in this currency and buy assets in currencies offering higher interest rates. This reduces the demand for the domestic currency on the foreign exchange market.
- Simultaneously, domestic residents may find it cheaper to borrow in the domestic currency and invest abroad, increasing the supply of the domestic currency on forex markets.
- With demand falling and/or supply rising, the currency depreciates — its price in terms of other currencies falls. Therefore, the external value of the currency falls.
Step 3: Combine the results
Both the internal and external value fall. This corresponds to option A.
Key Takeaways
- The internal value of a currency is its domestic purchasing power, inversely related to the price level.
- The external value is the exchange rate.
- A cut in interest rates is expansionary for AD, tending to raise the price level (reducing internal value).
- A cut in interest rates also reduces capital inflows (or encourages outflows), causing depreciation (reducing external value).
- In the standard textbook case, both move in the same direction — down — following an interest rate cut.
Common Mistakes
- Confusing internal and external value: Some candidates think a lower interest rate makes the currency 'stronger' because it stimulates the economy, but the exchange rate effect works through capital flows, not growth.
- Assuming the exchange rate always rises with higher growth: While higher growth can attract FDI, the immediate capital-flow effect of lower interest rates dominates in the short run.
- Forgetting the price level channel: Some candidates correctly identify the exchange rate depreciation but miss the inflation effect on internal value.
Things to Be Careful About
- The question asks about the consequences of a decrease in interest rates. The answer assumes the economy is not in a liquidity trap and that capital is mobile.
- In the real world, the effect on the exchange rate also depends on expectations and the interest rate differential with other countries, but the standard model predicts depreciation.
- The internal value falls only if the increase in AD actually raises the price level. If the economy is in a deep recession with a large output gap, the increase in AD might raise output rather than prices. However, the question asks for the 'likely' consequences, and the standard prediction is a rise in the price level.
What is the most likely consequence when there is an increase in the national debt?
Options
A the creation of additional money
B a current account deficit on the balance of payments
C a surplus in the government’s budget
D the crowding out of private sector investment
Answer
An increase in the national debt means the government has borrowed more from the private sector (or from abroad). To finance the debt, the government issues bonds, which compete for loanable funds. This raises the interest rate and reduces private investment — the crowding-out effect. Therefore, the most likely consequence is the crowding out of private sector investment.
Answer
D
D
Background Concept
The national debt is the total accumulated borrowing of the central government. When the government runs a budget deficit (spending > tax revenue), it borrows by issuing bonds. These bonds are bought by individuals, banks, pension funds, and sometimes the central bank. The key macroeconomic consequence is the crowding-out effect: government borrowing absorbs a large share of the available loanable funds, pushing up the real interest rate. Higher interest rates make it more expensive for private firms to borrow for investment, so private investment falls. This is a classic argument against expansionary fiscal policy financed by borrowing.
Understanding the Question
The question asks for the most likely consequence of an increase in the national debt. It is a single-best-answer multiple-choice question. The four options are:
- A: creation of additional money
- B: a current account deficit
- C: a surplus in the government's budget
- D: crowding out of private sector investment
We must identify which of these is the direct and most probable result of a rising national debt, given standard macroeconomic theory.
Approach
Evaluate each option in turn:
- A (creation of additional money): This happens only if the central bank monetises the debt (buys government bonds with newly created money). That is a policy choice, not an automatic consequence. Most debt is financed by selling bonds to the private sector, which does not create money.
- B (current account deficit): A current account deficit can be caused by many factors (exchange rate, competitiveness, domestic demand). There is no direct, automatic link from national debt to the current account.
- C (surplus in the government's budget): A budget surplus is the opposite of a deficit. An increase in the national debt implies past or present deficits, not a surplus.
- D (crowding out of private sector investment): This is the standard theoretical consequence: government borrowing raises interest rates, reducing private investment.
Thus D is correct.
Step-by-Step Reasoning
- National debt increases → the government has borrowed more. This borrowing is typically done by issuing bonds to the private sector.
- Supply of loanable funds is fixed in the short run → the government's demand for funds competes with private borrowers.
- Interest rate rises → the price of borrowing increases.
- Private investment is sensitive to interest rates → firms postpone or cancel investment projects because the cost of capital is higher.
- Result → private sector investment falls (crowding out).
Option A (money creation) would require the central bank to buy the bonds (quantitative easing or direct monetisation). This is not automatic; it is a deliberate policy. Option B (current account deficit) is an indirect and uncertain effect — higher interest rates could appreciate the currency and worsen the current account, but this is not the most likely direct consequence. Option C (budget surplus) is contradictory: a surplus reduces the national debt, not increases it.
Key Takeaways
- The national debt rises when the government borrows to finance deficits.
- The crowding-out effect is the reduction in private investment caused by higher interest rates from government borrowing.
- Not all government borrowing leads to money creation; that depends on who buys the bonds.
- A budget surplus reduces the national debt, not increases it.
Common Mistakes
- Confusing the national debt with the money supply. They are different: the national debt is a stock of bonds; the money supply is the stock of money in circulation.
- Thinking that any government borrowing automatically creates money. Only central bank purchases of bonds (monetisation) create money.
- Choosing option C because of a misunderstanding: a surplus means the government is repaying debt, not increasing it.
Things to Be Careful About
- The question asks for the most likely consequence. In theory, crowding out is the standard direct effect. Other effects (like a current account deficit) are possible but less direct and less certain.
- Distinguish between the national debt (stock) and the budget deficit (flow). An increase in the stock of debt results from a flow of deficits.
- Remember that crowding out is a key critique of expansionary fiscal policy, especially when the economy is near full employment.
Which policy will help to reduce income inequality?
Options
A to increase indirect taxes
B to increase trade union power
C to increase the rate of interest
D to reduce welfare payments
Answer
Trade unions can negotiate higher wages for lower-paid workers, reducing wage differentials and thus income inequality. Therefore, increasing trade union power is the policy that helps reduce income inequality.
Answer
B
B
Background Concept
Income inequality refers to the uneven distribution of income among individuals or households in an economy. It is often measured using the Gini coefficient, where 0 represents perfect equality and 1 represents perfect inequality. Policies that affect the distribution of income can be evaluated by their impact on the incomes of different groups, particularly the poor relative to the rich.
Trade unions are organisations that represent workers in collective bargaining with employers. They can negotiate for higher wages, better working conditions, and other benefits. By increasing the bargaining power of workers, especially those in lower-paid occupations, trade unions can raise wages for the low-skilled, reducing the wage gap between high-skilled and low-skilled workers. This can help reduce income inequality.
Indirect taxes, such as VAT or sales taxes, are levied on goods and services. They are regressive because they take a larger proportion of income from low-income households, who spend a higher share of their income on consumption. Thus, increasing indirect taxes tends to increase income inequality.
Interest rates affect the cost of borrowing and the return on savings. Higher interest rates benefit savers (often wealthier individuals) and hurt borrowers (often lower-income individuals), but the overall effect on income distribution is ambiguous and depends on the structure of assets and debts.
Welfare payments, such as unemployment benefits or social security, provide income support to the poor. Reducing welfare payments directly reduces the incomes of the poorest, increasing income inequality.
Understanding the Question
The question asks which of the four policies will help reduce income inequality. It requires knowledge of how each policy affects the distribution of income. The correct answer is B: increase trade union power.
Approach
We evaluate each option based on its likely impact on income distribution. For trade unions, we consider their role in raising wages for lower-paid workers. For indirect taxes, we consider their regressive nature. For interest rates, we consider the ambiguous effect. For welfare payments, we consider the direct reduction in income for the poor.
Step-by-Step Reasoning
-
Option B: Increase trade union power. Trade unions can bargain for higher wages, particularly for low-skilled workers who may have less individual bargaining power. By raising the wages of the lower end of the wage distribution, trade unions can reduce the gap between high and low earners, thereby reducing income inequality. This is a well-established effect in labour economics, although there can be countervailing effects such as reduced employment if wages are pushed above market-clearing levels. However, on balance, increased union power tends to compress wage differentials.
-
Option A: Increase indirect taxes. Indirect taxes are regressive because low-income households spend a larger proportion of their income on taxed goods. Increasing such taxes therefore reduces the real income of the poor more than that of the rich, widening income inequality. This policy would not help reduce inequality.
-
Option C: Increase the rate of interest. Higher interest rates increase the return on savings, which benefits those with savings (typically higher-income individuals). They also increase the cost of borrowing, which disproportionately affects lower-income individuals who may have more debt. The net effect on income inequality is ambiguous and depends on the distribution of assets and liabilities. It is not a direct policy to reduce inequality and could potentially increase it.
-
Option D: Reduce welfare payments. Welfare payments are a key component of the social safety net, providing income to the poorest. Reducing them directly lowers the incomes of the poor, increasing income inequality. This policy would worsen inequality.
Thus, only option B is likely to reduce income inequality.
Key Takeaways
- Trade unions can reduce income inequality by raising wages for lower-paid workers.
- Indirect taxes are regressive and tend to increase inequality.
- Interest rate changes have ambiguous effects on income distribution.
- Welfare payments are important for reducing inequality; cutting them increases inequality.
- When evaluating policies for inequality, consider the direct and indirect effects on different income groups.
Common Mistakes
- Assuming that any policy that helps the poor reduces inequality, without considering effects on the rich. For example, increasing indirect taxes might raise revenue for social spending, but the direct effect is regressive.
- Overlooking the regressive nature of indirect taxes.
- Thinking that trade unions always increase inequality because they may create insider-outsider effects. While there are nuances, the general effect of increased union power is to reduce wage dispersion.
- Confusing income inequality with poverty. Reducing poverty does not necessarily reduce inequality if the rich also become richer.
Things to Be Careful About
- The question asks which policy "will help to reduce income inequality". It does not ask for the most effective or the only policy, but which one among the options is likely to have a reducing effect.
- Trade unions can have different effects depending on the institutional context. In some cases, they may only benefit skilled workers, but generally they are associated with lower wage inequality.
- The other options are clearly not helpful for reducing inequality, so B is the correct choice.
The value of the currency of an open economy with a fixed exchange rate is significantly below its purchasing power parity value.
If the economy decides to adopt a floating exchange rate, which of its macroeconomic policy aims is most likely to benefit?
Options
A low inflation
B low unemployment
C reduced deficit on the current account of the balance of payments
D steady economic growth
Reasoning
A currency that is significantly below its PPP value is undervalued in real terms. Under a fixed exchange rate, this undervaluation persists because the government or central bank pegs the nominal rate. If the economy adopts a floating exchange rate, the nominal rate will be free to adjust. Since the currency is undervalued, market forces (demand and supply for the currency) will cause it to appreciate towards its PPP equilibrium.
An appreciation of the currency makes imports cheaper and exports more expensive. This reduces the price of imported goods and raw materials, lowering the domestic price level and reducing cost-push inflationary pressure. Therefore, the objective most likely to benefit is low inflation.
Low unemployment (B) would be harmed by appreciation because exports become less competitive, potentially reducing output and employment. A reduced current account deficit (C) would also be harmed because a stronger currency worsens the trade balance (assuming the Marshall-Lerner condition holds). Steady economic growth (D) could be disrupted by the adjustment process and the loss of export competitiveness.
Answer
A
A
Background Concept
Purchasing Power Parity (PPP) is a theory that, in the long run, exchange rates should adjust so that a basket of goods costs the same in different countries when measured in a common currency. If a currency is below its PPP value, it means the nominal exchange rate is weaker than what the relative price levels would suggest — the currency is undervalued in real terms. This often happens under a fixed exchange rate system where the government maintains an artificially low nominal rate.
Fixed vs Floating Exchange Rates: Under a fixed system, the central bank intervenes to keep the nominal rate at a set level. Under a floating system, the rate is determined by market forces of demand and supply. If a currency is undervalued, under a float, market forces (e.g., foreign demand for exports, capital inflows seeking cheap assets) will push the nominal rate up (appreciation) towards the PPP equilibrium.
Effects of Appreciation: An appreciation makes imports cheaper (in domestic currency terms) and exports more expensive (in foreign currency terms). This has several macroeconomic effects: it reduces imported inflation, but it also reduces net exports (X-M), which can lower aggregate demand, output, and employment.
Understanding the Question
The question presents a scenario: an open economy with a fixed exchange rate has a currency significantly below its PPP value. The economy then switches to a floating exchange rate. The question asks which of four macroeconomic policy aims (low inflation, low unemployment, reduced current account deficit, steady economic growth) is most likely to benefit from this change.
The key is to trace the chain of causation: the switch to a float allows the currency to appreciate towards its PPP value. The appreciation then has differential effects on each objective. We need to identify which objective is helped (or least harmed) by this appreciation.
Approach
- Identify the initial condition: Currency is undervalued (below PPP).
- Predict the market outcome under a float: The currency will appreciate.
- Analyse the effects of appreciation on each objective:
- Low inflation (A): Appreciation reduces import prices -> lower cost-push inflation -> beneficial.
- Low unemployment (B): Appreciation makes exports less competitive -> lower export demand -> potential job losses in export/import-competing sectors -> harmful.
- Reduced current account deficit (C): Appreciation worsens the trade balance (exports fall, imports rise) -> deficit likely increases -> harmful.
- Steady economic growth (D): The adjustment process (appreciation) can be disruptive; loss of export competitiveness reduces AD, potentially slowing growth -> harmful.
- Conclude: Only low inflation is clearly helped. The others are harmed or at best not helped.
Step-by-Step Reasoning
-
The Initial Condition: The currency is 'significantly below its PPP value'. This means the nominal exchange rate is weaker than what the relative price levels would justify. For example, if the PPP rate is 1 USD = 1.20 of the local currency, but the fixed rate is 1 USD = 1.50 of the local currency, the local currency is undervalued by 25%.
-
The Switch to a Float: Under a floating exchange rate, the central bank stops intervening. The market now determines the rate. Because the currency is undervalued, it is 'cheap'. Foreigners will want to buy it to purchase domestic goods and assets, and domestic residents will have less incentive to sell it to buy expensive foreign goods. This excess demand for the domestic currency will cause it to appreciate.
-
Effect on Inflation (A): An appreciation means the domestic currency buys more foreign currency. Therefore, the domestic price of imported goods (e.g., oil, machinery, consumer electronics, raw materials) falls. This directly reduces the cost of production for firms (cost-push inflation falls) and reduces the price of final consumer goods. This is a clear, direct benefit to the goal of low inflation.
-
Effect on Unemployment (B): An appreciation makes a country's exports more expensive for foreigners and imports cheaper for domestic consumers. This reduces the demand for domestically produced goods and services. Export industries will see falling sales, and import-competing industries will face stiffer competition. This is likely to lead to a fall in output and a rise in unemployment, at least in the short to medium run. Therefore, this objective is harmed, not helped.
-
Effect on Current Account Deficit (C): A current account deficit means the value of imports exceeds the value of exports. An appreciation makes imports cheaper (so the volume of imports likely rises) and exports more expensive (so the volume of exports likely falls). Unless the Marshall-Lerner condition is spectacularly violated (which is rare, especially in the long run), the trade balance will worsen, meaning the deficit will increase. This objective is harmed.
-
Effect on Steady Economic Growth (D): The appreciation reduces net exports, a component of Aggregate Demand (AD = C+I+G+(X-M)). A fall in AD reduces the rate of economic growth. Furthermore, the adjustment process itself can be disruptive, creating uncertainty for businesses. This objective is harmed.
-
Conclusion: Only the objective of low inflation (A) is clearly and directly helped by the appreciation that follows the switch to a floating exchange rate. The other objectives are all negatively impacted.
Key Takeaways
- PPP as an anchor: PPP provides a long-run equilibrium value for the exchange rate. Deviations from PPP create pressures for adjustment.
- Exchange rate regime matters: The same underlying economic condition (an undervalued currency) has different implications depending on the exchange rate regime. A fixed rate can sustain the undervaluation; a floating rate will correct it.
- Trade-offs: An appreciation is a double-edged sword. It helps control inflation but harms export competitiveness, output, and employment. This is a classic macroeconomic policy conflict.
- Chain of reasoning: Always trace the full chain of causation from the policy change to the final impact on the objective. Don't just state the final effect; explain the mechanism.
Common Mistakes
- Confusing undervaluation with overvaluation: A currency below its PPP value is undervalued, not overvalued. An undervalued currency will appreciate, not depreciate, when the regime is freed.
- Ignoring the direction of change: Some students might think a 'weak' currency helps exports (which is true) and then conclude that switching to a float will make it even weaker. But the question states it is below PPP, so market forces will push it up.
- One-sided analysis: Only considering the benefit to inflation without considering the harm to other objectives. The question asks for the one that is most likely to benefit, which requires a comparative assessment.
- Forgetting the Marshall-Lerner condition: While not strictly necessary for this MCQ, a deeper understanding would note that for the current account to worsen, the Marshall-Lerner condition (sum of PED for exports and imports > 1) must hold, which it almost always does.
Things to Be Careful About
- Read the question carefully: Note the initial condition ('significantly below its PPP value') and the policy change ('adopt a floating exchange rate').
- Distinguish between nominal and real: The question is about the nominal exchange rate adjusting towards the PPP (real) value.
- Think about the mechanism: Don't just memorise that 'a strong currency is good for inflation'. Understand why: it reduces the domestic price of imports.
- Consider the time frame: The benefits to inflation are relatively quick (import prices fall immediately). The harms to unemployment and growth take longer to materialise but are still the dominant effect. The question asks for the objective 'most likely to benefit', and inflation is the only clear winner.
Which policy will help to correct a deficit on the current account of the balance of payments?
Options
A decreasing direct taxes
B decreasing government regulations
C increasing exchange rates
D increasing government spending
Reasoning
A current account deficit means the value of imports exceeds the value of exports. To correct it, a policy must either reduce imports, increase exports, or both.
- A Decreasing direct taxes raises disposable income, increasing consumption, including imports, worsening the deficit.
- B Decreasing government regulations reduces the cost of doing business, improving the competitiveness of domestic firms. This can increase exports and reduce imports, helping to correct the deficit.
- C Increasing the exchange rate makes exports more expensive and imports cheaper, worsening the deficit.
- D Increasing government spending raises aggregate demand, increasing imports, worsening the deficit.
Only option B is likely to improve the current account balance.
Answer
B
B
Background Concept
The current account of the balance of payments records the value of exports of goods and services minus the value of imports of goods and services, plus net income and transfers. A deficit means the country is spending more on foreign goods, services, and transfers than it is earning from abroad. Policies to correct a deficit aim to either reduce imports (expenditure-reducing or expenditure-switching) or boost exports (supply-side improvements).
Understanding the Question
The question asks which of four policies will help correct a current account deficit. Each option is a different type of policy: fiscal (A, D), regulatory (B), or exchange rate (C). The task is to evaluate each policy's likely effect on the trade balance.
Approach
For each option, trace the chain of reasoning from the policy change to its impact on exports and imports. The correct answer is the one that reduces imports or increases exports without a countervailing negative effect.
Step-by-Step Reasoning
-
Option A: Decreasing direct taxes. Lower income taxes leave households with more disposable income. Some of this extra income will be spent on imported goods and services (since the marginal propensity to import is positive). This increases import expenditure, widening the deficit. So A is incorrect.
-
Option B: Decreasing government regulations. This is a supply-side policy. Reducing red tape, licensing requirements, or compliance costs lowers the cost of production for domestic firms. Lower costs can improve the price competitiveness of domestic goods relative to foreign goods, boosting exports and encouraging consumers to buy domestic instead of imports. This helps correct the deficit. B is correct.
-
Option C: Increasing exchange rates. A higher exchange rate (appreciation) makes domestic exports more expensive in foreign currency and imports cheaper in domestic currency. This tends to reduce exports and increase imports, worsening the deficit. C is incorrect.
-
Option D: Increasing government spending. Higher government spending increases aggregate demand. Some of this additional spending will be on imported goods and services, increasing imports and worsening the deficit. D is incorrect.
Key Takeaways
- Policies that reduce the cost of domestic production (supply-side policies) can improve the current account by making exports more competitive.
- Policies that increase aggregate demand (expansionary fiscal or monetary policy) tend to worsen the current account by raising imports.
- Exchange rate appreciation worsens the current account; depreciation improves it (assuming Marshall-Lerner condition holds).
Common Mistakes
- Confusing the effect of exchange rate changes: a higher exchange rate makes exports more expensive, not cheaper.
- Assuming that any policy that reduces government spending or taxes will automatically help the deficit — the key is the effect on imports and exports, not the budget balance.
- Overlooking the import content of increased consumption or government spending.
Things to Be Careful About
- The question asks which policy "will help to correct" a deficit, not which policy is guaranteed to eliminate it. The correct answer is the one that moves the balance in the right direction.
- Distinguish between policies that affect the current account directly (exchange rate, tariffs) and those that affect it indirectly through aggregate demand or competitiveness.
The table shows possible changes in population, the rate of inflation and the number of years of education.
Which combination would lead to an increase in both real GDP per capita and the Human Development Index?
Options
| population | rate of inflation | number of years of education | |
|---|---|---|---|
| A | falls | falls | rises |
| B | falls | rises | rises |
| C | rises | falls | falls |
| D | rises | rises | rises |
Answer
Real GDP per capita = real GDP / population. A fall in population increases real GDP per capita if real GDP is unchanged. A fall in the rate of inflation means the price level rises more slowly, which for a given nominal GDP means real GDP is higher, so real GDP per capita also rises. The HDI includes an education component; an increase in the number of years of education raises the HDI. Therefore, combination A (population falls, inflation falls, education rises) leads to an increase in both real GDP per capita and the HDI.
A
A
Background Concept
Real GDP per capita is the total value of all final goods and services produced within a country, adjusted for inflation, divided by the population. It is a measure of average income or living standards. The Human Development Index (HDI) is a composite index of three dimensions: health (life expectancy), education (mean years of schooling and expected years of schooling), and income (GNI per capita, PPP). Improvements in any of these components raise the HDI.
Understanding the Question
The question presents a table with possible changes in population, rate of inflation, and number of years of education. It asks which combination would lead to an increase in both real GDP per capita and the HDI. This requires understanding how each factor affects the two indicators. Population directly affects the denominator of real GDP per capita. Inflation affects the price level, which is used to deflate nominal GDP to real GDP. Education is a direct component of the HDI.
Approach
We need to evaluate each option in turn. For real GDP per capita, we consider the net effect of changes in population and inflation. For HDI, we consider the effect of the change in education. The correct combination will have a positive effect on both.
Step-by-Step Reasoning
Let's analyse each option:
Option A: population falls, inflation falls, education rises
- Population falls: denominator of real GDP per capita decreases, so real GDP per capita increases (ceteris paribus).
- Inflation falls: the price level rises more slowly, so for a given nominal GDP, real GDP is higher (since real GDP = nominal GDP / price level). This also increases real GDP per capita.
- Education rises: HDI includes education as a component, so HDI increases.
Thus, both real GDP per capita and HDI increase.
Option B: population falls, inflation rises, education rises
- Population falls: positive effect on real GDP per capita.
- Inflation rises: price level rises faster, real GDP falls for given nominal GDP, so real GDP per capita falls.
The net effect on real GDP per capita is ambiguous; it could increase or decrease depending on the magnitudes. But we need a certain increase, so this is not guaranteed. - Education rises: positive for HDI.
Option C: population rises, inflation falls, education falls
- Population rises: negative effect on real GDP per capita.
- Inflation falls: positive effect on real GDP per capita.
Net effect uncertain. - Education falls: negative effect on HDI.
Option D: population rises, inflation rises, education rises
- Population rises: negative effect on real GDP per capita.
- Inflation rises: negative effect on real GDP per capita.
- Education rises: positive for HDI.
Real GDP per capita definitely falls (both factors negative), so fails.
Therefore, only option A guarantees an increase in both indicators.
Key Takeaways
- Real GDP per capita is affected by both real GDP and population. Changes in inflation affect real GDP via the price level.
- HDI components: health, education, income. Education is a direct component.
- When evaluating combinations, consider the direction of each effect and whether the net effect is certain.
Common Mistakes
- Forgetting that inflation affects real GDP because nominal GDP may not be constant. The question assumes nominal GDP is unchanged? Actually, the problem doesn't specify, but the reasoning implicitly assumes ceteris paribus. The mark scheme likely expects that inflation affects the price level and thus real GDP.
- Confusing nominal GDP with real GDP. Some students might think inflation does not affect real GDP per capita, but it does through the price level.
- Overlooking that education is a component of HDI.
- Thinking that a rise in population always reduces real GDP per capita, but it could increase if real GDP grows faster. But the question asks for a combination that leads to an increase, so we need to identify the one where both factors are favourable.
Things to Be Careful About
- The question uses 'rate of inflation' not 'price level'. A fall in the rate of inflation means the price level is still rising but at a slower rate, but for a given nominal GDP, real GDP will be higher than it would be with higher inflation. However, the exact magnitude depends on the time period. The question is simplified.
- The HDI education component includes both mean years and expected years; an increase in the number of years of education directly increases the education index.
- In real GDP per capita, 'real' means adjusted for inflation, so the price level matters. A fall in inflation means the price level is lower than it would have been, so real GDP is higher.
The following are four conditions sometimes attached to IMF loans to low-income countries.
Which condition would conflict with the ‘infant industry’ argument?
Options
A the need to allow free trade
B the need to control inflation
C the need to have a contractionary fiscal policy
D the need to privatise government enterprises
Reasoning
The infant industry argument holds that new industries in developing countries need temporary protection from foreign competition (through tariffs, quotas, etc.) until they achieve sufficient scale and efficiency to compete internationally. Free trade (option A) removes the ability to impose such protection, directly conflicting with the argument. The other conditions (controlling inflation, contractionary fiscal policy, privatisation) do not inherently prohibit protectionist policies.
Answer
A
A
Background Concept
The infant industry argument, primarily associated with Alexander Hamilton and Friedrich List, contends that newly established industries in developing countries are initially unable to compete with mature, efficient foreign producers. To allow these industries to grow, achieve economies of scale, and develop expertise, governments may provide temporary protection (e.g., tariffs, quotas, subsidies) until the industries become internationally competitive. This argument is a classic justification for protectionism, especially in development economics. IMF conditionality refers to policy reforms that a country must undertake to receive an IMF loan; these often include trade liberalisation, fiscal austerity, monetary tightening, and structural reforms like privatisation.
Understanding the Question
The question asks which of four IMF conditions would directly conflict with the infant industry argument. The key is recognising that the infant industry argument explicitly calls for protection from imports. Therefore, any condition that forces a country to open its markets to free trade would undermine the ability to protect infant industries. The other options—controlling inflation, contractionary fiscal policy, and privatisation—do not, by themselves, prevent a country from imposing trade barriers. The conflict is between trade liberalisation (free trade) and protectionism.
Approach
Recall the core of the infant industry argument: temporary protection is justified. Then evaluate each option:
- A: allow free trade – This removes protection, directly conflicting.
- B: control inflation – A macroeconomic objective not directly related to trade protection.
- C: contractionary fiscal policy – Reduces government spending or raises taxes; does not affect trade barriers.
- D: privatise government enterprises – Changes ownership structure; does not affect trade policy.
Thus, only option A conflicts.
Step-by-Step Reasoning
- Infant industry argument: New industries lack competitiveness, so they need a period of protection. Without protection, they would be wiped out by established foreign firms.
- IMF condition: Requiring free trade (A) means the country must lower tariffs and remove import restrictions. This prevents any protection for infant industries, directly contradicting the argument.
- Other conditions:
- Control inflation (B): This is about monetary policy (e.g., raising interest rates) to stabilise prices. It does not require lowering trade barriers, so a country could still protect infant industries.
- Contractionary fiscal policy (C): Cutting government spending or raising taxes may reduce demand, but it doesn't force the country to open markets. Protection can remain.
- Privatise government enterprises (D): Selling state-owned firms to private owners changes ownership but doesn't alter trade policy. Protection can still be implemented.
- Conclusion: Only free trade directly removes the ability to protect infant industries, so it conflicts with the infant industry argument.
Key Takeaways
- The infant industry argument is a rationale for temporary protectionism.
- IMF conditionality often includes free trade reforms, which can conflict with development strategies based on protection.
- Recognise that not all economic policies conflict; the question asks specifically for a condition that actively contradicts the argument.
Common Mistakes
- Confusing fiscal policy with trade policy: Some may think contractionary fiscal policy hurts investment and thus conflicts, but it does not prohibit protection.
- Assuming inflation control conflicts: Inflation control is a stability goal, not about trade protection.
- Overthinking privatisation: Privatisation is about ownership, not trade openness, so it does not conflict.
Things to Be Careful About
- The question is specific: “would conflict with the ‘infant industry’ argument?” This means the condition itself must be inconsistent with the argument, not just generally undesirable.
- Free trade is the clear conflict because the infant industry argument explicitly requires protection from free trade.
- Do not add assumptions not given; the condition is simply “allow free trade”, which is broad enough to cover removal of protection.
Countries X and Y form a customs union which leads to a removal of tariffs between the countries.
The diagram shows the effect on the market for wheat in country X.
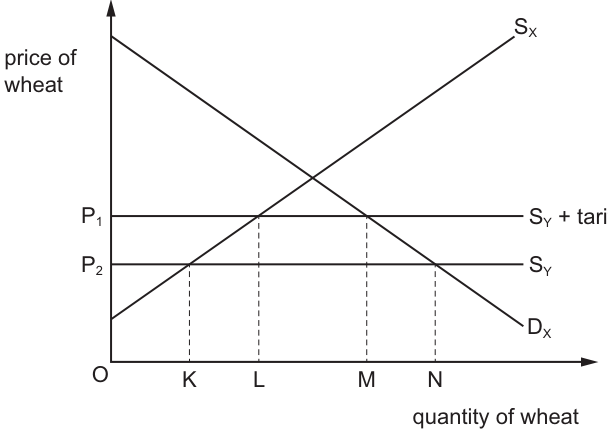
How much wheat is imported into country X from country Y before and after the customs union?
Options
| before customs union | after customs union | |
|---|---|---|
| A | KL | MN |
| B | KL | KN |
| C | LM | MN |
| D | LM | KN |
Working
Imports into country X equal domestic quantity demanded minus domestic quantity supplied at the prevailing price of wheat.
- Before the customs union, a tariff is imposed, so the price is P1. At P1, domestic supply is K and domestic demand is M. Imports = M - K = LM.
- After the customs union, tariffs are removed, so the price falls to P2. At P2, domestic supply is L and domestic demand is N. Imports = N - L = KN.
Answer
D
D
Background Concept
A customs union is a form of economic integration where member countries eliminate tariffs and other trade barriers on goods traded between them, and adopt a common external tariff for trade with non-member countries. Removing internal tariffs reduces the price of imported goods from member states, which affects trade volumes between the union members.
In a small open economy (a country too small to affect world prices), the domestic market for a good is analysed using domestic supply (Sx, showing the quantity domestic producers are willing to sell at each price) and domestic demand (Dx, showing the quantity domestic consumers are willing to buy at each price). The world price of the good is given, as the country is a price taker. Import volume is the gap between domestic demand and domestic supply at the prevailing price: if consumers want to buy more than domestic producers supply, the difference is imported from abroad.
When a tariff is imposed on imports, it raises the price of the imported good. This higher price reduces the quantity demanded by domestic consumers (movement up along the demand curve) and increases the quantity supplied by domestic producers (movement up along the supply curve), so the gap between demand and supply (imports) shrinks. Removing the tariff lowers the price, reversing these effects and increasing import volumes.
Understanding the Question
The question asks you to identify the volume of wheat imported into country X from country Y before and after X and Y form a customs union that removes tariffs between them. The provided diagram shows the wheat market in country X: Sx is domestic wheat supply, Dx is domestic wheat demand, SY + tariff is the world price of wheat from Y plus the pre-union tariff, and SY is the world price of wheat from Y after the tariff is removed. You need to calculate the import quantity at both price levels and select the matching option. This is a 1-mark multiple-choice question testing your ability to apply basic trade theory to a standard demand and supply diagram for imports.
Approach
To solve this, use the core rule for import volumes in a small open economy: Imports = Domestic Quantity Demanded - Domestic Quantity Supplied, at the prevailing price. Follow these steps:
- First calculate imports before the customs union, using the higher price P1 (world price plus tariff): find the domestic supply and demand quantities at P1, then subtract supply from demand.
- Next calculate imports after the customs union, using the lower price P2 (world price without tariff): find the domestic supply and demand quantities at P2, then subtract supply from demand.
- Match the two calculated import values to the options provided.
Step-by-Step Reasoning
- Pre-customs union (with tariff): Before the union, country X charges a tariff on wheat imports from Y, so the price of wheat in X is P1 (the higher horizontal line labelled SY + tariff).
- At P1, domestic wheat producers supply quantity OK (marked as K on the horizontal axis).
- At the same price, domestic wheat consumers demand quantity OM (marked as M on the horizontal axis).
- Since demand (M) is larger than domestic supply (K), the difference is imported. Import volume = OM - OK = LM (the horizontal distance between points K and M).
- Post-customs union (tariff removed): The customs union eliminates tariffs between X and Y, so the price of wheat falls to P2 (the lower horizontal line labelled SY, the world price with no tariff).
- At P2, domestic producers reduce output to quantity OL (marked as L on the horizontal axis), as the lower price makes domestic production less profitable.
- At the same lower price, domestic consumers increase their demand to quantity ON (marked as N on the horizontal axis), as wheat is now cheaper.
- Imports are again the gap between demand and supply: ON - OL = KN (the horizontal distance between points L and N).
- Matching these results to the options: before the customs union imports are LM, after they are KN, which corresponds to option D.
Key Takeaways
- A customs union increases trade between member countries by removing internal tariffs, which lowers the price of member-country goods and raises import volumes from those members (a process called trade creation).
- Import volume in a small open economy is always calculated as domestic demand minus domestic supply at the prevailing world price, not as the supply or demand quantity alone.
- Tariffs reduce import volumes by raising the price of imported goods, while tariff removal increases import volumes by lowering that price.
Common Mistakes
- Confusing supply/demand quantities with import volumes: Imports are the difference between domestic demand and supply, not the value of either on its own. For example, selecting K or M as the pre-union import quantity is incorrect, as these are domestic supply and demand, not the gap between them.
- Reversing before and after values: Mixing up which price (P1 or P2) applies to the pre-union and post-union scenarios. Remember the tariff raises the price, so the higher P1 is the pre-union price, and the lower P2 is post-union.
- Misreading the axis labels: Forgetting that the horizontal axis measures quantity, so the distance between two quantity points is the import volume, not a price value.
Things to Be Careful About
- Confirm which supply curve applies in each scenario: the higher SY + tariff line is only relevant before the customs union, while the lower SY line applies after.
- Always subtract domestic supply from domestic demand to calculate imports (since demand exceeds supply in this case, imports are positive; if supply exceeded demand, the country would be an exporter, not an importer).
- Check that the option matches the required order: the first column is imports before the customs union, the second is after, so do not swap the two values when selecting your answer.
Your score so far
Answer a question to start scoring
Your marks add up here as you work through the paper.