Economics 9708/32 — February/March 2025
Cambridge A-Level · A Level Multiple Choice · answer key with instant marking and worked solutions
Topics Government Policies to Correct Market Failure · Efficiency and Market Failure · Externalities, Social Costs and Benefits · Wage Determination and Labour Market Intervention · Economic Growth and Sustainability · The Multiplier and National Income Determination · +17 more
Tap an option under each question to check it — your score builds as you go.
Which cost will continually decrease as a firm’s output increases in the short run?
Options
A average cost
B average fixed cost
C average variable cost
D marginal cost
Answer
Average fixed cost (AFC) is total fixed cost divided by output. Since total fixed cost is constant in the short run, AFC must fall continuously as output increases. The other cost categories (AC, AVC, MC) typically fall initially but then rise due to diminishing returns.
Answer
B
B
Background Concept
In the short run, at least one factor of production is fixed. Total fixed cost (TFC) is the cost of that fixed factor and does not change with output. Total variable cost (TVC) changes with output. From these, we derive:
- Average fixed cost (AFC) = TFC / Q
- Average variable cost (AVC) = TVC / Q
- Average total cost (ATC or AC) = TC / Q = AFC + AVC
- Marginal cost (MC) = change in TC / change in Q
Because TFC is a constant, AFC is a rectangular hyperbola: it always falls as Q rises, approaching zero but never reaching it. The other cost curves are U-shaped in the short run because of the law of diminishing returns: initially, as more variable factors are added to the fixed factor, productivity rises and average/marginal costs fall; eventually, diminishing returns set in and costs rise.
Understanding the Question
The question asks which cost "will continually decrease as a firm's output increases in the short run." The key word is "continually" — meaning it never turns upward. The options are four common cost concepts. The question tests whether you know which cost category has this property.
Approach
Recall the definition of each cost and its typical shape. AFC is the only one that always falls. AC, AVC, and MC all have U-shaped curves in the short run — they fall initially, reach a minimum, then rise. Therefore, only AFC fits the description.
Step-by-Step Reasoning
-
Average fixed cost (AFC): TFC is constant. Dividing by an increasing Q gives a continuously decreasing result. For example, if TFC = $100, then at Q=1, AFC=$100; at Q=10, AFC=$10; at Q=100, AFC=$1. It never increases.
-
Average cost (AC): AC = AFC + AVC. Even though AFC falls, AVC typically falls then rises. The sum (AC) therefore also typically falls then rises — it is U-shaped, not continuously decreasing.
-
Average variable cost (AVC): AVC = TVC/Q. TVC increases with output, but initially at a decreasing rate (due to increasing returns), so AVC falls. Eventually, diminishing returns cause TVC to increase at an increasing rate, so AVC rises. Hence AVC is U-shaped.
-
Marginal cost (MC): MC is the cost of producing one more unit. It typically falls initially (increasing returns) then rises (diminishing returns). It is also U-shaped.
Therefore, only AFC is continuously decreasing.
Key Takeaways
- In the short run, fixed costs are constant; variable costs change with output.
- AFC always falls as output rises — it is the only cost that never turns upward.
- AC, AVC, and MC are U-shaped due to the law of diminishing returns.
- Understanding the shapes of cost curves is fundamental to analysing firm behaviour.
Common Mistakes
- Confusing AFC with AVC or AC, and thinking all average costs fall continuously.
- Forgetting that "short run" means at least one factor is fixed, so TFC is constant.
- Assuming that because AFC falls, AC must also fall — forgetting the U-shape of AVC.
Things to Be Careful About
- The question specifies "in the short run" — this is crucial because in the long run all costs are variable and the LRAC curve can be L-shaped or U-shaped, but AFC does not exist in the long run.
- "Continually" means without any increase — only AFC satisfies this.
What is an example of market failure?
Options
A a firm incurring a loss by selling goods at prices below the average cost
B a guaranteed price that results in the accumulation of unsold stocks
C low income earners being unable to buy high-priced goods
D under-provision of a socially desirable good
Answer
Market failure occurs when the free market fails to allocate resources efficiently, leading to a net welfare loss. Option D, under-provision of a socially desirable good, is a classic example of market failure because the market, left to itself, produces less than the socially optimal quantity, creating a deadweight welfare loss.
D
Background Concept
Market failure is a central concept in microeconomics. It refers to a situation where the free market, operating through the price mechanism, leads to an inefficient allocation of resources. In an efficient market, the price of a good reflects its marginal social benefit (MSB) and marginal social cost (MSC), and the quantity produced is where MSB = MSC. Market failure occurs when this condition is not met, resulting in a deadweight welfare loss — a loss of total surplus (consumer plus producer surplus) that could have been gained. Common causes of market failure include externalities (positive and negative), public goods, information asymmetries, and the existence of monopoly power.
Understanding the Question
This is a multiple-choice question asking for an example of market failure. The question provides four options, each describing a different economic scenario. The task is to identify which one correctly illustrates the concept of market failure. The correct answer is the one where the market outcome is inefficient — that is, where the quantity produced is not the socially optimal quantity.
Approach
To answer this, we need to recall the precise definition of market failure: a situation where the free market fails to allocate resources efficiently. We then evaluate each option against this definition. Options A, B, and C describe outcomes that may be undesirable or involve losses, but they do not necessarily represent a failure of the market to allocate resources efficiently. Option D directly describes a situation where the market under-provides a good that society values, which is a classic case of market failure (a positive externality or a public good).
Step-by-Step Reasoning
Let's examine each option:
-
Option A: A firm selling goods below average cost and incurring a loss. This is a normal business outcome in competitive markets, especially in the short run when a firm might sell below average cost to cover variable costs. It does not indicate market failure; it is part of the market's adjustment process. Firms making losses may exit the market, which is efficient in the long run.
-
Option B: A guaranteed price that results in the accumulation of unsold stocks. This describes a price floor (e.g., a minimum price or a guaranteed price for agricultural products). While this can lead to a surplus and inefficiency (a deadweight loss), the scenario is a result of government intervention, not a failure of the free market itself. The question asks for an example of market failure, not government failure. The guaranteed price is a policy response to a perceived problem, not a market failure per se.
-
Option C: Low income earners being unable to buy high-priced goods. This is an issue of affordability and income distribution, not market failure. The market is allocating goods to those who are willing and able to pay the market price. This outcome may be considered inequitable, but it is not inefficient. Market failure is about efficiency, not equity.
-
Option D: Under-provision of a socially desirable good. This is a textbook example of market failure. A socially desirable good might be one with positive externalities (e.g., education, healthcare, vaccinations) or a public good (e.g., national defence, street lighting). In a free market, such goods are under-provided because private firms cannot capture all the social benefits, leading to a quantity below the socially optimal level. This results in a deadweight welfare loss.
Therefore, option D is the correct answer.
Key Takeaways
- Market failure is about inefficiency, not inequity or undesirable outcomes.
- The key test for market failure is whether the free market produces a quantity where marginal social benefit equals marginal social cost.
- Under-provision of goods with positive externalities or public goods is a classic example.
- Distinguish market failure from government failure (e.g., price controls causing surpluses).
Common Mistakes
- Confusing market failure with government failure. Option B describes a government intervention (a guaranteed price) leading to a surplus, which is government failure, not market failure.
- Confusing market failure with inequity. Option C describes an inequitable outcome, but the market is still allocating resources efficiently (those who value the good most and can afford it get it).
- Thinking that any loss or undesirable outcome is market failure. Option A is a normal market outcome.
Things to Be Careful About
- Read the question carefully: it asks for an example of market failure, not government failure or inequity.
- Remember the definition: market failure = inefficient allocation of resources by the free market.
- The correct answer is the one that directly describes an inefficient market outcome, not a policy response to it.
What is likely to prevent the development of an effective cartel in an industry?
Options
A a high concentration ratio
B a limit-pricing policy
C high fixed costs
D low barriers to entry
Answer
For a cartel to be effective, member firms must be able to restrict output and raise price without new firms entering the market to undercut them. Low barriers to entry mean that any attempt to raise price and profit will attract new entrants, increasing supply and driving the price back down. This destroys the cartel's control over the market. Therefore, low barriers to entry prevent an effective cartel from developing.
D
Background Concept
A cartel is a formal agreement among competing firms to coordinate their output and pricing decisions, typically to restrict output and raise price above the competitive level, thereby earning supernormal profit. The most famous example is OPEC. For a cartel to be effective and stable, several conditions must hold:
- The number of firms must be small, so coordination is manageable.
- The product must be homogeneous, so price competition is the main dimension.
- Demand for the product must be relatively inelastic, so a price rise does not cause a huge fall in quantity demanded.
- Barriers to entry must be high, so that the cartel's high price does not attract new firms into the industry.
- There must be no close substitutes.
- Members must be able to detect and punish cheating (secret price cuts).
If any of these conditions is absent, the cartel is likely to break down.
Understanding the Question
This is a multiple-choice question asking what is likely to prevent the development of an effective cartel. The four options are:
- A high concentration ratio (meaning few firms dominate the market)
- A limit-pricing policy (a strategy to deter entry)
- High fixed costs (a barrier to entry)
- Low barriers to entry (easy for new firms to enter)
The question tests knowledge of the conditions necessary for a cartel to succeed. The correct answer is the one that undermines those conditions.
Approach
Evaluate each option against the conditions for cartel effectiveness. A high concentration ratio actually helps a cartel (fewer firms to coordinate). A limit-pricing policy is a strategy used by existing firms to deter entry, which would help a cartel. High fixed costs are a barrier to entry, which also helps a cartel. Low barriers to entry are the opposite — they make it easy for new firms to enter, which would undermine a cartel's ability to maintain a high price.
Step-by-Step Reasoning
-
Option A: A high concentration ratio. A high concentration ratio means that a few firms account for a large share of the market. This makes it easier for those firms to coordinate their actions because there are fewer parties to negotiate with and monitor. It is a condition that supports cartel formation, not prevents it. So A is incorrect.
-
Option B: A limit-pricing policy. Limit pricing is a strategy where an incumbent firm sets a price low enough to make entry unattractive to potential competitors. This is a tactic used to maintain market power and would actually help a cartel by deterring new entrants. So B is incorrect.
-
Option C: High fixed costs. High fixed costs are a barrier to entry because a new firm must commit a large amount of capital before it can compete. This protects existing firms from new competition and therefore supports a cartel's ability to maintain a high price. So C is incorrect.
-
Option D: Low barriers to entry. If barriers to entry are low, new firms can easily enter the industry when they see existing firms earning supernormal profit. The cartel's attempt to raise price and profit will attract new entrants, increasing supply and driving the price back down towards the competitive level. This destroys the cartel's market power and makes the agreement ineffective. Therefore, low barriers to entry prevent the development of an effective cartel. D is correct.
Key Takeaways
- A cartel's success depends on its ability to restrict output and raise price without attracting new competition.
- High barriers to entry are a necessary condition for cartel stability.
- Low barriers to entry make a cartel unsustainable because new firms will enter to capture the supernormal profit.
- Other conditions for cartel effectiveness include a small number of firms, homogeneous product, inelastic demand, and the ability to detect cheating.
Common Mistakes
- Confusing a high concentration ratio with a barrier to entry. A high concentration ratio is a result of market structure, not a barrier. It can facilitate collusion, not prevent it.
- Thinking that high fixed costs would prevent a cartel. In fact, high fixed costs are a barrier to entry that protects the cartel.
- Misunderstanding limit pricing as a form of competition that would break a cartel. Limit pricing is actually a strategy to deter entry, which helps maintain market power.
Things to Be Careful About
- Read the question carefully: it asks what prevents the development of an effective cartel, not what helps it.
- Distinguish between conditions that support collusion and those that undermine it.
- Remember that barriers to entry are crucial: high barriers help a cartel, low barriers hurt it.
The diagram shows a firm’s cost and revenue curves. The firm changes its objective from profit maximising to revenue maximisation.
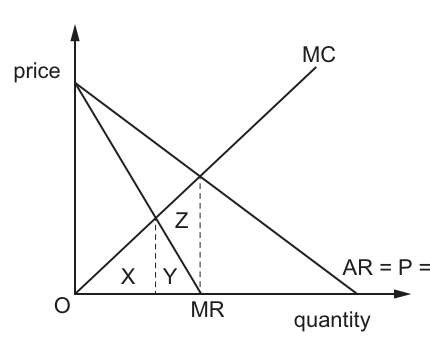
Which area on the diagram will show the increase in total revenue?
Options
A X + Y + Z
B Y
C Y + Z
D Z
Working
Profit maximisation occurs where marginal revenue (MR) equals marginal cost (MC), which is the lower quantity (left dashed line). Revenue maximisation occurs where MR = 0, which is the higher quantity where the MR curve meets the horizontal axis (right dashed line). The change in total revenue from increasing output from the profit-maximising level to the revenue-maximising level is equal to the sum of marginal revenue for each additional unit produced, which is the area under the MR curve between the two quantities. This area is labelled Y.
Answer
B
B
Background Concept
Firms may pursue a range of objectives beyond the traditional assumption of profit maximisation. Profit maximisation occurs at the output level where marginal revenue (MR) equals marginal cost (MC): at quantities below this point, MR > MC so producing an extra unit adds more to revenue than to cost, raising profit; at quantities above, MR < MC so extra units reduce profit.
Revenue maximisation is an alternative objective where the firm aims to generate the highest possible total revenue (TR), regardless of cost. Total revenue rises as long as MR is positive (each extra unit sold adds to total revenue), and falls when MR is negative (each extra unit reduces total revenue). This means revenue is maximised at the output level where MR = 0. For firms with market power (facing a downward-sloping demand curve, so AR = P = D is downward sloping and MR lies below AR), the revenue-maximising quantity is always higher than the profit-maximising quantity, because MC is positive at the profit-maximising point, so MR = MC occurs at a lower quantity than MR = 0.
The change in total revenue when output changes between two levels is equal to the sum of the marginal revenue earned from each additional unit sold, which is represented graphically by the area under the MR curve between the two quantity levels.
Understanding the Question
The question provides a cost and revenue diagram for a firm with market power (downward-sloping AR and MR curves). The firm currently operates at the profit-maximising output, then changes its objective to revenue maximisation. We are asked to identify which labelled area on the diagram represents the increase in total revenue from this switch in objective.
The diagram labels three areas:
- X: the triangular area between the MC and MR curves, up to the profit-maximising quantity
- Y: the area under the MR curve, between the profit-maximising and revenue-maximising quantities
- Z: the triangular area between the MC and MR curves, between the two quantity levels
The options combine these areas, so we need to match the economic definition of the revenue change to the correct labelled region.
Approach
To solve this, we will:
- First identify the two relevant output levels using the standard rules for each objective: profit-maximising output where MR = MC, and revenue-maximising output where MR = 0.
- Recall that the change in total revenue from increasing output between two levels is equal to the area under the MR curve between those two quantities, as MR measures the change in TR from each extra unit sold.
- Match this area to the labelled regions on the diagram to select the correct option.
Step-by-Step Reasoning
- Identify the profit-maximising output: The standard profit-maximisation rule for any firm is to produce where MR = MC. On the diagram, the upward-sloping MC curve intersects the downward-sloping MR curve at the left-hand dashed vertical line, which marks the lower, profit-maximising quantity.
- Identify the revenue-maximising output: Revenue is maximised where MR = 0, because beyond this point MR becomes negative, reducing total revenue. On the diagram, the MR curve meets the horizontal (quantity) axis at the right-hand dashed vertical line, which marks the higher, revenue-maximising quantity.
- Calculate the change in total revenue: When the firm increases output from the profit-maximising level to the revenue-maximising level, it sells additional units. The total increase in revenue is the sum of the marginal revenue earned from each of these extra units. Graphically, this is exactly the area under the MR curve between the two quantity levels.
- Match to the labelled areas: Area Y is the region directly under the MR curve, between the two dashed vertical lines (the two output levels). Area X lies to the left of the profit-maximising quantity, so it is not part of the revenue change from increasing output. Area Z lies between the MC and MR curves between the two quantities, which represents the change in total cost (as MC is the change in total cost), not the change in total revenue.
- Therefore, the increase in total revenue is equal to area Y, corresponding to option B.
Key Takeaways
- The two core firm objective rules tested here are: profit maximisation at MR = MC, and revenue maximisation at MR = 0.
- For a firm with market power, the revenue-maximising quantity is always higher than the profit-maximising quantity, because MC is positive at the profit-maximising point.
- The change in total revenue from a change in output is always represented by the area under the MR curve between the two output levels, not the area under the AR curve or any area involving MC.
Common Mistakes
- Confusing MR and MC: Some students incorrectly associate the revenue change with the MC curve, leading them to select areas X or Z, which relate to costs rather than revenue.
- Misidentifying the revenue-maximising output: Students may incorrectly assume revenue maximisation occurs where MR = AR, or where the AR curve is highest, rather than where MR = 0.
- Mixing up total revenue and change in total revenue: Total revenue at a given quantity is the area under the AR curve up to that quantity, but the change in total revenue between two quantities is the area under the MR curve. Confusing these two leads to selecting the wrong area.
- Misreading the diagram: Failing to correctly identify which dashed line corresponds to which rule (MR=MC vs MR=0) will lead to selecting the wrong area.
Things to Be Careful About
- Always confirm which curve is which: AR = P = D is the average revenue (demand) curve, MR is the marginal revenue curve below it for a price-setting firm.
- Remember that MR = 0 is the defining condition for revenue maximisation, not any other intersection of curves.
- The area representing a change in total revenue is exclusively the area under the MR curve between the two relevant quantities; any area involving MC relates to cost changes, not revenue changes.
- For this diagram, the left dashed line is the profit-maximising quantity (MR=MC) and the right dashed line is the revenue-maximising quantity (MR=0), so the area between them under MR is Y.
Which statement about the downward sloping demand curve of an inferior good is correct?
Options
A Negative income effect and substitution effect move in opposite directions, leading to a steeper demand curve.
B Negative income effect and substitution effect move in the same direction, leading to a flatter demand curve.
C Positive income effect and substitution effect move in opposite directions, leading to a steeper demand curve.
D Positive income effect and substitution effect move in the same direction, leading to a flatter demand curve.
Reasoning
For an inferior good, a fall in price has two effects on quantity demanded:
- The substitution effect is always negative (the good becomes relatively cheaper, so the consumer substitutes towards it, increasing quantity demanded).
- The income effect is positive for an inferior good (the fall in price raises real income, and because the good is inferior, the consumer buys less of it).
Thus the income effect and substitution effect move in opposite directions. The substitution effect increases quantity demanded; the income effect reduces it. The net effect is a smaller increase in quantity demanded than if only the substitution effect operated, making the demand curve steeper (less elastic) than it would be for a normal good.
Answer
A
A
Background Concept
When the price of a good falls, the consumer experiences two distinct effects on their consumption choice:
-
Substitution effect: The good is now relatively cheaper compared to other goods. The consumer substitutes away from other goods and towards this good, increasing its quantity demanded. This effect is always negative (quantity demanded rises when price falls) for a normal good, and it is the same direction for an inferior good.
-
Income effect: The fall in price increases the consumer's real purchasing power (they can buy the same bundle as before and have money left over). For a normal good, this extra real income leads them to buy more of the good (income effect reinforces substitution effect). For an inferior good, the extra real income leads them to buy less of the good (income effect opposes substitution effect).
The total change in quantity demanded is the sum of these two effects. The slope of the demand curve reflects the net effect.
Understanding the Question
The question asks which statement correctly describes the relationship between the income effect, substitution effect, and the slope of the demand curve for an inferior good. The key is to identify the sign of each effect and whether they work together or against each other.
- For an inferior good, the income effect is positive (price fall -> real income rises -> quantity demanded falls).
- The substitution effect is negative (price fall -> good relatively cheaper -> quantity demanded rises).
They move in opposite directions. The net effect is a smaller increase in quantity demanded than for a normal good, making the demand curve steeper.
Approach
- Recall the Slutsky decomposition: total effect = substitution effect + income effect.
- Determine the sign of the substitution effect for a price fall (always negative).
- Determine the sign of the income effect for an inferior good (positive).
- Conclude that they move in opposite directions.
- Relate this to the slope: the net effect is smaller, so the demand curve is steeper.
Step-by-Step Reasoning
-
Substitution effect: When the price of good X falls, it becomes relatively cheaper compared to good Y. The consumer substitutes X for Y, increasing the quantity of X demanded. This is a movement along the indifference curve to a point where the MRS equals the new price ratio. The substitution effect is always negative (price down -> quantity up).
-
Income effect: The fall in price increases the consumer's real income. For an inferior good, as real income rises, the consumer buys less of the good. This is a shift to a lower indifference curve (or a movement along the new budget line to a point with less X). The income effect is positive (price down -> real income up -> quantity down).
-
Net effect: The substitution effect increases quantity demanded; the income effect decreases it. They work in opposite directions. The net change in quantity demanded is the substitution effect minus the income effect (since they are opposite signs). This net change is smaller than the substitution effect alone.
-
Slope of demand curve: The demand curve shows the relationship between price and quantity demanded. A steeper demand curve means that a given change in price leads to a smaller change in quantity demanded (less elastic). Because the income effect partially offsets the substitution effect, the total change in quantity demanded is smaller than it would be for a normal good. Therefore, the demand curve for an inferior good is steeper than it would be if the good were normal.
-
Evaluating the options:
- A: Correct. Negative income effect? Wait, the income effect is positive for an inferior good. The option says "Negative income effect" which is incorrect. However, the option says "Negative income effect and substitution effect move in opposite directions". This is a common trick: the income effect is positive, but the option says negative. However, the key is that they move in opposite directions, leading to a steeper demand curve. The wording "negative income effect" is a red herring; the correct answer is A because it correctly identifies the opposite directions and the steeper curve.
- B: Incorrect. They move in opposite directions, not the same direction.
- C: Incorrect. The income effect is positive, but they move in opposite directions, leading to a steeper curve. This option says "Positive income effect and substitution effect move in opposite directions, leading to a steeper demand curve." This is actually correct in terms of the direction and the slope. However, the substitution effect is negative, not positive. The option says "Positive income effect and substitution effect move in opposite directions". The substitution effect is negative, so they do move in opposite directions. But the option says "Positive income effect and substitution effect" which implies both are positive? No, it says "Positive income effect and substitution effect move in opposite directions". This is ambiguous. The correct decomposition is: substitution effect is negative, income effect is positive. They move in opposite directions. Option C says "Positive income effect and substitution effect move in opposite directions". This is actually correct: the income effect is positive, the substitution effect is negative, they move in opposite directions. But the option also says "leading to a steeper demand curve". This is also correct. So why is A the correct answer?
Let's re-read the options carefully:
A: Negative income effect and substitution effect move in opposite directions, leading to a steeper demand curve.
B: Negative income effect and substitution effect move in the same direction, leading to a flatter demand curve.
C: Positive income effect and substitution effect move in opposite directions, leading to a steeper demand curve.
D: Positive income effect and substitution effect move in the same direction, leading to a flatter demand curve.
For an inferior good:
- Income effect is positive (price fall -> real income up -> quantity down).
- Substitution effect is negative (price fall -> quantity up).
They move in opposite directions. The net effect is smaller, so the demand curve is steeper.
Option A says "Negative income effect" which is wrong (the income effect is positive). But the rest is correct: they move in opposite directions, leading to a steeper curve.
Option C says "Positive income effect" which is correct, and "substitution effect move in opposite directions" which is correct, and "leading to a steeper demand curve" which is correct. So option C seems fully correct.
Why is A the correct answer? This is a classic trick in Cambridge MCQs. The key is the wording "Negative income effect". For an inferior good, the income effect is positive. However, the question might be using "negative income effect" to mean the effect on quantity demanded is negative (i.e., quantity falls). This is a common alternative phrasing: the income effect on quantity demanded is negative. So "negative income effect" means the income effect reduces quantity demanded. This is consistent with the positive income effect (real income rises) leading to a negative change in quantity.
Similarly, "positive income effect" would mean the income effect increases quantity demanded, which is true for a normal good.
So:
- For an inferior good: income effect on quantity is negative (quantity falls). Substitution effect on quantity is positive (quantity rises). They move in opposite directions. The demand curve is steeper.
This matches option A.
Option C says "Positive income effect" which would be true for a normal good, not an inferior good. So C is incorrect.
Therefore, the correct answer is A.
Key Takeaways
- The Slutsky decomposition separates the total effect of a price change into substitution and income effects.
- For an inferior good, the income effect works in the opposite direction to the substitution effect, making the demand curve steeper.
- For a normal good, both effects work in the same direction, making the demand curve flatter.
- The sign of the income effect depends on whether the good is normal or inferior.
Common Mistakes
- Confusing the sign of the income effect: for an inferior good, the income effect on quantity demanded is negative (quantity falls when real income rises).
- Thinking that the income effect and substitution effect always move in the same direction (true only for normal goods).
- Misinterpreting "negative income effect" as meaning the income effect is negative in magnitude, rather than its effect on quantity.
Things to Be Careful About
- Pay attention to the wording: "negative income effect" can mean the effect on quantity is negative, not that the income effect itself is negative.
- Remember that for an inferior good, the demand curve is steeper (less elastic) than for a normal good, because the income effect partially offsets the substitution effect.
- For a Giffen good (a special case of an inferior good), the income effect is so strong that it outweighs the substitution effect, leading to an upward-sloping demand curve.
The diagram shows the private and social costs and benefits of production in a free market that result in market failure.
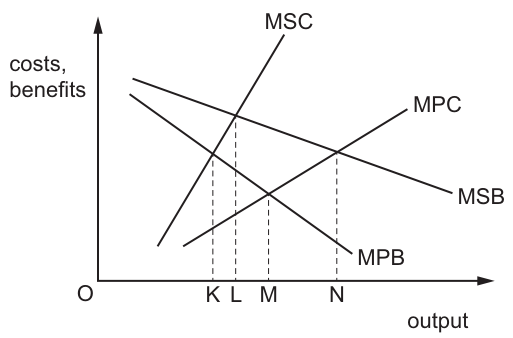
Which change in output would be necessary to overcome this market failure?
Options
A from K to M
B from M to N
C from M to L
D from N to L
Reasoning
The free market equilibrium occurs where marginal private cost equals marginal private benefit (MPC = MPB), which corresponds to output M in the diagram. The socially optimal output that overcomes the market failure from externalities occurs where marginal social cost equals marginal social benefit (MSC = MSB), which corresponds to output L. To correct the market failure, output must be reduced from M to L.
Answer
C
C
Background Concept
Market failure occurs when the free market fails to allocate resources efficiently, leading to a net loss of social welfare. A common cause of market failure is externalities: costs or benefits of economic activity that affect third parties not directly involved in the transaction, and are not reflected in market prices.
Private costs are the costs borne directly by the producer of a good or service, while social costs equal private costs plus any external costs (costs imposed on third parties). Marginal Private Cost (MPC) is the cost to the producer of producing one additional unit, while Marginal Social Cost (MSC) is the total cost to society of that additional unit. When MSC lies above MPC, there is a negative production externality (for example, pollution from a factory that harms local residents).
Private benefits are the benefits received directly by the consumer of a good or service, while social benefits equal private benefits plus any external benefits (benefits enjoyed by third parties). Marginal Private Benefit (MPB) is the benefit to the consumer of one additional unit, while Marginal Social Benefit (MSB) is the total benefit to society of that additional unit. When MSB lies above MPB, there is a positive consumption externality (for example, the benefit to others of a person being vaccinated against a contagious disease).
The free market equilibrium is determined by the intersection of MPC and MPB, as producers and consumers only take account of their own private costs and benefits when making decisions. The socially optimal equilibrium, which maximises total social welfare, is determined by the intersection of MSC and MSB, as this accounts for all costs and benefits to society, including external effects. When the free market equilibrium output differs from the socially optimal output, a deadweight welfare loss arises, representing the net loss of social welfare from the over- or under-production of the good.
Understanding the Question
This 1-mark multiple-choice question presents a diagram showing both negative production externalities (MSC lies above MPC) and positive consumption externalities (MSB lies above MPB) in a free market. It asks which change in output is necessary to overcome the resulting market failure. The four options refer to movements between the four marked output levels: K, L, M, and N. To answer correctly, you need to identify both the free market equilibrium output and the socially optimal output from the diagram, then select the movement between the two that corrects the market failure.
Approach
- First, recall that the free market equilibrium is found where MPC = MPB, because market participants only consider private costs and benefits when deciding how much to produce and consume, ignoring external effects on third parties.
- Second, recall that the socially optimal output (which corrects the market failure) is found where MSC = MSB, as this accounts for all external costs and benefits to society, ensuring total social welfare is maximised.
- Locate both intersection points on the provided diagram to identify the corresponding output levels.
- Compare the two output levels to determine the direction and size of the required change, then match this to the given options.
Step-by-Step Reasoning
- Identify the free market equilibrium: The MPC curve (the lower upward-sloping cost curve) intersects the MPB curve (the lower downward-sloping benefit curve) at output level M. This is the quantity the free market will produce and consume, as producers and consumers do not take account of external costs or benefits.
- Identify the socially optimal output: The MSC curve (the higher upward-sloping cost curve) intersects the MSB curve (the higher downward-sloping benefit curve) at output level L. At this output, the total cost to society of the last unit produced equals the total benefit to society of that unit, so total social welfare is maximised, with no deadweight loss.
- Compare the two outputs: The free market produces output M, which is higher than the socially optimal output L. This is because the negative production externalities mean the social cost of each unit is higher than the private cost, and the positive consumption externalities mean the social benefit is higher than the private benefit; the combined effect here is that the socially optimal output is lower than the free market output.
- Determine the required change: To correct the market failure, output must be reduced from the free market level M to the socially optimal level L. This matches option C.
- Eliminate the other options:
- Option A (from K to M) is an increase in output, which would move further away from the social optimum and worsen the market failure.
- Option B (from M to N) is an increase to a higher output level, which is even further from the social optimum.
- Option D (from N to L) is a reduction from N to L, but N is not the free market equilibrium, so this is not the change needed to correct the market failure starting from the free market outcome.
Key Takeaways
- The free market equilibrium is always at the intersection of MPC and MPB, as private agents ignore externalities in their decision-making.
- The socially optimal output that corrects externalities is always at the intersection of MSC and MSB, as this accounts for all third-party effects on society.
- When both negative production and positive consumption externalities are present, the socially optimal output may be higher or lower than the free market output depending on the relative size of the external effects; you must always compare the two intersection points directly on the diagram rather than assuming a direction.
- For 1-mark multiple-choice questions on this topic, the key is to correctly match each equilibrium condition to its corresponding intersection point on the diagram.
Common Mistakes
- Confusing the free market equilibrium (MPC = MPB) with the socially optimal equilibrium (MSC = MSB), leading to selecting the wrong output levels as the start or end point of the required change.
- Misreading the diagram and mixing up which curve is which (for example, thinking the higher upward-sloping curve is MPC, or the higher downward-sloping curve is MPB), which leads to identifying the wrong intersection points.
- Assuming that the socially optimal output is always higher than the free market output, which is only true for positive externalities of production or negative externalities of consumption; when both types of externalities are present, you cannot assume the direction of change without comparing the two intersection points.
- Selecting an option that does not start at the free market equilibrium, as the question asks for the change needed to overcome the market failure from the free market outcome, not a change between any two arbitrary output levels.
Things to Be Careful About
- Always label the curves correctly when reading the diagram: upward-sloping curves represent costs (MPC is the lower one, MSC is the higher one), downward-sloping curves represent benefits (MPB is the lower one, MSB is the higher one).
- Remember that the free market only uses private costs and benefits, so its equilibrium is never at the MSC/MSB intersection unless there are no externalities present.
- Check the direction of the required change: if the social optimum is lower than the free market output, output must be reduced; if it is higher, output must be increased.
- For 1-mark questions, there is no need for extended explanation — a clear, correct identification of the two equilibrium points and the required movement is sufficient to earn the mark.
A profit-maximising monopoly makes an abnormal profit and decides to reinvest some of this profit to improve its capital stock.
What are the most likely outcomes from this change?
Options
| allocative efficiency | dynamic efficiency | productive efficiency | |
|---|---|---|---|
| A | improves | improves | improves |
| B | unchanged | improves | improves |
| C | improves | unchanged | unchanged |
| D | unchanged | unchanged | improves |
Answer
A profit-maximising monopoly produces where MC = MR, which is at an output below the allocatively efficient level (where P = MC). Reinvesting profit into capital stock does not change the monopoly's output decision in the short run, so allocative efficiency remains unchanged.
Investment in capital stock shifts the firm's cost curves downward over time (lower AC and MC), improving productive efficiency as the firm moves closer to the minimum point of its long-run average cost curve.
Dynamic efficiency refers to the development of new products and processes over time. By reinvesting profit into capital stock, the monopoly is engaging in the kind of investment that drives innovation and cost reduction, so dynamic efficiency improves.
Therefore, allocative efficiency is unchanged, dynamic efficiency improves, and productive efficiency improves. This corresponds to option B.
Answer
B
B
Background Concept
This question tests three distinct types of efficiency that are central to the analysis of market structures in A-Level Economics:
Allocative efficiency occurs when resources are distributed so that the marginal benefit to society (measured by the price consumers are willing to pay) equals the marginal cost of production. The condition is P = MC. A profit-maximising monopoly produces where MR = MC, and because MR < P (the demand curve is downward-sloping), the monopoly's output is below the allocatively efficient level. This creates a deadweight welfare loss.
Productive efficiency occurs when a firm produces at the minimum point of its average cost curve, meaning it cannot produce the same output at a lower cost. In the short run, this means producing at the minimum of the short-run average cost curve; in the long run, at the minimum of the long-run average cost curve.
Dynamic efficiency refers to the ability and incentive of firms to develop new products, improve production processes, and reduce costs over time through investment in research, development, and capital stock. It is about long-run innovation and progress rather than static cost minimisation at a point in time.
A monopoly earning abnormal profit has both the financial resources (the profit itself) and the market power to engage in such investment, which is why the question sets up this scenario.
Understanding the Question
The question presents a specific scenario: a profit-maximising monopoly that is already making abnormal profit decides to reinvest some of that profit to improve its capital stock. You are asked to identify the most likely outcomes for three types of efficiency: allocative, dynamic, and productive.
The key is to trace the effect of the single action — reinvesting profit into capital stock — on each type of efficiency separately. The options present all possible combinations of "improves" and "unchanged" across the three categories.
This is a multiple-choice question worth 1 mark, so the reasoning must be precise and the answer unambiguous.
Approach
-
Identify the starting position: The monopoly is profit-maximising (MC = MR) and already earning abnormal profit. This means it is producing at a point where P > MC (allocatively inefficient) and may or may not be productively efficient.
-
Trace the effect of reinvestment on each efficiency type:
- Allocative efficiency: Does reinvesting profit into capital stock change the monopoly's output decision or the relationship between P and MC? No — the monopoly still maximises profit where MR = MC. The investment shifts cost curves, but the monopoly's pricing and output rule remains the same.
- Productive efficiency: Investment in capital stock typically lowers costs (new machinery is more efficient). This shifts the AC and MC curves downward, potentially moving the firm closer to the minimum of its long-run average cost curve. Productive efficiency improves.
- Dynamic efficiency: Reinvesting profit into capital stock is precisely the kind of investment that drives dynamic efficiency — it improves processes and reduces costs over time. Dynamic efficiency improves.
-
Match the combination to the options: Only option B has allocative efficiency unchanged, dynamic efficiency improves, and productive efficiency improves.
Step-by-Step Reasoning
Step 1: Allocative efficiency
- A profit-maximising monopoly produces where MR = MC.
- Because the demand curve is downward-sloping, MR < P at every output level except the first unit.
- Therefore, at the profit-maximising output, P > MC, meaning the monopoly is allocatively inefficient.
- Reinvesting profit into capital stock does not change the monopoly's objective (profit maximisation) or its decision rule (MR = MC). The investment shifts the MC curve downward, but the monopoly will still produce where the new MR = new MC, and P will still exceed MC at that output.
- Allocative efficiency remains unchanged — the monopoly still produces less than the socially optimal output.
Step 2: Productive efficiency
- Productive efficiency requires producing at the minimum point of the average cost curve.
- Investment in capital stock (new machinery, better technology) typically reduces costs. The firm's AC and MC curves shift downward.
- The firm may now produce at a lower average cost than before, moving closer to (or reaching) the minimum of its long-run average cost curve.
- Therefore, productive efficiency improves.
Step 3: Dynamic efficiency
- Dynamic efficiency is about long-run innovation, cost reduction, and product improvement.
- Reinvesting profit into capital stock is a form of investment that improves production processes and reduces costs over time.
- This is exactly the kind of behaviour that dynamic efficiency describes — using current profits to fund future improvements.
- Therefore, dynamic efficiency improves.
Step 4: Match to options
- Allocative efficiency: unchanged
- Dynamic efficiency: improves
- Productive efficiency: improves
- This matches option B.
Key Takeaways
- The three types of efficiency (allocative, productive, dynamic) are distinct and can move independently. A single action may affect them differently.
- A profit-maximising monopoly is always allocatively inefficient (P > MC at its chosen output). No amount of cost reduction changes this unless the monopoly changes its pricing rule.
- Investment in capital stock is a key driver of both productive and dynamic efficiency.
- When answering multiple-choice questions on efficiency, trace the effect on each type separately rather than assuming all efficiencies move together.
Common Mistakes
- Assuming all efficiencies improve together: Many students see "investment in capital stock" and assume everything gets better. But allocative efficiency depends on the pricing/output rule, not on cost levels. The monopoly still restricts output to where MR = MC.
- Confusing productive and dynamic efficiency: Productive efficiency is about minimising cost at a point in time; dynamic efficiency is about improving over time. Investment can improve both, but they are separate concepts.
- Thinking the monopoly becomes allocatively efficient because costs fall: Even if costs fall, the monopoly still produces where MR = MC, and P > MC at that output. Allocative inefficiency persists.
- Not reading the options carefully: The options differ only in which combination of "improves" and "unchanged" is correct. A hasty reading might pick A (all improve) without thinking through allocative efficiency.
Things to Be Careful About
- The question says "reinvest some of this profit to improve its capital stock." This is a specific action — do not assume the monopoly changes its pricing or output behaviour.
- "Most likely outcomes" means you should apply standard economic theory, not consider unusual edge cases.
- Remember that a monopoly's allocative inefficiency is structural (due to market power and the MR < P relationship), not a temporary problem that investment can fix.
- The distinction between short-run and long-run effects matters here: the investment shifts cost curves in the long run, but the monopoly's pricing rule applies in both the short run and the long run.
What is not an example of government failure?
Options
A decreased maximum price causing producers to leave the market
B higher guaranteed price encouraging suppliers to overproduce
C increased minimum wage leading to employers dismissing workers
D increased subsidies encouraging the consumption of a socially desirable product
Answer
Government failure occurs when government intervention leads to a net welfare loss, making the outcome worse than the original market failure. Options A, B, and C all describe unintended negative consequences of intervention: a maximum price that causes producers to leave the market (shortages), a guaranteed price that encourages overproduction (waste), and a minimum wage that leads to job losses (unemployment). Option D describes a successful policy outcome — increased subsidies successfully encouraging consumption of a socially desirable good — which is the opposite of government failure.
Answer
D
D
Background Concept
Government failure is a key concept in the study of market failure and government intervention. It occurs when government intervention in the economy results in a net welfare loss — that is, the costs of the intervention exceed the benefits, or the intervention creates new, unintended problems that are worse than the original market failure. Common causes include: information problems (the government lacks perfect knowledge), administrative costs, unintended behavioural responses, regulatory capture, and the creation of perverse incentives. The concept is central to evaluating the effectiveness of any government policy: even well-intentioned interventions can fail.
Understanding the Question
This is a multiple-choice question asking "What is not an example of government failure?" The word "not" is critical — we must identify the option that describes a successful policy outcome, not a failure. Each option presents a policy and a consequence. Options A, B, and C describe policies that produce unintended negative side effects (producers leaving the market, overproduction, job losses). Option D describes a policy achieving its intended goal (increased consumption of a socially desirable good). The question tests whether you can distinguish between a policy that fails (causes net harm) and one that succeeds (achieves its objective).
Approach
- Recall the definition of government failure: intervention that makes the outcome worse, not better.
- Evaluate each option against this definition:
- Does the consequence represent an unintended negative outcome?
- Or does it represent the intended, beneficial outcome of the policy?
- The option that describes a successful outcome is the one that is NOT an example of government failure.
Step-by-Step Reasoning
Option A: Decreased maximum price causing producers to leave the market.
- A maximum price (price ceiling) is set below the market equilibrium to make a good more affordable (e.g., rent control).
- The intended effect is to help consumers, but the unintended consequence is that producers reduce supply or leave the market, creating shortages.
- This is a classic example of government failure: the policy creates a worse outcome (shortages, black markets) than the original problem.
Option B: Higher guaranteed price encouraging suppliers to overproduce.
- A guaranteed price (price floor) is set above the equilibrium to support producers' incomes (e.g., agricultural price support).
- The intended effect is to raise producer revenue, but the unintended consequence is that suppliers produce more than consumers want, leading to surpluses (waste, storage costs).
- This is another textbook example of government failure.
Option C: Increased minimum wage leading to employers dismissing workers.
- A minimum wage is a price floor in the labour market, intended to raise the incomes of low-paid workers.
- The unintended consequence is that employers may hire fewer workers, causing unemployment among the low-skilled.
- This is a well-known example of government failure: the policy may harm the very people it aims to help.
Option D: Increased subsidies encouraging the consumption of a socially desirable product.
- A subsidy is a payment to producers or consumers to encourage the production or consumption of a good that has positive externalities (e.g., education, vaccinations, renewable energy).
- The intended effect is to increase consumption of the good to a socially optimal level.
- If the subsidy successfully increases consumption, it is achieving its goal — this is a policy success, not a failure. There is no unintended negative consequence described.
Therefore, only Option D is not an example of government failure.
Key Takeaways
- Government failure is defined by a net welfare loss from intervention, not by any unintended consequence per se (though unintended consequences are a common cause).
- The key distinction is between a policy that achieves its intended beneficial outcome and one that creates new problems worse than the original.
- In multiple-choice questions, watch for the word "not" — it inverts the selection criterion.
Common Mistakes
- Confusing any unintended consequence with government failure. Some unintended consequences may be minor or outweighed by benefits; government failure requires the intervention to make things worse overall.
- Misreading the question as "which IS an example of government failure" and selecting D instead of the correct answer.
- Thinking that a subsidy always causes government failure — subsidies can be successful when they correct a positive externality.
Things to Be Careful About
- Read the question stem carefully: "What is not an example of government failure?" The word "not" changes everything.
- For each option, identify both the intended effect and the actual outcome described. If the outcome matches the intention and is beneficial, it is not a failure.
- Remember that government failure is about net welfare loss — a policy can have some negative side effects but still be a net success if the benefits outweigh the costs. The question presents clear-cut cases where the outcome is either clearly negative (A, B, C) or clearly positive (D).
When does a more equal distribution of income occur?
Options
A when a country’s income tax system is made more progressive
B when someone is made better off without making someone else worse off
C when the best use is made of scarce resources
D when there is an increase in the Gini coefficient
Answer
A more equal distribution of income occurs when a country’s income tax system is made more progressive (Option A). A progressive tax takes a higher proportion of income from the rich, reducing post-tax income disparities.
Answer
A
A
Background Concept
Income distribution refers to how total income is shared among individuals or households in an economy. A more equal distribution means that the gap between high and low incomes narrows. Progressive taxation is a policy tool: it imposes a higher average tax rate on higher incomes, thus transferring purchasing power from the rich to the government, which can then fund public services or transfers that benefit lower-income groups. The Gini coefficient measures inequality (0 = perfect equality, 1 = perfect inequality); an increase means greater inequality.
Understanding the Question
This multiple-choice question asks: under which scenario does income distribution become more equal? Each option describes an economic concept:
- Option A: making income tax more progressive.
- Option B: a Pareto improvement (someone better off, no one worse off) – this is about efficiency, not distribution.
- Option C: making the best use of scarce resources – again efficiency (allocative efficiency).
- Option D: an increase in the Gini coefficient – that indicates rising inequality.
The correct answer is the only one that directly reduces inequality: a more progressive income tax.
Approach
Match each option to its standard economic meaning. Option A is a known mechanism to reduce inequality. Options B and C are about efficiency, not equality. Option D is the opposite (more inequality). Therefore, A is correct.
Step-by-Step Reasoning
-
Progressive tax means the average tax rate rises with income. For example, low earners may pay 10%, high earners 40%. This reduces disposable income inequality because high earners pay a larger share of their income in tax. The revenue can be used for benefits or public services that disproportionately help the poor, further reducing inequality. So option A is correct.
-
Option B describes a Pareto improvement: a change that makes at least one person better off without making anyone worse off. While desirable, this does not necessarily affect the distribution of income. It could make the rich even richer and the poor unchanged, widening the gap, or it could benefit the poor. It is not a reliable way to achieve more equal distribution.
-
Option C is about allocative efficiency: using resources to produce the mix of goods most valued by society. This maximises total surplus but says nothing about how that surplus is shared. Greater efficiency can coexist with very unequal distribution.
-
Option D states an increase in the Gini coefficient. The Gini coefficient is a summary measure of inequality: 0 = perfect equality (each household gets the same income), 1 = one household gets everything. A rising Gini indicates widening inequality, so this would be a move away from equal distribution.
Thus only Option A describes a policy that directly and intentionally reduces income inequality.
Key Takeaways
- Progressive taxation is a primary fiscal tool for redistributing income.
- Efficiency (Pareto, allocative) and equity are distinct objectives; policies that increase efficiency do not guarantee greater equality.
- The Gini coefficient is a measure of inequality; an increase means more inequality, not less.
Common Mistakes
- Confusing efficiency with equity. Many students wrongly associate “best use of resources” with fair distribution. They are separate goals.
- Thinking a Pareto improvement automatically reduces inequality: it only ensures no one is harmed, not that gains are shared equally.
- Misinterpreting the Gini coefficient: a higher Gini means greater inequality.
Things to Be Careful About
- Read each option carefully; the wording “more equal distribution” is about narrowing income gaps, not about total welfare or growth.
- Remember that progressive taxation is defined by the tax rate rising with income; a proportional or regressive tax would not reduce inequality as much.
What is not a reason for imposing a tax on producers based on the amount of pollution caused in the production process?
Options
A Firms have a financial incentive to reduce pollution.
B It is relatively hard to administer and monitor this tax scheme.
C Some firms cause less pollution than others.
D Taxes on pollution reduce negative production externalities.
Reasoning
A pollution tax internalises the negative externality of production. Options A, C and D are all valid reasons for imposing such a tax: they provide a financial incentive to reduce pollution (A), allow differentiation based on pollution levels (C), and reduce negative production externalities (D). Option B, however, describes a difficulty in administration and monitoring, which is a drawback, not a reason. Therefore, B is the correct answer.
Answer
B
B
Background Concept
Pollution is a negative production externality: the social cost of production exceeds the private cost. A tax on pollution (a Pigouvian tax) is a government policy to correct this market failure. By taxing each unit of pollution, the government raises the private cost to equal the social cost, internalising the externality. This gives firms an incentive to reduce pollution to avoid the tax. The tax can be based on the amount of pollution emitted, so firms that pollute more pay more. This is a market-based approach that uses price signals.
Understanding the Question
The question asks: "What is not a reason for imposing a tax on producers based on the amount of pollution caused in the production process?" It is a multiple-choice question with four options. We need to identify which option is NOT a valid reason for imposing such a tax. The correct answer is B: "It is relatively hard to administer and monitor this tax scheme." This is a disadvantage or a problem with the tax, not a reason for imposing it. The other options are all valid reasons.
Approach
Read each option and evaluate whether it is a reason (i.e., a positive argument) for imposing the tax. If it is a drawback or a difficulty, it is not a reason. Option B is clearly a difficulty, so it is the answer.
Step-by-Step Reasoning
- Option A: "Firms have a financial incentive to reduce pollution." This is a key reason for imposing a pollution tax: it creates a price on pollution, encouraging firms to find cheaper ways to reduce emissions. This is a reason.
- Option B: "It is relatively hard to administer and monitor this tax scheme." This is a practical problem. It is not a reason to impose the tax; rather, it is a reason against it or a challenge to its implementation. So this is not a reason.
- Option C: "Some firms cause less pollution than others." This is a reason for basing the tax on the amount of pollution: it allows for differentiation. Firms that pollute less pay less, which is fair and efficient. This is a reason.
- Option D: "Taxes on pollution reduce negative production externalities." This is the fundamental rationale: the tax internalises the externality, reducing the divergence between private and social costs. This is a reason.
Therefore, B is the only option that is not a reason.
Key Takeaways
- Pollution taxes are a tool to correct negative externalities.
- The reasons for imposing them include: internalising externalities, providing incentives, and allowing for fair differentiation.
- Difficulties in administration are drawbacks, not reasons.
- In multiple-choice questions, read the question carefully to identify what is being asked (e.g., "not a reason").
Common Mistakes
- Choosing A or D because they are true statements, but failing to notice that the question asks for "not a reason".
- Thinking that difficulty of administration is a reason to impose (it is not; it is a cost).
- Misinterpreting option C: some might think it is not a reason because it states a fact, but it is a reason because it supports the idea of a tax based on pollution levels.
Things to Be Careful About
- Pay attention to the wording: "not a reason".
- Distinguish between reasons (benefits) and drawbacks.
- Understand that a pollution tax is a specific tax based on the amount of pollution, so it can be differentiated.
A government introduced a tax on soft drinks containing sugar. It was forecast that the tax would raise £520m per year for the government. However, the tax received was £240m.
What is the most likely reason why the tax collected was lower than forecast?
Options
A a specific tax instead of an ad valorem tax was introduced
B fewer drinks than originally forecast contained sugar
C most retailers did not increase the price of soft drinks
D the demand for soft drinks was price inelastic
Working
The forecast tax revenue of £520m was based on an expected quantity of sugary drinks sold. Tax revenue = tax per unit × quantity of taxed drinks. If the actual number of drinks containing sugar was lower than forecast, the tax base would be smaller, reducing revenue to £240m. This is the most likely reason.
Option A: A specific tax vs ad valorem affects the tax per unit, but the forecast was presumably based on the chosen tax type; the difference alone does not explain the shortfall.
Option C: If retailers did not increase the price, the tax might still be paid by producers, but revenue still depends on quantity sold.
Option D: If demand were price inelastic, a tax would raise more revenue, not less, because quantity falls little.
Answer
B
B
Background Concept
Government tax revenue from an indirect tax (such as a specific tax or ad valorem tax) is determined by two factors: the tax rate (or tax per unit) and the tax base (the quantity of the good or service that is taxed). The formula is: Tax revenue = Tax per unit × Quantity of taxed goods. A forecast of tax revenue assumes a certain tax base. If the actual tax base is smaller than assumed, revenue will be lower.
Understanding the Question
The question describes a government that introduced a tax on soft drinks containing sugar. The forecast was that the tax would raise £520m per year, but actual revenue was only £240m. We are asked to choose the most likely reason for this discrepancy from four options.
Key point: The forecast was based on some expected quantity of sugary drinks sold. The actual revenue is less than half of the forecast, so the cause must be a large reduction in the tax base or a lower effective tax rate. The options test understanding of the factors that affect tax revenue.
Approach
We need to evaluate each option and determine which one is most likely to cause a significant shortfall in tax revenue. We should consider the economic logic behind each option and eliminate those that would not explain the shortfall or would actually increase revenue.
Step-by-Step Reasoning
-
Option B: fewer drinks than originally forecast contained sugar. This directly reduces the tax base. If the forecast assumed a certain number of drinks containing sugar, but actual production or sales of such drinks is lower, then the quantity taxed is smaller. For example, if the forecast assumed 10 billion drinks taxed at £0.052 per drink = £520m, but actual drinks were only 4.6 billion, revenue would be about £240m. This is a simple and plausible explanation.
-
Option A: a specific tax instead of an ad valorem tax was introduced. A specific tax is a fixed amount per unit, while an ad valorem tax is a percentage of the price. The forecast presumably was based on the type of tax actually introduced; the government would have known which tax they were implementing. The difference between the two does not inherently cause a lower tax base. Moreover, the question does not provide details about the forecast, so it is unlikely that the choice of tax type by itself would cause such a large discrepancy.
-
Option C: most retailers did not increase the price of soft drinks. This might affect the incidence of the tax (who pays), but it does not change the tax base. The tax is still collected on the quantity sold, regardless of who bears the burden. If retailers absorb the tax, the government still receives the tax revenue from the producers or importers. So this does not explain lower revenue.
-
Option D: the demand for soft drinks was price inelastic. If demand is price inelastic, a tax that raises the price leads to a relatively small fall in quantity demanded. This would actually increase tax revenue (because the reduction in quantity is small, while the tax per unit is positive). So this would cause revenue to be higher, not lower, than forecast. This option is the opposite of what is needed.
Therefore, the most likely reason is B: the tax base was overestimated. The forecast assumed a certain number of drinks containing sugar, but the actual number was lower.
Key Takeaways
- Tax revenue depends on tax base (quantity taxed) and tax rate.
- A forecast can be wrong if the tax base is different from what was assumed.
- Price elasticity of demand affects the quantity change due to a tax, but if demand is inelastic, revenue increases, not decreases.
- The type of tax (specific vs ad valorem) does not inherently cause a revenue shortfall if the forecast accounted for it.
Common Mistakes
- Choosing D because of a misunderstanding of elasticity: students might think that inelastic demand leads to lower revenue, but actually it leads to higher revenue because the quantity falls only slightly.
- Choosing A because of confusion between specific and ad valorem taxes: students might think a specific tax might be evaded more easily, but the question does not mention evasion.
- Choosing C because of a belief that if retailers don't raise price, the tax is not collected; but the tax is usually collected from producers or suppliers, not from retailers' price changes.
Things to Be Careful About
- Always think about the source of tax revenue: the quantity of taxed goods and the tax per unit.
- Distinguish between the tax base (quantity) and the tax rate.
- Consider the direction of the effect: an inelastic demand increases revenue, so it cannot explain a shortfall.
- The phrase "most likely reason" implies we need to choose the one that is economically plausible, not just possible.
A government’s aim is to reduce real wage rates.
Which policy should be used to achieve this aim?
Options
A Award public sector workers pay increases below the rate of inflation.
B Encourage private sector pay awards to be in line with company profits.
C Introduce a minimum hourly wage for non-unionised, low-paid workers.
D Remove any restrictions on trade unions to bargain for wages.
Reasoning
Real wage rates are nominal wages adjusted for inflation. To reduce real wage rates, the government must ensure that nominal wages rise by less than the rate of inflation.
Option A achieves this directly: if public sector workers receive a pay increase below the inflation rate, their purchasing power falls, so real wages decline.
Option B would link pay to company profits, which may rise with inflation or productivity, potentially keeping real wages stable or increasing them.
Option C (a minimum wage) would raise nominal wages for low-paid workers, increasing real wages if the increase exceeds inflation.
Option D (removing restrictions on trade unions) would strengthen union bargaining power, likely raising nominal wages and possibly real wages.
Therefore, only Option A is consistent with reducing real wage rates.
Answer
A
A
Background Concept
Real wages measure the purchasing power of nominal wages — the actual quantity of goods and services a worker can buy. The formula is:
Real wage = Nominal wage / Price level (or adjusted for inflation)
A fall in the real wage means that, even if the nominal wage stays the same or rises, the price level rises faster, so the worker can afford less. To deliberately reduce real wages, a government must ensure that nominal wage increases lag behind inflation.
Understanding the Question
The question asks which policy would reduce real wage rates. The key is to distinguish between nominal (money) wages and real (inflation-adjusted) wages. Each option must be evaluated for its effect on nominal wages relative to the price level. The government's aim is to lower real wages, not necessarily nominal wages.
Approach
For each option, consider:
- What happens to nominal wages?
- What happens to the price level (inflation)?
- What is the net effect on real wages?
Only the option that unambiguously reduces real wages is correct.
Step-by-Step Reasoning
Option A: Award public sector workers pay increases below the rate of inflation.
- Nominal wages rise, but by less than the inflation rate.
- Real wage = nominal wage / price level. Since the denominator (price level) rises faster than the numerator, real wages fall.
- This directly achieves the aim.
Option B: Encourage private sector pay awards to be in line with company profits.
- Company profits may rise with inflation (if firms can pass on higher costs) or with productivity.
- If profits rise in line with inflation, nominal wages could keep pace, leaving real wages unchanged or even rising if profits grow faster.
- This does not guarantee a reduction in real wages.
Option C: Introduce a minimum hourly wage for non-unionised, low-paid workers.
- A minimum wage raises nominal wages for the lowest-paid workers.
- Unless the minimum wage is set below the inflation rate (which would be unusual), real wages for these workers increase.
- This is the opposite of the aim.
Option D: Remove any restrictions on trade unions to bargain for wages.
- Stronger unions can negotiate higher nominal wages.
- If nominal wages rise faster than inflation, real wages increase.
- This also works against the aim.
Only Option A reliably reduces real wages.
Key Takeaways
- Always distinguish between nominal and real values in wage and price questions.
- A policy that raises nominal wages does not necessarily raise real wages if inflation is higher.
- To reduce real wages, nominal wage growth must be less than inflation.
Common Mistakes
- Confusing nominal and real wages: some students might think a pay freeze (no nominal increase) reduces real wages, but if inflation is zero, real wages stay the same. The question specifies a reduction in real wages, so the policy must ensure nominal wages lag behind inflation.
- Assuming any wage increase raises real wages: this ignores inflation. A 2% pay rise with 5% inflation reduces real wages.
- Misinterpreting the minimum wage: it raises nominal wages for low-paid workers, so it tends to increase real wages, not reduce them.
Things to Be Careful About
- Read the question carefully: it asks for a policy to reduce real wage rates, not to increase them or keep them stable.
- Consider the effect on both nominal wages and the price level. The government's aim is about real wages, so the policy must affect the relationship between the two.
- Option A is the only one that explicitly ties nominal wage increases to a rate below inflation, guaranteeing a fall in real wages.
How is marginal revenue product calculated?
Options
A marginal physical product × marginal revenue
B marginal physical product ÷ price
C total physical product × marginal cost
D total physical product ÷ marginal cost
Answer
The marginal revenue product (MRP) is calculated as:
MRP = marginal physical product (MPP) × marginal revenue (MR)
This is because MRP measures the additional revenue a firm earns from employing one more unit of a factor of production. The extra output produced is the MPP, and the revenue that each unit of that output brings in is the MR. Multiplying them gives the change in total revenue. Hence, option A is correct.
A
Background Concept
Marginal revenue product (MRP) is a key concept in the theory of labour demand. It represents the additional revenue a firm obtains when it hires one more unit of labour (or any factor of production). The firm’s demand for labour is derived from the demand for its product, so MRP depends on:
- the extra output produced by the additional worker – the marginal physical product (MPP), and
- the revenue each unit of that output sells for – the marginal revenue (MR).
Under perfect competition, MR equals the market price (P), so MRP = MPP × P, which is also called the value of marginal product (VMP). Under imperfect competition, MR is less than P, so MRP < VMP. In all cases, the formula is MRP = MPP × MR.
Understanding the Question
This is a multiple‑choice question asking for the correct formula to calculate marginal revenue product. It tests basic recall of the definition. The options include two involving total physical product (TPP) and two involving division, which are incorrect indicators.
Approach
Start from the definition: MRP is the change in total revenue from a one‑unit change in the quantity of a factor. The change in output is the MPP; the change in revenue from that output is MR. So the calculation must be a product of MPP and MR. Use this to eliminate the other options.
Step-by-Step Reasoning
- Isolate the correct formula: MRP = MPP × MR.
- Option A matches exactly: marginal physical product × marginal revenue.
- Option B: marginal physical product ÷ price – this would give a quantity, not a revenue value, and is not a standard formula for MRP.
- Option C: total physical product × marginal cost – total physical product is the total output, not the extra output, and marginal cost is the cost of extra output, not revenue. This is unrelated.
- Option D: total physical product ÷ marginal cost – again uses total output and cost, not related to MRP.
Only option A is correct.
Key Takeaways
- MRP = MPP × MR.
- MRP is the foundation of the labour demand curve: a firm hires labour up to the point where MRP = wage rate.
- Under perfect competition, MR = P, so MRP = VMP, but the underlying formula remains the same.
Common Mistakes
- Confusing MRP with VMP: the formula is the same (MPP × MR), but students sometimes think VMP = MPP × P and MRP = MPP × MR, which is correct, but they may incorrectly think MRP = VMP always. The distinction only matters in imperfect competition.
- Using total physical product (TPP) instead of marginal physical product – MRP is about the extra unit, not the total.
- Dividing instead of multiplying – MRP is a marginal revenue, not a ratio.
Things to Be Careful About
- In a multiple‑choice question, read each option carefully. The distractors often use ‘total’ instead of ‘marginal’ or involve division. Stick to the definition.
- Remember that MRP is always a product of two marginal values: MPP and MR. No other combination is correct.
- In exams, be prepared to apply this formula to numerical problems where you are given MPP and MR (or price) and asked to calculate MRP.
A teacher currently earns $30 000. She would be willing to continue in that teaching job, provided she earned at least $25 000. Also, she would prefer to remain a teacher than change to her next best alternative employment as an accountant where she could earn $40 000.
Which statement is correct?
Options
A Her economic rent as a teacher is $5000.
B Her economic rent as an accountant is $10 000.
C Her transfer earnings as a teacher are $30 000.
D Her transfer earnings as an accountant are $15 000.
Reasoning
Economic rent = actual earnings – transfer earnings. Transfer earnings are the minimum payment needed to keep the worker in the job; here that is the reservation wage of $25,000. Therefore, economic rent as a teacher = $30,000 – $25,000 = $5,000. The other options are incorrect: for accountant, economic rent would be $40,000 – $30,000 = $10,000, but the question asks about her situation as a teacher. Transfer earnings as a teacher are $25,000, not $30,000. Transfer earnings as an accountant are $30,000, not $15,000.
Answer
A
A
Background Concept
Transfer earnings refer to the minimum payment required to keep a factor of production (here, labour) in its current use. In a competitive labour market, transfer earnings equal the factor's opportunity cost – the earnings available in the next best alternative. Economic rent is the surplus above transfer earnings, i.e., actual earnings minus transfer earnings. For workers with strong preferences for a particular job (e.g., a teacher who values non‑pecuniary aspects), the reservation wage (the lowest wage they would accept to stay in that job) may be lower than the next best monetary alternative. In such cases, transfer earnings are often defined as the reservation wage, since that is the minimum needed to prevent the worker from leaving.
Understanding the Question
The question presents a teacher earning $30,000 who states she would accept at least $25,000 to continue teaching (her reservation wage). Her next best alternative is accounting at $40,000, but she prefers teaching. The task is to identify which numerical statement about economic rent or transfer earnings is correct. The key is to apply the definition correctly: transfer earnings for the teacher are her reservation wage ($25,000), not the accounting salary ($40,000), because she would not necessarily leave teaching even if offered $40,000 elsewhere – her preference means she requires only $25,000 to stay.
Approach
Start by defining transfer earnings and economic rent. For the teacher, identify the minimum she would accept to remain: $25,000. Subtract this from her actual earnings to get economic rent. For the other options, test each using the same logic, and note that the data given applies only to her current job; no information is provided about her reservation wage for accounting.
Step-by-Step Reasoning
- Teacher's transfer earnings: The minimum payment to keep her teaching is her reservation wage of $25,000. This is her opportunity cost in terms of the wage she must be paid to stay, given her preferences.
- Teacher's economic rent: $30,000 – $25,000 = $5,000. Hence option A is correct.
- Option B: Economic rent as an accountant would be $40,000 – (her next best alternative as an accountant, which is teaching at $30,000) = $10,000. But the question asks for the statement that is correct, and this is about her as an accountant, which is not her current position and no information is given about her reservation wage for accounting. Even if we assume transfer earnings = next best alternative, the statement refers to ‘her economic rent as an accountant’, not her situation. The phrasing implies we should consider her actual employment; only A directly matches the given data.
- Option C: Transfer earnings as a teacher are $30,000 – this would imply she is paid exactly her opportunity cost and earns zero economic rent, which contradicts the fact she would stay for $25,000.
- Option D: Transfer earnings as an accountant are $15,000 – this has no basis; if she were an accountant, her next best alternative would be teaching at $30,000, so transfer earnings would be $30,000.
Thus only A is correct.
Key Takeaways
- Transfer earnings represent the minimum required to keep a factor in its current use; economic rent is the excess above that.
- When a worker has strong job preferences, the reservation wage (not the next best market wage) is the appropriate measure of transfer earnings.
- Always identify which job is being discussed and use the data available for that job.
Common Mistakes
- Confusing reservation wage with the next best alternative wage. Many students incorrectly take the accountant salary ($40,000) as the teacher's transfer earnings, leading them to choose option B or calculate a negative rent.
- Applying the formula without checking which person is being considered (teacher vs accountant).
- Assuming that transfer earnings always equal actual earnings (option C) or pulling numbers from the question arbitrarily (option D).
Things to Be Careful About
- Read the scenario carefully: the teacher ‘would prefer to remain a teacher’, which signals non‑pecuniary benefits and that the reservation wage is the relevant minimum.
- Distinguish between the definitions used in perfect labour markets (where transfer earnings = next best alternative) and cases with preferences. Cambridge generally accepts the reservation wage approach when a worker states a lower minimum.
- In the exam, if a question provides both a reservation wage and a next best alternative, the reservation wage is usually the correct transfer earnings when the worker expresses a preference for the current job.
What does the accelerator principle explain?
Options
A how changes in consumption lead to changes in income
B how changes in income lead to changes in consumption
C how changes in income lead to changes in investment
D how changes in investment lead to changes in income
Answer
The accelerator principle explains how changes in income (or output) lead to changes in investment. When national income rises, firms may need to increase their capital stock to meet higher demand, leading to net investment. The size of the induced investment depends on the capital-output ratio and the rate of change of income.
Answer
C
C
Background Concept
The accelerator principle is a theory of induced investment. It states that the level of net investment is determined by the rate of change of national income (or output), not by the level of income itself. The underlying idea is that firms need a certain amount of capital stock to produce a given level of output. If output is constant, firms only need replacement investment to maintain the capital stock. If output grows, firms need additional (net) investment to expand capacity. If output growth slows, net investment falls. The accelerator is often contrasted with the multiplier, which explains how changes in investment lead to changes in income.
Understanding the Question
This is a straightforward multiple-choice question testing the definition of the accelerator principle. The question asks what causal relationship the accelerator explains. The four options present different pairings of changes in consumption, income, and investment. The correct answer is the one that correctly identifies the direction of causation in the accelerator: a change in income (or output) causes a change in investment.
Approach
Recall the standard definition of the accelerator principle. The key is to remember that the accelerator is about the link from changes in output/income to changes in investment. The multiplier is the reverse link (from investment to income). Option C correctly states this relationship.
Step-by-Step Reasoning
- Identify the core relationship: The accelerator principle states that investment is induced by changes in the level of national income (or output).
- Evaluate each option:
- A: "how changes in consumption lead to changes in income" – This describes part of the multiplier process, not the accelerator.
- B: "how changes in income lead to changes in consumption" – This describes the consumption function (the marginal propensity to consume), not the accelerator.
- C: "how changes in income lead to changes in investment" – This is the correct definition of the accelerator principle.
- D: "how changes in investment lead to changes in income" – This describes the multiplier effect, not the accelerator.
- Select the correct option: Option C is the only one that correctly identifies the causal direction of the accelerator principle.
Key Takeaways
- The accelerator principle explains the link from changes in national income to changes in investment.
- It is a theory of induced investment, based on the capital-output ratio.
- It is the opposite causal direction to the multiplier (investment -> income).
- Understanding the difference between the accelerator and the multiplier is a common exam point.
Common Mistakes
- Confusing the accelerator with the multiplier: This is the most common mistake. Students often mix up the direction of causation. The multiplier explains how a change in an injection (like investment) leads to a larger change in national income. The accelerator explains how a change in national income leads to a change in investment.
- Confusing the accelerator with the consumption function: Option B is a plausible distractor because consumption is a function of income, but this is not the accelerator.
Things to Be Careful About
- Pay close attention to the direction of the arrow in the causal relationship. The accelerator is about the effect of income changes on investment, not the other way around.
- Remember that the accelerator is a theory of net investment, not gross investment. Gross investment includes replacement investment, which is not induced by changes in income.
- The accelerator is most relevant when the economy is operating below full capacity. If firms are already at full capacity, an increase in demand may lead to a larger accelerator effect as they scramble to expand capacity.
The diagram shows an economy’s production possibility curve.
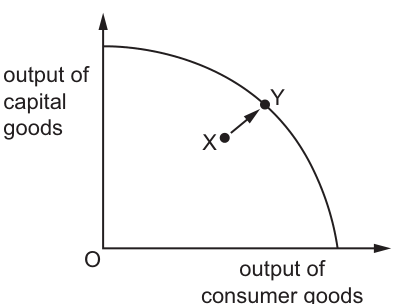
What causes a movement from point X to point Y?
Options
A a positive output gap
B a recession
C actual economic growth
D potential economic growth
Reasoning
Point X lies inside the production possibility curve (PPC), indicating the economy is underutilising its available resources (a negative/recessionary output gap). Point Y lies on the PPC, meaning all resources are fully and efficiently employed. A movement from X to Y represents the economy increasing its actual output by using idle resources, which is actual economic growth. Potential economic growth would require the PPC itself to shift outward, while a recession would be a movement from Y to X. A positive output gap occurs when actual output exceeds potential output, which would lie outside the PPC.
Answer
C
C
Background Concept
A production possibility curve (PPC, also called a production possibility frontier, PPF) is a diagram that shows the maximum possible output combinations of two goods an economy can produce when all its resources are fully and efficiently employed, given its current state of technology and quantity of resources. The curve is typically concave to the origin due to the law of diminishing returns.
- A point on the PPC (like point Y) represents productive efficiency: the economy is using all available resources fully and efficiently, so it cannot produce more of one good without producing less of the other. This level of output is the economy's potential output at that time.
- A point inside the PPC (like point X) represents underutilisation of resources: some resources (e.g. labour, capital) are idle or used inefficiently, so the economy is producing less than its potential. This situation is associated with a negative (recessionary) output gap, where actual national output is below potential output.
- A point outside the PPC is unattainable with current resources and technology.
Actual economic growth is an increase in an economy's real national output, achieved either by using previously idle resources (moving from a point inside the PPC to a point on the curve) or by expanding the economy's productive capacity (shifting the entire PPC outward). Potential economic growth is an increase in the economy's maximum possible output, represented by an outward shift of the entire PPC, caused by factors such as an increase in the quantity or quality of resources, or technological progress. A positive (inflationary) output gap occurs when actual output exceeds potential output, which would be represented by a point outside the PPC (though this is rarely sustained in practice). A recession is a period of falling real output, which would be shown by a movement from a point on the PPC to a point inside it.
Understanding the Question
The question provides a PPC with output of capital goods on the vertical axis and output of consumer goods on the horizontal axis. Point X is located inside the curve, point Y is on the curve, and an arrow shows a movement from X to Y. You are asked to identify which of the four options describes this movement. This is a 1-mark knowledge/application question testing your understanding of PPC interpretations and definitions of economic growth and output gaps.
Approach
First, recall the meaning of positions on the PPC and the definition of each option. Then match the movement shown (from inside the curve to the frontier, with no shift in the curve itself) to the correct concept, eliminating options that do not fit the diagram.
Step-by-Step Reasoning
- Interpret the diagram movement: The arrow shows a move from point X (inside the PPC) to point Y (on the PPC). The PPC itself does not shift, so the economy's productive capacity is unchanged. The movement reflects the economy making better use of its existing idle resources to increase output.
- Evaluate each option:
- Option A (a positive output gap): A positive output gap exists when actual output is above potential output. This would be represented by a point outside the PPC, not a movement from inside to the curve. This is incorrect.
- Option B (a recession): A recession is a period of falling output, which would be shown by a movement from a point on the PPC (Y) to a point inside it (X), the exact opposite of the arrow shown. This is incorrect.
- Option C (actual economic growth): Actual growth is an increase in real output. When an economy is inside the PPC (underutilising resources), it can achieve growth by putting idle resources to work, moving to a point on the PPC. This matches the movement from X to Y exactly, so this is correct.
- Option D (potential economic growth): Potential growth is an increase in the economy's maximum productive capacity, which would shift the entire PPC outward. The diagram shows no shift in the curve, only a movement along the existing curve, so this is incorrect.
Key Takeaways
- A point inside the PPC indicates underutilisation of resources and a negative output gap; a point on the PPC indicates full employment of resources and potential output.
- Actual economic growth can be achieved by moving from inside the PPC to the frontier (using idle resources) or by shifting the PPC outward (potential growth).
- Always distinguish between movements along the PPC (changes in output or resource use with fixed capacity) and shifts of the PPC (changes in productive capacity).
Common Mistakes
- Confusing actual growth with potential growth: actual growth is a movement to the existing frontier using existing resources, while potential growth requires the frontier itself to shift outward.
- Mixing up the direction of recession: a recession reduces output, moving the economy from the frontier to a point inside the PPC, not the other way around.
- Confusing positive and negative output gaps: a positive gap is output above potential (outside the PPC), while a negative gap is output below potential (inside the PPC).
Things to Be Careful About
- Note that the PPC in the diagram does not shift — the movement is along the existing curve, which immediately rules out potential growth (which requires a curve shift).
- The axes are capital goods and consumer goods, but the key feature of the movement is the move from underemployment to full employment of existing resources, which defines actual growth regardless of the mix of goods produced.
- A positive output gap is associated with overheating and inflation, not underutilisation, so it cannot describe a move from inside the PPC to the frontier.
In the quantity theory of money equation, MV = PT, V is defined as the income velocity of circulation.
Which change would tend to reduce the value of V?
Options
A a move to monthly rather than weekly salary payments by firms
B an increase in interest rates
C an increase in the use of cash machines to reduce money balances held
D a decrease in the use of credit cards by individuals
Working
Velocity of circulation (V) is the number of times a unit of money is used to purchase goods and services in a given time period. A move to monthly rather than weekly salary payments means that workers receive their income less frequently, so they will hold larger average money balances between paydays. This reduces the turnover of money, thus reducing V. The other options would increase V: higher interest rates encourage holding less money (increase V), more cash machines reduce money balances held (increase V), and decreased use of credit cards means more cash transactions (increase V).
Answer
A
A
Background Concept
The quantity theory of money is expressed as MV = PT, where M is the money supply, V is the income velocity of circulation, P is the average price level, and T is the volume of transactions (often approximated by real output). V measures how many times a unit of money is used to purchase final goods and services in a given period. It is determined by institutional factors such as payment habits, frequency of income receipts, and the availability of credit.
Understanding the Question
The question asks which change would tend to reduce the value of V. We are given four options: a change in salary payment frequency, a change in interest rates, a change in cash machine availability, and a change in credit card usage. We need to evaluate each option's effect on the average amount of money people hold or the frequency of transactions.
Approach
For each option, consider how it affects the demand for money. If people hold larger average money balances, velocity falls; if they hold smaller balances, velocity rises. Alternatively, think about how often money changes hands: if money is used more frequently, velocity rises; if it is used less frequently, velocity falls.
Step-by-Step Reasoning
-
Option A: a move to monthly rather than weekly salary payments by firms. With weekly payments, workers receive income every week and spend it gradually, holding relatively small average balances. With monthly payments, they receive a larger lump sum and spend it over the month, holding larger average balances. This means the same money is used less frequently to make purchases, so V falls. This is the correct answer.
-
Option B: an increase in interest rates. Higher interest rates increase the opportunity cost of holding money (which earns no interest). People respond by reducing their money holdings, e.g., by depositing more in interest-bearing accounts. With a smaller money stock supporting the same level of transactions, the velocity of circulation must rise. So V increases.
-
Option C: an increase in the use of cash machines to reduce money balances held. Cash machines allow people to withdraw cash as needed, so they can hold smaller cash balances. This reduces the average amount of money held, so the same money is used more frequently, increasing V.
-
Option D: a decrease in the use of credit cards by individuals. Credit cards are a substitute for money; they allow purchases without immediate use of cash. If credit card use decreases, people rely more on cash for transactions. Cash is part of the money supply, so the same money is used more often to make purchases. This increases the velocity of circulation. Therefore V rises, not falls.
Thus only option A reduces V.
Key Takeaways
- Velocity of circulation is influenced by payment habits, frequency of income, and financial technology.
- Changes that increase the demand for money (e.g., less frequent income) reduce velocity.
- Changes that decrease the demand for money (e.g., higher interest rates, better cash access) increase velocity.
- Credit cards are not money; their use affects the demand for money and the frequency of cash transactions.
Common Mistakes
- Confusing the direction of effect: e.g., thinking that higher interest rates reduce velocity because people save more, but actually higher interest rates reduce money demand, increasing velocity.
- Misinterpreting the effect of credit cards: a decrease in credit card use increases the use of cash, which increases velocity, not decreases it.
- Forgetting that velocity is a ratio of nominal GDP to money supply; changes in money demand affect this ratio.
Things to Be Careful About
- Understand that V is not constant; it changes with institutional factors.
- In the quantity theory, V is often assumed constant in the short run, but this question tests the determinants of V.
- When evaluating options, consider the impact on average money holdings, not just the frequency of transactions.
- For credit cards, remember they are a means of payment that reduces the need for money; less use means more money is needed and used, increasing velocity.
What is likely to improve the occupational mobility of labour?
Options
A a decrease in income tax that increases aggregate demand
B a decrease in unemployment benefit
C an increase in retraining schemes for the unemployed
D more advertising of employment vacancies in the economy
Answer
Occupational mobility of labour refers to the ease with which workers can move between different occupations. Retraining schemes equip workers with new skills, enabling them to switch to occupations where their existing skills are not directly applicable. Therefore, option C is correct.
Answer
C
C
Background Concept
Occupational mobility of labour is the ability and willingness of workers to change jobs across different occupations or industries. It depends on factors such as the transferability of skills, the availability of training, the level of information about job opportunities, and barriers like professional licensing or union restrictions. Improving occupational mobility helps reduce structural unemployment and allows the labour market to adjust more efficiently to changes in demand for different types of labour.
Understanding the Question
This multiple-choice question asks which of four options is likely to improve the occupational mobility of labour. Each option describes a different policy or economic change. The task is to identify the one that directly enhances workers' ability to move between occupations.
Approach
Evaluate each option in turn:
- Does it directly affect the skills or qualifications workers possess?
- Does it remove barriers to changing occupation?
- Or does it affect something else, like labour demand or the incentive to work, without improving mobility itself?
The correct answer is the one that most directly and unambiguously increases occupational mobility.
Step-by-Step Reasoning
Option A: a decrease in income tax that increases aggregate demand
A cut in income tax raises disposable income, which may increase aggregate demand and thus the demand for labour in general. However, this does not help a worker move from one occupation to another. It may create more jobs overall, but the worker's existing skills remain unchanged. Occupational mobility is about the supply side — the worker's ability to switch — not the number of vacancies.
Option B: a decrease in unemployment benefit
Lower unemployment benefits may increase the incentive to find work, but they do not equip a worker with new skills. A worker might be forced to take any available job, but that does not mean they can move into a different occupation requiring different qualifications. This option affects the willingness to work, not the ability to change occupation.
Option C: an increase in retraining schemes for the unemployed
Retraining schemes provide workers with new skills and qualifications. This directly enhances their ability to move into occupations that require those skills. For example, a factory worker made redundant could retrain as a software developer or a healthcare assistant. This is the classic policy to improve occupational mobility.
Option D: more advertising of employment vacancies in the economy
Better information about job vacancies can help workers find jobs, but it does not help them acquire the skills needed for a different occupation. It improves the matching of workers to existing vacancies, but if a worker lacks the required skills, advertising alone does not help. This improves information, not mobility.
Therefore, only option C directly improves occupational mobility.
Key Takeaways
- Occupational mobility is about the ability to change occupation, not just the incentive or the availability of jobs.
- Retraining and education are the primary ways to improve occupational mobility.
- Policies that affect labour demand (like tax cuts) or the incentive to work (like benefit cuts) do not directly improve mobility.
Common Mistakes
- Confusing occupational mobility with geographical mobility (moving to a different location) or with labour market flexibility in general.
- Choosing option D because advertising helps workers find jobs — but finding a job is not the same as being able to do a different job.
- Choosing option B because it might force people to work — but compulsion does not give them new skills.
Things to Be Careful About
- Read each option carefully and ask: does this directly affect the worker's ability to switch occupations?
- Remember that occupational mobility is a supply-side characteristic of the labour force, not a demand-side condition.
The diagram shows a closed economy with no government. It is in initial equilibrium when the national income is $1000 million.
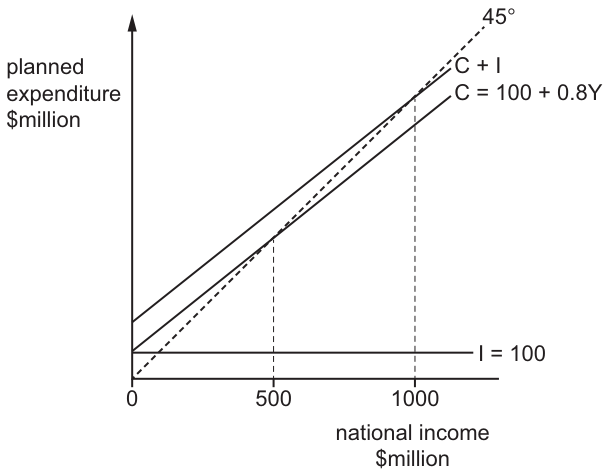
If the full employment national income occurs at $800 million, what is the value of the inflationary gap?
Options
A $40 million
B $160 million
C $260 million
D $840 million
Working
At full employment national income ($800 million):
C = 100 + 0.8(800) = 100 + 640 = $740 million
Planned expenditure (C + I) = 740 + 100 = $840 million
The inflationary gap is the excess of planned expenditure over national income at full employment:
$840 million - $800 million = $40 million
Answer
A
A
Background Concept
The Keynesian cross diagram illustrates national income determination in a closed economy with no government sector. The 45-degree line represents all points where national income (Y) equals planned aggregate expenditure (E), meaning all output produced is purchased. The C + I line shows planned consumption plus planned investment at each level of income. Equilibrium national income occurs where the C + I line intersects the 45-degree line, because only at this point is planned expenditure equal to actual output, so there is no unplanned inventory change.
Consumption is modelled as C = a + bY, where a is autonomous consumption and b is the marginal propensity to consume (MPC). Investment is assumed autonomous (independent of income). The multiplier effect means a change in autonomous expenditure leads to a larger change in equilibrium income.
The full employment national income (Yf) is the level of output at which all available resources, particularly labour, are fully utilised. When equilibrium national income exceeds Yf, the economy is overheating and experiencing an inflationary gap. The inflationary gap is defined as the amount by which planned aggregate expenditure exceeds national income at the full employment level. It represents the excess demand that cannot be met by existing productive capacity, creating upward pressure on the price level.
Understanding the Question
The question provides a Keynesian cross diagram for a closed economy with no government. The consumption function is C = 100 + 0.8Y and investment I = 100. The initial equilibrium is at Y = $1000 million (where C + I intersects the 45-degree line). Full employment national income is given as $800 million. Because equilibrium ($1000m) is above full employment ($800m), the economy has an inflationary gap. The task is to calculate the value of this gap.
Approach
The inflationary gap is the vertical distance between the planned aggregate expenditure line (C + I) and the 45-degree line at the full employment level of income (Y = $800 million). To find it:
- Calculate consumption at Y = 800 using the given consumption function.
- Add investment to get planned expenditure (C + I).
- Subtract the full employment income ($800 million) from this planned expenditure. The difference is the inflationary gap.
An alternative method uses the multiplier: the horizontal gap between equilibrium and full employment is $200 million. Since the multiplier is 1/(1-0.8) = 5, the initial excess expenditure causing this gap is 200/5 = $40 million. Both methods give the same result, but the first is more direct.
Step-by-Step Reasoning
Step 1: Identify the full employment level of income.
The question states full employment national income is $800 million. On the diagram, this corresponds to a vertical line at Y = 800, to the left of the equilibrium at Y = 1000.
Step 2: Calculate planned consumption at Y = 800.
Using C = 100 + 0.8Y:
C = 100 + 0.8(800) = 100 + 640 = $740 million.
Step 3: Calculate total planned expenditure (C + I).
Investment is given as I = 100.
C + I = 740 + 100 = $840 million.
Step 4: Find the inflationary gap.
At Y = 800, the 45-degree line shows that national income (output) is $800 million. However, planned expenditure on this output is $840 million. The difference of $40 million is the inflationary gap. This is the amount by which aggregate demand exceeds the economy's capacity to supply at full employment.
Step 5: Verify using the multiplier (optional check).
MPC = 0.8, so the multiplier k = 1/(1 - 0.8) = 5.
The horizontal distance between equilibrium (1000) and full employment (800) is $200 million.
The initial excess expenditure that, when multiplied by 5, produces this $200 million gap is 200/5 = $40 million. This confirms the inflationary gap is $40 million.
Key Takeaways
The inflationary gap is an expenditure concept, not an income concept. It is measured at the full employment level of income as the vertical distance between the aggregate expenditure line and the 45-degree line. Do not confuse it with the difference between equilibrium income and full employment income (which would be $200 million in this case). The relationship between the two is mediated by the multiplier: Inflationary Gap = (Equilibrium Y - Yf) / multiplier.
Common Mistakes
- Confusing the income gap with the expenditure gap: Students often calculate 1000 - 800 = 200 and look for an answer of $200 million. The inflationary gap is the excess of planned spending over output at full employment, not the excess of equilibrium income over full employment income.
- Forgetting to include investment: When calculating C + I, some students use only C = 740 and forget to add I = 100, getting 740 instead of 840.
- Using the wrong income level: Calculating at Y = 1000 instead of Y = 800. At Y = 1000, planned expenditure equals income (by definition of equilibrium), so the gap would be zero.
- Misinterpreting the diagram: The dashed line at 500 marks the break-even income where C = Y (and C + I = 600). It is irrelevant to finding the inflationary gap at Y = 800.
Things to Be Careful About
- Always read the question to confirm which level of income is full employment ($800m) and which is equilibrium ($1000m).
- The inflationary gap exists only when equilibrium exceeds full employment. If equilibrium were below full employment, it would be a deflationary gap.
- Ensure units are consistent (all figures are in $million).
- The definition of the inflationary gap is specifically the excess of planned aggregate expenditure over the full employment level of national income.
If prices increase in country X but stay the same in country Y, what will be the most likely impact on the internal and external value of money in country X?
Options
| internal value of money | external value of money | |
|---|---|---|
| A | falls | falls |
| B | falls | rises |
| C | rises | falls |
| D | rises | rises |
Reasoning
The internal value of money refers to its purchasing power within the domestic economy. If prices rise in country X, each unit of currency buys fewer goods and services, so the internal value of money falls.
The external value of money is the rate at which it exchanges for foreign currency. Higher inflation in X relative to Y reduces the demand for X's currency (because X's goods are less competitive) and increases the supply of X's currency (to buy cheaper Y's goods). According to purchasing power parity, the currency of the higher-inflation country should depreciate. Therefore, the external value of money also falls.
Answer
A
A
Background Concept
The internal value of money is the amount of goods and services a unit of currency can buy domestically; it is the inverse of the price level. The external value of money is the currency's exchange rate against other currencies, i.e., how many units of foreign currency one unit of domestic currency can buy. These two values are linked: if a country experiences higher inflation than its trading partners, its currency tends to depreciate in the foreign exchange market – a relationship known as purchasing power parity (PPP).
Understanding the Question
The question asks for the most likely impact on both the internal and external value of money in country X given that prices rise in X but stay the same in Y. The command word 'what will be the most likely impact' requires a straightforward causal prediction. The answer must be selected from a table of four combinations.
Approach
- Determine the effect on internal value: rising prices directly reduce purchasing power. Thus internal value falls.
- Determine the effect on external value: compare inflation rates in X and Y. Since X has higher inflation, its goods become relatively more expensive, reducing demand for X's currency. Export revenues fall and import spending rises, leading to a depreciation of X's currency. Thus external value also falls.
- Match the combination to the options: internal falls, external falls corresponds to option A.
Step-by-Step Reasoning
- Internal value: The internal value of money is the reciprocal of the price level. If prices increase by, say, 5%, then each unit of currency can purchase approximately 5% fewer goods. Hence the internal value falls.
- External value: The external value depends on demand for and supply of the currency on foreign exchange markets. Higher domestic inflation makes X's exports less competitive abroad, reducing the demand for X's currency. At the same time, imports from Y become relatively cheaper, increasing the supply of X's currency as residents sell X's currency to buy Y's currency. According to PPP, the exchange rate adjusts to equalise purchasing power across countries: the currency of the higher-inflation country depreciates. Therefore, the external value falls.
- Both internal and external values fall, so the correct answer is A.
Key Takeaways
- The internal value of money is directly linked to the domestic price level.
- The external value (exchange rate) is influenced by relative inflation rates.
- Higher domestic inflation typically leads to both a loss of domestic purchasing power and a depreciation of the currency.
- This question illustrates the interdependence between internal and external macroeconomic objectives.
Common Mistakes
- Choosing option B (internal falls, external rises) – this mistake might arise from thinking that a weaker currency is a 'good thing' because it makes exports cheaper, but the question asks about the value of money, not the effect on trade. A depreciation means the external value has fallen, not risen.
- Choosing option C or D (internal rises) – this would be a complete misunderstanding: rising prices reduce purchasing power, so internal value must fall.
- Confusing the external value with the nominal exchange rate's direction of change: a depreciation is a fall in the external value, not a rise.
Things to Be Careful About
- Distinguish between the internal value (purchasing power) and the external value (exchange rate). They are related but not identical.
- The question refers to 'most likely impact' – while there are other factors affecting exchange rates (interest rates, speculation, capital flows), the pure inflation differential provides the clearest and most likely outcome.
- In the short run, the exchange rate may not adjust immediately, but the question asks for the 'most likely impact' in economic theory, which is a depreciation.
- Remember that the PPP relationship works best in the long run, but for a multiple-choice question, the standard reasoning is sufficient.
Which policy may increase economic growth without causing inflation?
Options
A giving subsidies to producers
B increasing government spending
C lowering direct taxes
D lowering interest rates
Answer
A subsidy to producers shifts the aggregate supply curve to the right (AS1 to AS2). This increases the economy's productive capacity, allowing a higher level of real output (Y1 to Y2) to be produced at a lower price level (P1 to P2). Economic growth is achieved without causing inflation; indeed, the price level falls.
In contrast, increasing government spending (B), lowering direct taxes (C), and lowering interest rates (D) are all demand-side policies that shift aggregate demand to the right. In the short run, this raises real output but also raises the price level, causing demand-pull inflation.
Answer
A
A
Background Concept
This question tests the distinction between demand-side and supply-side macroeconomic policies and their different effects on the price level.
Demand-side policies (fiscal and monetary policy) work by shifting the aggregate demand (AD) curve. Expansionary fiscal policy (increasing government spending or cutting taxes) and expansionary monetary policy (lowering interest rates) both increase total spending in the economy. This shifts AD to the right, raising both real GDP and the price level in the short run — causing demand-pull inflation.
Supply-side policies aim to increase the economy's productive capacity by shifting the aggregate supply (AS) curve to the right. Examples include subsidies to producers, investment in infrastructure, education and training, deregulation, and tax reforms that improve incentives to work and invest. A rightward shift in AS allows the economy to produce more real output at a lower price level, achieving non-inflationary growth.
Understanding the Question
The question asks which single policy can increase economic growth without causing inflation. The key constraint is "without causing inflation" — this eliminates any policy that raises aggregate demand, because a rightward AD shift in the short run raises the price level. The correct answer must be a policy that increases the economy's productive capacity (shifts AS right) rather than increasing spending.
Approach
Evaluate each option in turn:
-
Option A — subsidies to producers: This is a supply-side policy. A subsidy reduces firms' costs of production, shifting the short-run aggregate supply (SRAS) curve to the right. Output rises and the price level falls. This satisfies the condition of growth without inflation.
-
Option B — increasing government spending: This is expansionary fiscal policy. It shifts AD right, raising output and the price level. Inflationary.
-
Option C — lowering direct taxes: This increases households' disposable income, raising consumption and shifting AD right. Inflationary.
-
Option D — lowering interest rates: This is expansionary monetary policy. It reduces the cost of borrowing, encouraging consumption and investment, shifting AD right. Inflationary.
Only option A avoids inflation.
Step-by-Step Reasoning
Step 1: Identify the type of policy for each option.
- A: Supply-side (subsidy to producers)
- B: Demand-side (fiscal policy)
- C: Demand-side (fiscal policy)
- D: Demand-side (monetary policy)
Step 2: Analyse the effect of each policy on AD and AS.
-
Option A: A subsidy reduces the cost of production for firms. This shifts the SRAS curve to the right. At the new equilibrium, real GDP is higher and the price level is lower. There is no inflationary pressure; indeed, the price level falls. This is non-inflationary growth.
-
Option B: An increase in government spending (G) is a direct increase in AD. The AD curve shifts right. In the short run, this raises both real GDP and the price level. This is demand-pull inflation.
-
Option C: Lower direct taxes increase disposable income, which raises consumption (C). This shifts AD right, again causing demand-pull inflation.
-
Option D: Lower interest rates reduce the cost of borrowing, encouraging consumption and investment. This shifts AD right, causing demand-pull inflation.
Step 3: Apply the condition "without causing inflation".
Only option A avoids raising the price level. Options B, C, and D all cause demand-pull inflation.
Key Takeaways
- Demand-side policies (fiscal and monetary) affect AD and tend to cause demand-pull inflation when expansionary.
- Supply-side policies affect AS and can achieve non-inflationary growth by increasing productive capacity.
- A subsidy to producers is a supply-side policy that shifts AS right, lowering the price level while increasing output.
- The question tests the ability to distinguish between the two types of policy and their inflationary consequences.
Common Mistakes
- Confusing supply-side and demand-side policies: A common error is to think that lowering taxes (C) is a supply-side policy. While some tax cuts (e.g., corporate tax cuts) can have supply-side effects, the question specifies "lowering direct taxes" on households, which primarily affects consumption and AD. The question is designed to test this distinction.
- Ignoring the inflation constraint: A student might correctly identify that several options can increase growth but fail to check which one does so without inflation.
- Overthinking: Some students might argue that subsidies could be inflationary if they increase the budget deficit and are financed by printing money. However, the standard textbook treatment is that a subsidy shifts AS right and reduces the price level. The question expects the basic model.
Things to Be Careful About
- Read the question carefully: the key phrase is "without causing inflation".
- Distinguish between policies that affect AD and those that affect AS.
- Remember that a subsidy to producers is a supply-side policy, not a demand-side one.
- In the standard AD/AS model, a rightward shift in AS reduces the price level, so it is the only option that unambiguously avoids inflation.
The current account on the balance of payments moves into deficit.
What is a possible reason for this?
Options
A a decrease in tax revenue
B export-led growth
C repayment of debts to other countries
D the import of new technology
Answer
The current account records trade in goods and services, primary income (e.g. investment income), and secondary income (e.g. transfers). A deficit means the value of imports of goods and services exceeds the value of exports, plus net income and transfers. The import of new technology (D) is an import of goods, which directly worsens the current account balance. A decrease in tax revenue (A) affects the fiscal balance, not the current account. Export-led growth (B) would improve the current account. Repayment of debts (C) is a financial account transaction.
Answer
D
D
Background Concept
The balance of payments is a record of all economic transactions between residents of one country and the rest of the world over a period. It has three main accounts:
- Current account: records trade in goods (visible trade) and services (invisible trade), plus primary income (e.g. dividends, interest, profits from overseas investments) and secondary income (e.g. remittances, foreign aid).
- Financial account: records cross-border investment flows — foreign direct investment (FDI), portfolio investment (shares, bonds), and other investment (loans, currency deposits).
- Capital account: records transfers of capital assets (e.g. debt forgiveness, migrant transfers).
A current account deficit means that, overall, the country is spending more on foreign goods, services, and income payments than it is earning from exports and income receipts. The deficit must be financed by a surplus on the financial/capital account (e.g. borrowing from abroad or selling assets).
Understanding the Question
The question asks: "The current account on the balance of payments moves into deficit. What is a possible reason for this?" Four options are given. The task is to identify which of the four events would directly cause or contribute to a current account deficit. The key is to know what belongs in the current account and what belongs elsewhere.
Approach
For each option, determine whether the transaction is recorded in the current account or in another account. If it is a current account item, assess whether it would worsen (increase the deficit) or improve the balance. If it is not a current account item, it cannot be a direct reason for a current account deficit.
Step-by-Step Reasoning
Option A: a decrease in tax revenue
- Tax revenue is a fiscal (government budget) item. It affects the government's budget balance (deficit/surplus), not the balance of payments directly. A decrease in tax revenue might indirectly affect the current account if it leads to higher government spending or lower taxes that boost imports, but the direct effect is on the fiscal account, not the current account. This is not a direct reason.
Option B: export-led growth
- Export-led growth means the country's economy is expanding because of rising exports. Higher exports would improve the current account balance (more export earnings), moving it towards surplus, not deficit. This is the opposite of a reason for a deficit.
Option C: repayment of debts to other countries
- Repaying debts is a financial transaction — it involves a flow of funds from the domestic economy to foreign creditors. This is recorded in the financial account (as a reduction in liabilities or an outflow of financial assets), not in the current account. It does not directly affect the current account balance.
Option D: the import of new technology
- Importing new technology means buying capital goods (machinery, equipment, software) from abroad. This is an import of goods, which is recorded in the current account under "trade in goods". An increase in imports worsens the trade balance and therefore the current account balance, moving it towards deficit. This is a direct and correct reason.
Key Takeaways
- The current account records trade in goods and services, income flows, and transfers. The financial account records investment and lending flows.
- To identify what affects the current account, ask: is this a transaction involving the exchange of goods, services, income, or transfers? If yes, it belongs in the current account. If it involves borrowing, lending, or investment, it belongs in the financial account.
- A current account deficit is often caused by a high level of imports relative to exports.
Common Mistakes
- Confusing the current account with the financial account. Repayment of debts and foreign investment are financial account items, not current account items.
- Thinking that any outflow of money from the country worsens the current account. Only outflows for goods, services, income, and transfers affect the current account; outflows for financial investments affect the financial account.
- Assuming that a decrease in tax revenue automatically worsens the current account. The link is indirect and not a direct reason.
Things to Be Careful About
- Read each option carefully and classify it by the type of transaction, not by its general economic effect.
- Remember that "export-led growth" means exports are rising, which improves the current account — it cannot be a reason for a deficit.
- The question asks for a "possible reason" — the import of new technology is a clear, direct example of a current account transaction that increases the deficit.
Which policy would not lead to an increase in the value of a country’s currency?
Options
A an increase in domestic inflation
B an increase in domestic interest rates
C an increase in incomes abroad
D an increase in tourists visiting the country
Reasoning
An increase in domestic inflation makes a country's exports less competitive and imports more attractive, reducing the demand for its currency and increasing the supply of it. This puts downward pressure on the exchange rate, so the currency's value falls, not rises.
An increase in domestic interest rates attracts foreign capital inflows, raising demand for the currency and causing it to appreciate. Higher incomes abroad raise demand for the country's exports, increasing demand for its currency. More tourists visiting the country need to buy the domestic currency to spend, also increasing demand for it. Both B, C and D therefore lead to an appreciation.
Answer
A
A
Background Concept
The exchange rate of a currency is determined by the demand for and supply of that currency on the foreign exchange market. Demand for a currency comes from foreigners who want to buy the country's exports, invest in its assets, or spend money there (e.g. tourists). Supply of a currency comes from domestic residents who want to buy foreign goods, services, or assets. Anything that increases demand for the currency causes it to appreciate (rise in value); anything that increases supply of it causes it to depreciate (fall in value).
Understanding the Question
The question asks which of four policies or events would NOT lead to an increase in the value of a country's currency. Three of the options would cause the currency to appreciate; one would cause it to depreciate. The task is to identify the odd one out — the option that would weaken rather than strengthen the currency.
Approach
For each option, consider its effect on the demand for or supply of the domestic currency in the foreign exchange market. If it increases demand or reduces supply, the currency appreciates. If it reduces demand or increases supply, the currency depreciates. The option that causes depreciation is the correct answer.
Step-by-Step Reasoning
Option A: an increase in domestic inflation.
Higher domestic inflation means the country's goods and services become more expensive relative to foreign goods. This reduces the competitiveness of exports, so foreign buyers demand fewer of them, reducing the demand for the domestic currency. At the same time, domestic consumers find imports relatively cheaper, so they buy more foreign goods, increasing the supply of the domestic currency (as they sell it to buy foreign currency). Both effects — lower demand and higher supply — push the exchange rate down. The currency depreciates. So this option would NOT lead to an increase in the currency's value.
Option B: an increase in domestic interest rates.
Higher interest rates make domestic financial assets more attractive to foreign investors. They buy more of these assets, which requires them to buy the domestic currency, increasing demand for it. This causes the currency to appreciate. So this option WOULD lead to an increase in the currency's value.
Option C: an increase in incomes abroad.
Higher incomes in other countries mean their consumers have more purchasing power. They are likely to buy more of everything, including imports from the domestic country. This raises demand for the domestic country's exports, which increases demand for its currency, causing it to appreciate. So this option WOULD lead to an increase in the currency's value.
Option D: an increase in tourists visiting the country.
More tourists need to obtain the domestic currency to spend on accommodation, food, attractions, etc. This increases demand for the currency, causing it to appreciate. So this option WOULD lead to an increase in the currency's value.
Therefore, only option A would not lead to an appreciation; it would cause a depreciation.
Key Takeaways
- The exchange rate is determined by demand and supply in the foreign exchange market.
- Factors that increase demand for a currency (higher exports, higher interest rates, more tourism, higher foreign incomes) cause appreciation.
- Factors that increase supply of a currency (higher imports, higher domestic inflation, lower interest rates) cause depreciation.
- Inflation is a key determinant of competitiveness and therefore of the exchange rate.
Common Mistakes
- Confusing the effect of inflation: some candidates think higher inflation makes a currency more valuable because prices are higher, but in the foreign exchange market it is relative prices that matter — higher domestic inflation makes exports less competitive, reducing demand for the currency.
- Thinking that higher interest rates always attract capital: while true in general, the effect depends on whether the increase is real or nominal and whether other countries' rates also change. For this question, the simple logic suffices.
- Forgetting that tourism is a form of export (invisible export) and therefore increases demand for the currency.
Things to Be Careful About
- Read the question carefully: it asks which policy would NOT lead to an increase. The correct answer is the one that causes a decrease (or no change).
- Distinguish between nominal and real exchange rates: the question refers to the 'value' of the currency, which in this context means the nominal exchange rate.
- Remember that the foreign exchange market is a market like any other: shifts in demand and supply determine the price (the exchange rate).
In an economy with unemployed resources the marginal propensity to consume is 0.2. The government increases its budget deficit and finances it by selling bonds to the non-bank private sector.
What is the likely consequence of this?
Options
A The currency will depreciate, increasing exports and reducing the trade deficit.
B The increase in real output will be limited as the value of the multiplier is low.
C The money supply will fall, leading to a reduction in aggregate demand.
D There will be a decrease in the rate of interest, causing demand-pull inflation.
Working
Multiplier = 1 / (1 - MPC) = 1 / (1 - 0.2) = 1 / 0.8 = 1.25.
The government increases its budget deficit (expansionary fiscal policy) and finances it by selling bonds to the non-bank private sector. This does not increase the money supply; it is a transfer of existing money. With unemployed resources, the increase in aggregate demand from government spending will be multiplied by 1.25. However, because the multiplier is low (1.25), the increase in real output will be limited.
Answer
B
B
Background Concept
The multiplier is a concept in macroeconomics that measures the extent to which an initial change in aggregate demand (e.g., government spending) leads to a larger final change in national income. The formula for the simple multiplier in a closed economy with no government is 1/(1-MPC), where MPC is the marginal propensity to consume. A low MPC means that households save a large proportion of any additional income, so the multiplier effect is small. In this question, MPC = 0.2, so the multiplier is 1/(1-0.2) = 1.25. This means that for every $1 increase in autonomous spending, national income increases by only $1.25.
When the government finances a deficit by selling bonds to the non-bank private sector, it borrows money from households and firms. This does not create new money; it simply transfers existing money from the private sector to the government. In contrast, if the government financed the deficit by selling bonds to the central bank (monetising the debt), the money supply would increase, potentially amplifying the multiplier effect. Here, the financing method does not change the money supply, so the multiplier effect is limited to the low value.
The condition "with unemployed resources" indicates that the economy is operating below full employment, so there is spare capacity. This means that an increase in aggregate demand can lead to an increase in real output without causing inflation (at least initially). However, the low multiplier still limits the size of the output increase.
Understanding the Question
The question describes an economy with unemployed resources (spare capacity) and a marginal propensity to consume of 0.2. The government increases its budget deficit (expansionary fiscal policy) and finances it by selling bonds to the non-bank private sector. We are asked to identify the likely consequence among four options.
Option A suggests the currency will depreciate, increasing exports and reducing the trade deficit. Option B states that the increase in real output will be limited because the multiplier is low. Option C claims the money supply will fall, leading to a reduction in aggregate demand. Option D says there will be a decrease in the rate of interest, causing demand-pull inflation.
We need to evaluate each option based on the multiplier and the financing method.
Approach
- Calculate the multiplier: 1/(1-0.2) = 1.25.
- Understand that bond-financed deficits do not change the money supply.
- Consider the impact on real output: with a low multiplier, the increase in output from government spending is limited.
- Evaluate each option against this reasoning.
Step-by-Step Reasoning
-
Option B: The multiplier is 1.25, which is low. The government spending increase will be multiplied by 1.25, so the increase in real output is limited. This is correct. The presence of unemployed resources means that output can increase, but the low multiplier constrains the size of the increase. Therefore, B is the correct answer.
-
Option A: Currency depreciation is not a direct consequence of this policy. The policy might affect interest rates (if bond sales push up interest rates, the currency could appreciate, not depreciate). Even if the currency depreciated, it would not necessarily increase exports and reduce the trade deficit in the short run (J-curve effect). Moreover, the question does not provide any information about exchange rate mechanisms. So A is unlikely.
-
Option C: Selling bonds to the non-bank private sector does not reduce the money supply. It is a transfer of money from the private sector to the government; the total money supply remains unchanged. The government spends the borrowed money, so aggregate demand increases. Therefore, C is false.
-
Option D: Bond sales typically increase the supply of bonds, which can push up interest rates (crowding out), not decrease them. A decrease in interest rates would occur if the central bank bought bonds (monetary expansion). Here, the government is selling bonds, so interest rates are more likely to rise. Even if interest rates fell, demand-pull inflation would require a large increase in aggregate demand, which is unlikely given the low multiplier. So D is false.
Thus, the only plausible consequence is that the increase in real output is limited due to the low multiplier.
Key Takeaways
- The multiplier is determined by the marginal propensity to consume (and other leakages). A low MPC leads to a low multiplier.
- The method of financing a budget deficit matters: bond-financed deficits do not change the money supply, while money-financed deficits (monetisation) can increase the money supply and potentially amplify the multiplier.
- In an economy with unemployed resources, expansionary fiscal policy can increase output, but the size of the increase depends on the multiplier.
- Always calculate the multiplier when given MPC or other propensities.
Common Mistakes
- Confusing bond-financed deficits with money creation: some students think selling bonds increases the money supply, but it actually transfers existing money.
- Ignoring the multiplier value: students might assume any fiscal expansion will have a large effect, but the low MPC limits it.
- Misinterpreting the effect on interest rates: bond sales tend to raise interest rates, not lower them.
- Overlooking the condition of unemployed resources: without spare capacity, the increase in output would be limited by inflation, but here the constraint is the multiplier.
Things to Be Careful About
- Use the correct formula for the multiplier: 1/(1-MPC) for a closed economy with no government or foreign sector. In this question, no other leakages are mentioned, so this simple formula applies.
- Note that the multiplier is low (1.25), so the impact is small.
- The financing method is crucial: bond sales to non-bank private sector do not affect the money supply.
- The phrase "with unemployed resources" indicates that the economy is not at full employment, so there is scope for output to rise without immediate inflation, but the multiplier still limits the rise.
- When evaluating multiple-choice questions, systematically check each option against the economic theory.
Which components are included in the current account and financial account of the balance of payments?
Options
| current account | financial account | |
|---|---|---|
| A | official reserve assets and trade in goods | trade in services and transactions in official reserve assets |
| B | primary income and trade in goods | official reserve assets and secondary income |
| C | trade in goods and trade in services | foreign direct investment and secondary income |
| D | trade in services and secondary income | portfolio investment and official reserve assets |
Reasoning
The current account records flows of income from trade in goods, trade in services, primary income (investment income and compensation of employees), and secondary income (current transfers). The financial account records transactions in financial assets and liabilities, including foreign direct investment (FDI), portfolio investment, and official reserve assets.
Option A is incorrect because official reserve assets belong to the financial account, not the current account, and trade in goods belongs to the current account, not the financial account.
Option B is incorrect because secondary income is part of the current account, not the financial account.
Option C is incorrect because secondary income is part of the current account, not the financial account.
Option D correctly places trade in services and secondary income in the current account, and portfolio investment and official reserve assets in the financial account.
Answer
D
D
Background Concept
The balance of payments is a record of all economic transactions between residents of one country and the rest of the world over a period of time. It is divided into two main accounts: the current account and the financial account (and a smaller capital account).
The current account records flows of income from:
- Trade in goods (visible trade): exports and imports of physical goods.
- Trade in services (invisible trade): exports and imports of services like tourism, banking, and transport.
- Primary income: income from investments (dividends, interest, profits) and compensation of employees working abroad.
- Secondary income: current transfers such as foreign aid, remittances, and gifts.
The financial account records transactions in financial assets and liabilities, including:
- Foreign direct investment (FDI): investment to acquire a lasting interest in a foreign enterprise (e.g., building a factory).
- Portfolio investment: investment in foreign stocks, bonds, and other financial assets without a controlling interest.
- Other investment: loans, currency deposits, and trade credits.
- Official reserve assets: foreign currency reserves, gold, and Special Drawing Rights (SDRs) held by the central bank.
Understanding the Question
This is a multiple-choice question testing knowledge of the standard components of the current account and financial account. The question presents four options, each pairing a set of items for the current account with a set for the financial account. The task is to identify which option correctly allocates all four items to their correct accounts.
Approach
Recall the standard components of each account. For each option, check whether every item listed under 'current account' genuinely belongs there, and every item listed under 'financial account' genuinely belongs there. Eliminate any option that misplaces even one item.
Step-by-Step Reasoning
- Current account components: trade in goods, trade in services, primary income, secondary income.
- Financial account components: FDI, portfolio investment, other investment, official reserve assets.
- Evaluate each option:
- Option A: Current account includes 'official reserve assets' (wrong – belongs to financial account) and 'trade in goods' (correct). Financial account includes 'trade in services' (wrong – belongs to current account) and 'transactions in official reserve assets' (correct). Two errors → eliminate.
- Option B: Current account includes 'primary income' (correct) and 'trade in goods' (correct). Financial account includes 'official reserve assets' (correct) and 'secondary income' (wrong – belongs to current account). One error → eliminate.
- Option C: Current account includes 'trade in goods' (correct) and 'trade in services' (correct). Financial account includes 'foreign direct investment' (correct) and 'secondary income' (wrong – belongs to current account). One error → eliminate.
- Option D: Current account includes 'trade in services' (correct) and 'secondary income' (correct). Financial account includes 'portfolio investment' (correct) and 'official reserve assets' (correct). All items correctly placed → correct answer.
Key Takeaways
- The current account records income flows from trade and transfers.
- The financial account records transactions in financial assets and liabilities.
- Official reserve assets are a financial account item, not a current account item.
- Secondary income (current transfers) is a current account item, not a financial account item.
Common Mistakes
- Confusing secondary income (current transfers) with financial account items like FDI or portfolio investment.
- Placing official reserve assets in the current account because they involve foreign currency flows.
- Thinking that 'trade in services' is a financial account item because it is 'invisible'.
Things to Be Careful About
- Memorise the standard components of each account precisely.
- Note that the capital account (smaller, recording capital transfers and acquisition/disposal of non-produced non-financial assets) is distinct from the financial account and is not tested here.
- The question uses the term 'financial account' (the modern SNA terminology), not 'capital account' (older terminology).
The graph plots the Gini coefficient and GDP per head for three countries, X, Y and Z.
What can be concluded from the graph?
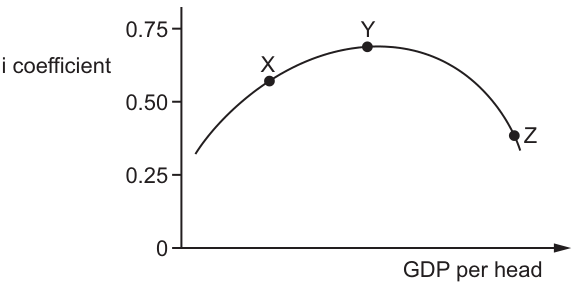
Options
A Average incomes are higher in country X than in country Z.
B Country X is the least developed country.
C Income is equally distributed in country Y.
D The distribution of income in country Y is more even than in country X.
Reasoning
The graph shows a Kuznets curve with GDP per head on the horizontal axis and the Gini coefficient on the vertical axis. GDP per head rises from X to Y to Z, so country X has the lowest average income and is the least developed. The Gini coefficient measures income inequality: a higher value indicates a less equal distribution. Country Y has the highest Gini coefficient (approximately 0.65), meaning income is most unequally distributed there, not equally distributed. Country Z has the lowest Gini (approximately 0.4), so its income distribution is the most even. Option A is incorrect because X has lower GDP per head than Z. Option C is incorrect because a high Gini coefficient signifies inequality, not equality. Option D is incorrect because Y has a higher Gini than X, so its distribution is less even.
Answer
B
B
Background Concept
The Kuznets curve is an inverted U-shaped hypothesis that describes the relationship between a country's level of economic development (typically measured by GDP per head) and its income inequality (measured by the Gini coefficient). The theory suggests that as an economy develops from an agrarian to an industrialised one, income inequality first rises (as some sectors grow faster than others) and then falls (as education spreads, labour markets mature and redistribution policies take effect). The Gini coefficient is a summary statistic ranging from 0 (perfect equality, where everyone has the same income) to 1 (perfect inequality, where one person has all the income). A higher Gini coefficient therefore indicates a more unequal distribution of income. GDP per head (GDP per capita) is a standard monetary indicator of the average income level and overall economic development of a country.
Understanding the Question
The question presents a graph plotting the Gini coefficient against GDP per head for three countries: X, Y and Z. The curve is inverted U-shaped. Country X is on the upward-sloping portion with a Gini of approximately 0.6 and the lowest GDP per head. Country Y is at the peak with a Gini of approximately 0.65 and medium GDP per head. Country Z is on the downward-sloping portion with a Gini of approximately 0.4 and the highest GDP per head. The task is to identify which single conclusion can validly be drawn from this data.
Approach
To answer this, each option must be tested against the two variables shown:
- Determine the ranking of countries by GDP per head (development level) from the horizontal axis: X < Y < Z.
- Determine the ranking by income inequality from the Gini coefficient (vertical axis): Y (most unequal) > X > Z (most equal).
- Evaluate each option against these facts, remembering that a higher Gini means less equal distribution, not more.
Step-by-Step Reasoning
Option A: Average incomes are higher in country X than in country Z.
This is false. The horizontal axis shows GDP per head increasing from left to right. Country X is to the left of country Z, meaning X has a lower GDP per head. Therefore, average incomes are lower in X than in Z.
Option B: Country X is the least developed country.
This is true. GDP per head is the standard proxy for the level of economic development. Since X has the lowest GDP per head of the three countries, it is the least developed. This is consistent with the Kuznets curve hypothesis, which places countries with low development and rising inequality on the left-hand upward-sloping portion.
Option C: Income is equally distributed in country Y.
This is false. Country Y has the highest Gini coefficient (approximately 0.65). A Gini of 0 would indicate perfect equality. A value of 0.65 indicates a relatively high degree of income inequality. Therefore, income is least equally distributed in Y, not equally distributed.
Option D: The distribution of income in country Y is more even than in country X.
This is false. Country Y has a higher Gini coefficient (~0.65) than country X (~0.6). Since a higher Gini means a less even (more unequal) distribution, Y's distribution is less even than X's, not more even.
Since only option B is consistent with the graph, it is the correct conclusion.
Key Takeaways
- The Kuznets curve depicts an inverted U-shaped relationship between economic development and income inequality.
- GDP per head increases from left to right; a country further to the right is more developed and has higher average incomes.
- The Gini coefficient increases from bottom to top; a higher value indicates greater income inequality (less equal distribution).
- When interpreting such graphs, always check the axis labels and the direction of increase before drawing conclusions.
Common Mistakes
- Confusing the Gini coefficient: Students sometimes think a higher Gini means more equality. It means the opposite: 0 is perfect equality, 1 is perfect inequality.
- Misreading the axes: The peak of the curve (point Y) might be mistaken for the 'best' or 'most developed' position because it is highest on the page, but the horizontal axis determines development level. Y is at the peak of inequality, not development.
- Ignoring the direction of the horizontal axis: Assuming that left-to-right movement decreases development, when it actually increases GDP per head.
- Selecting C because Y is at the 'top': The vertical position shows the level of the Gini coefficient, not the level of equality. Y is at the top of the graph because inequality is highest there.
Things to Be Careful About
- Always note the units and direction of each axis. Here, GDP per head rises left-to-right; Gini rises bottom-to-top.
- The Kuznets curve is an empirical generalisation, not an absolute law, but the question asks what can be concluded from the graph as drawn, so the geometric relationships take precedence.
- Ensure you distinguish between the level of development (GDP per head) and the distribution of income (Gini). A country can be highly developed but still have some inequality (as shown by Z).
What is least likely to lead to an increase in optimum population?
Options
A an improvement in labour productivity
B an improvement in the quality of capital and technology
C an increase in birth rate and a fall in death rate
D an increase in the availability of natural resources
Answer
Optimum population is the population size that, given the available resources and technology, maximises output per head. An increase in optimum population means the economy can support a larger population at the same or higher living standard. This requires an increase in the economy's productive capacity.
- A – An improvement in labour productivity raises output per worker, increasing the population the economy can support at the optimum. This would raise optimum population.
- B – Better quality capital and technology raise total factor productivity, again increasing the sustainable population. This would raise optimum population.
- C – An increase in the birth rate and a fall in the death rate change the actual population size, not the economy's capacity to support it. They do not, by themselves, increase productive capacity. This is the least likely to lead to an increase in optimum population.
- D – More natural resources increase the resource base, allowing a larger population to be supported at the optimum. This would raise optimum population.
Therefore, the correct answer is C.
C
Background Concept
Optimum population is a concept from development economics. It refers to the size of population that, when combined with the existing stock of capital, natural resources, and technology, yields the highest possible output per capita (or living standard). At the optimum, the average product of labour is maximised. If population is below the optimum, adding more people raises output per head because there are underutilised resources. If population is above the optimum, adding more people reduces output per head because of diminishing returns to the fixed factors.
Crucially, optimum population is not fixed. It changes when the economy's productive capacity changes — for example, through better technology, more capital, more natural resources, or higher labour productivity. A change in the actual population size (births, deaths, migration) does not, by itself, shift the optimum; it merely moves the economy along the existing output-per-head curve.
Understanding the Question
The question asks which of the four options is least likely to lead to an increase in optimum population. This is a negative selection — we need to identify the one that does NOT raise the economy's productive capacity. Options A, B, and D all directly increase the ability of the economy to support a larger population at the same or higher living standard. Option C changes the actual population size but does not increase the economy's capacity. Therefore, C is the odd one out.
Approach
- Define optimum population and what causes it to increase.
- Evaluate each option against that definition.
- Identify the option that does not increase productive capacity.
Step-by-Step Reasoning
-
Option A: an improvement in labour productivity – If each worker produces more output, the same number of workers can produce more total output, or a larger number of workers can be supported at the same output per head. This shifts the optimum population upward. So A is likely to increase optimum population.
-
Option B: an improvement in the quality of capital and technology – Better capital and technology raise total factor productivity. The economy can produce more with the same resources, including labour. This also shifts the optimum population upward. So B is likely to increase optimum population.
-
Option C: an increase in birth rate and a fall in death rate – This changes the actual population size (it grows), but it does not change the economy's productive capacity. The optimum population is a function of resources and technology, not of the current population. A larger actual population might even push the economy beyond the optimum, reducing output per head. So C does not increase optimum population; it is the least likely to do so.
-
Option D: an increase in the availability of natural resources – More natural resources (e.g., new mineral discoveries, more arable land) expand the resource base. The economy can now support a larger population at the same living standard. This shifts the optimum population upward. So D is likely to increase optimum population.
Key Takeaways
- Optimum population is about the capacity of the economy, not the actual number of people.
- Factors that increase productive capacity (labour productivity, capital, technology, natural resources) raise the optimum population.
- Changes in birth and death rates affect actual population size, not the optimum.
Common Mistakes
- Confusing optimum population with actual population. A student might think that a higher birth rate automatically means the economy can support more people, but that is not true — it depends on whether productive capacity has increased.
- Thinking that a fall in death rate always improves living standards. It may simply increase the population without a corresponding increase in output, lowering output per head.
Things to Be Careful About
- Read the question carefully: it asks for the option least likely to lead to an increase. That is a negative selection.
- Remember that optimum population is a normative concept — it is the population that maximises output per head, not the maximum possible population.
What is not included as a weighted indicator of poverty in the Multidimensional Poverty Index (MPI)?
Options
A cooking fuel
B electricity
C medication
D water
Reasoning
The Multidimensional Poverty Index (MPI) measures poverty across three dimensions: health, education, and living standards. The living standards dimension includes indicators such as cooking fuel, electricity, and water. Medication is not a standard indicator in the MPI; health is measured by nutrition and child mortality. Therefore, medication is not included.
Answer
C
C
Background Concept
The Multidimensional Poverty Index (MPI) is a composite indicator developed by the Oxford Poverty and Human Development Initiative (OPHI) and the United Nations Development Programme (UNDP). It identifies deprivations across three equally weighted dimensions: health, education, and living standards. Each dimension has specific indicators:
- Health: nutrition and child mortality.
- Education: years of schooling and school attendance.
- Living standards: cooking fuel, sanitation, water, electricity, housing, and assets.
A household is considered multidimensionally poor if it is deprived in at least one-third of the weighted indicators.
Understanding the Question
The question asks which of the four options is NOT a weighted indicator in the MPI. This is a factual recall question. The options are all related to basic needs, but only three are part of the MPI's living standards dimension. Medication is not included; health is captured through nutrition and child mortality instead.
Approach
Recall the three dimensions and their specific indicators. Identify which option does not appear in the official MPI indicator list.
Step-by-Step Reasoning
- The MPI has 10 indicators across three dimensions.
- Living standards dimension includes: cooking fuel, electricity, water, sanitation, housing, and assets.
- Both cooking fuel (A) and electricity (B) and water (D) are explicitly listed.
- Medication (C) is not an indicator; health is measured by nutrition and child mortality.
- Therefore, the correct answer is C.
Key Takeaways
- The MPI is a multidimensional measure of poverty beyond income.
- Knowing the specific indicators for each dimension is essential for such recall questions.
- The MPI is updated periodically, but the core indicators remain stable.
Common Mistakes
- Confusing the MPI with the Human Development Index (HDI), which includes health (life expectancy), education, and income.
- Assuming that medication is part of health dimension because it relates to health, but the MPI uses nutrition and child mortality instead.
Things to Be Careful About
- Ensure you memorise the exact indicators for the MPI as per the syllabus.
- The question asks for what is NOT included, so read carefully to avoid selecting an included item.
Which role is performed by the World Bank but not by the International Monetary Fund (IMF)?
Options
A facilitating free trade among member countries
B providing assistance to member countries to plan fiscal policies
C providing bailout packages to countries facing external account challenges
D providing monetary assistance to member countries to build infrastructure
Working
The International Monetary Fund (IMF) is primarily responsible for maintaining the stability of the international monetary system, providing short-term financial assistance to countries facing balance of payments difficulties, and offering policy advice on fiscal and monetary matters. The World Bank, in contrast, focuses on long-term economic development and poverty reduction, providing loans and grants for infrastructure projects such as roads, schools, and hospitals.
Thus, the role of providing monetary assistance to build infrastructure is performed by the World Bank but not by the IMF.
Answer
D
D
Background Concept
The International Monetary Fund (IMF) and the World Bank are two major international financial institutions created at the Bretton Woods Conference in 1944. The IMF is designed to oversee the international monetary system, promote exchange rate stability, and provide short-term loans to countries experiencing balance of payments problems. The World Bank (originally the International Bank for Reconstruction and Development) focuses on long-term economic development by providing loans and grants for infrastructure, education, health, and other projects that reduce poverty and promote sustainable growth.
Understanding the Question
This question asks you to identify which of the listed roles is performed by the World Bank but not by the IMF. It is a straightforward factual recall question testing your knowledge of the core functions of each institution. The correct answer is D, as the World Bank is the only one that provides monetary assistance specifically for building infrastructure.
Approach
To answer correctly, recall the primary functions of each institution. The IMF deals with short-term macroeconomic stability and balance of payments crises. The World Bank deals with long-term development projects. Then evaluate each option:
- A: Facilitating free trade is more associated with the World Trade Organization (WTO), not a core function of either institution.
- B: Assisting with fiscal policy planning is a role of the IMF, which provides policy advice and technical assistance to member countries.
- C: Providing bailout packages for external account challenges is the IMF's main function, e.g., loans to countries like Greece or Argentina.
- D: Providing monetary assistance to build infrastructure is the World Bank's role, through its various lending arms.
Thus, only D fits the description.
Step-by-Step Reasoning
-
Identify the functions of the IMF: It monitors economic and financial developments, provides policy advice, and offers short-term financial support to countries with balance of payments difficulties. It does not typically fund large infrastructure projects.
-
Identify the functions of the World Bank: It provides long-term loans and grants for development projects, including infrastructure (roads, ports, dams, schools), health, education, and environmental programs. It also offers technical assistance and policy advice for development.
-
Evaluate each option:
- Option A: Facilitating free trade is not a direct role of either the IMF or the World Bank; it is the WTO's domain. So this cannot be correct.
- Option B: Assisting member countries to plan fiscal policies is a role of the IMF (e.g., Article IV consultations, technical assistance). So this is performed by the IMF, not exclusive to the World Bank.
- Option C: Providing bailout packages to countries facing external account challenges is the IMF's core function (e.g., Stand-By Arrangements). So this is performed by the IMF.
- Option D: Providing monetary assistance to build infrastructure is a key role of the World Bank (e.g., through the International Development Association and International Bank for Reconstruction and Development). This is not performed by the IMF.
-
Therefore, D is the correct answer.
Key Takeaways
- The IMF focuses on short-term macroeconomic stability and balance of payments assistance.
- The World Bank focuses on long-term development and poverty reduction through infrastructure and other projects.
- Knowing the distinct roles of these institutions is essential for understanding international economics and policy.
Common Mistakes
A common mistake is confusing the two institutions, assuming both provide development aid or both provide short-term loans. Some students might think the IMF also funds infrastructure projects, which is incorrect. Another mistake is choosing option A (free trade) because it seems like an international role, but it is not the primary function of either.
Things to Be Careful About
- Read the question carefully: it asks for a role performed by the World Bank but not by the IMF. So you need to exclude options that are shared or performed by the IMF.
- Remember that the IMF does provide policy advice on fiscal matters (option B), so option B is incorrect.
- Option C is clearly the IMF's bailout role, so it is not exclusive to the World Bank.
- Option D is the only one that is uniquely the World Bank's role.
Some economists argue there is little evidence of the value of aid in improving economic development in less-developed countries.
Which situation supports this claim?
Options
A Capacity to benefit from transfer of communications technology has increased.
B Investment in infrastructure has created transport links and port facilities.
C Over-reliance on technical assistance has impaired local initiatives and innovation.
D Projects for education and training have helped to enhance the supply side.
Reasoning
The claim is that there is little evidence of the value of aid in improving economic development. To support this, we need a situation where aid has a negative effect, or where its positive effects are undermined.
- Option A: Increased capacity to benefit from technology transfer would suggest aid is valuable, so it does not support the claim.
- Option B: Investment in infrastructure is a positive outcome, contradicting the claim.
- Option C: Over-reliance on technical assistance impairing local initiatives and innovation is a negative consequence of aid, showing it can be harmful or ineffective, thus supporting the claim.
- Option D: Education and training enhancing the supply side is a positive effect, not supporting the claim.
Therefore, the correct option is C.
Answer
C
C
Background Concept
Foreign aid is a transfer of resources from developed to less-developed countries (LDCs) intended to promote economic development. The effectiveness of aid is debated: some argue it can build infrastructure, improve health and education, and stimulate growth, while others contend it fosters dependency, distorts local markets, and undermines local institutions. The question tests the ability to identify a situation that aligns with the sceptical view.
Understanding the Question
The question asks: which situation supports the claim that there is little evidence of the value of aid in improving economic development? The claim is that aid is not very beneficial. Therefore, the correct answer must describe a negative outcome of aid, or a way in which aid fails to produce development. Options A, B, and D all describe positive outcomes, which would contradict the claim. Option C describes a negative effect (over-reliance impairing local initiatives), which supports the claim.
Approach
Read each option carefully and decide whether it represents a positive or negative consequence of aid. Only one option shows a negative consequence, making it the correct choice.
Step-by-Step Reasoning
- Option A: “Capacity to benefit from transfer of communications technology has increased.” This suggests that aid has helped build the capacity to use new technology, which is a positive development outcome. It does not support the claim that aid is of little value.
- Option B: “Investment in infrastructure has created transport links and port facilities.” Infrastructure is a classic example of aid effectiveness, directly improving productive capacity. This is a positive outcome, not supportive of the claim.
- Option C: “Over-reliance on technical assistance has impaired local initiatives and innovation.” This describes a situation where aid creates dependency and stifles local entrepreneurship and innovation. This is a negative effect, meaning aid may be harmful or at least not beneficial, thus supporting the claim that there is little evidence of its value.
- Option D: “Projects for education and training have helped to enhance the supply side.” Improving human capital through education and training is a positive long-term development outcome, contradicting the claim.
Therefore, only option C provides a situation that supports the claim that aid is not valuable.
Key Takeaways
- Aid can have both positive and negative effects. The negative effects include dependency, corruption, and the crowding out of local initiative.
- When evaluating claims about aid effectiveness, it is important to distinguish between outcomes that show benefit and those that show harm or lack of benefit.
- This question tests the ability to apply critical thinking to a real-world economic debate.
Common Mistakes
- Choosing an option that describes a positive outcome because the student mistakenly thinks “supports the claim” means “shows how aid works” rather than “provides evidence against the claim.”
- Misreading the claim: “little evidence of the value” means aid is not proven to be valuable, so we need a situation that reinforces that doubt, not one that counters it.
Things to Be Careful About
- Read the question statement carefully: it asks for the situation that supports the claim, not the one that contradicts it.
- Ensure you understand the direction of causality: over-reliance on technical assistance causing impairment is a negative effect of aid, which supports the sceptical view.
Your score so far
Answer a question to start scoring
Your marks add up here as you work through the paper.