Economics 9708/42 — May/June 2024
Cambridge A-Level · A Level Data Response and Essays · worked solutions for every part, with the mark scheme
Topics Costs of Production · Demand for and Supply of Labour · Employment and Unemployment · Macroeconomic Objectives and Policy Conflicts · Balance of Payments and Policies to Correct Disequilibrium · Efficiency and Market Failure · +7 more
Developments in the electric vehicle (EV) industry
The advantage of the car is that it provides freedom for the consumer. However, the disadvantages of car use are that it creates congestion, carbon dioxide (CO2) and air pollution. These disadvantages led many countries to agree to replace internal combustion engine (ICE) cars with electric vehicles (EV) from 2030.
The successful introduction of EV is dependent on the development of battery technology and production of batteries to enable EV to drive a similar distance to ICE cars before they need re-charging. Better electrode design, battery assembly and chemistry are all technical aspects of battery production that could reduce costs, resulting in economies of scale from more efficient use of capital and labour. In addition to technical economies, there may well be purchasing economies of scale in battery production when buying raw materials and capital equipment in bulk.
Table 1.1 shows the estimated average costs of battery production for EV using two different technologies.
Table 1.1 Average costs of battery production
| Annual production | US$ per kwh | US$ per kwh |
|---|---|---|
| kwh (millions) | Technology A | Technology B |
| 0.5 | 115 | 120 |
| 2.0 | 105 | 90 |
| 4.0 | 98 | 80 |
| 10.0 | 97 | 80 |
The shift to EV will cause redundancies for highly skilled mechanical engineers who have developed and refined the ICE. Often these workers are concentrated in specific areas, such as southern Germany.
The change from ICE cars to EV may also cause difficulties for governments in two ways. First, many countries rely on oil exports for a large part of their income. For example, Saudi Arabia receives 45% of its gross national income (GNI) from oil exports. Secondly, other governments place an indirect tax on petrol (gasoline) and diesel as part of their general revenue. For example, Singapore charges S$0.41 per litre, approximately 17% of the price.
Sources: Applied Energy 286 (2021) Economies of scale in battery cell manufacturing, 25 April 2022, and The Singapore Independent, 28 March 2022
Explain what is meant by internal economies of scale, using an example from the information.
Answer
Internal economies of scale are the cost advantages a firm gains as it increases output in the long run, leading to a reduction in long-run average costs (LRAC).
An example from the information is technical economies of scale: better electrode design, battery assembly and chemistry allow more efficient use of capital and labour, lowering average battery production costs as output rises. Alternatively, purchasing economies of scale occur when bulk buying of raw materials and capital equipment reduces input costs per unit.
Internal economies of scale are long-run average cost reductions as output increases, with examples including technical economies from improved battery production processes or purchasing economies from bulk buying of inputs.
Background Concept
Economies of scale are cost advantages that firms experience as they expand their scale of production. Internal economies of scale are cost savings that arise from the growth of the individual firm itself, rather than from industry-wide factors. They include technical economies (from more efficient use of capital and labour, or improved production techniques), purchasing economies (from buying inputs in bulk at discounted rates), managerial economies (from specialisation of management), marketing economies (from spreading advertising costs over larger output), and financial economies (from accessing lower-interest borrowing as a larger, less risky firm). Internal economies of scale cause the long-run average cost (LRAC) curve to slope downwards as output increases.
Understanding the Question
This 3-mark question asks you to explain the meaning of internal economies of scale, and use an example from the provided text about the electric vehicle (EV) industry. The extract mentions that better battery production techniques and bulk buying of inputs can reduce battery costs as output rises, which are direct examples of internal economies of scale. The question is worth 3 marks, so you need to provide a clear definition, identify the type of economy of scale, and link it to the extract's content.
Approach
First, give a precise definition of internal economies of scale, referencing the link to long-run average costs and firm output. Then, identify the two types of internal economies mentioned in the extract (technical and purchasing) and give a specific example from the text for each, to secure all 3 marks. Keep the answer concise, as it is a short 3-mark part.
Step-by-Step Reasoning
- Definition (1 mark): Start by defining internal economies of scale as cost reductions that occur when a single firm increases its output in the long run, leading to lower LRAC. This is the core knowledge point for the first mark.
- Type of economy (1 mark): Name the relevant types of internal economies mentioned in the extract: technical economies (from improved production techniques for batteries) and purchasing economies (from bulk buying of raw materials and capital equipment). Either is acceptable for the second mark.
- Example from the text (1 mark): Link the concept directly to the extract: for technical economies, use the example of better electrode design, battery assembly and chemistry leading to more efficient use of capital and labour. For purchasing economies, use the example of bulk buying of raw materials and capital equipment lowering input costs. This secures the third mark by applying the concept to the given context.
Key Takeaways
- Internal economies of scale are firm-specific cost savings from expanding output, distinct from external economies which benefit all firms in an industry.
- When a question asks for an example from the text, you must explicitly link the economic concept to a specific detail from the extract, not just give a generic example.
- The two types of internal economies mentioned in this extract are technical and purchasing economies.
Common Mistakes
- Giving a definition of economies of scale in general, rather than specifying internal economies of scale (which are firm-specific). This would lose the first mark.
- Giving an example that is not from the provided text, such as economies of scale in car assembly generally, rather than linking to the battery production details in the extract. This would lose the third mark.
- Confusing internal and external economies of scale: external economies arise from industry-wide growth, not the expansion of a single firm.
Things to Be Careful About
- Ensure your definition explicitly mentions that internal economies of scale lead to lower long-run average costs as the firm's output increases, as this is the key feature examiners look for.
- When giving an example, quote the specific detail from the extract (e.g. "better electrode design") to make it clear you are using the provided information, not a generic example.
Consider what is meant by minimum efficient scale and to what extent the data in Table 1.1 suggest this has been achieved.
Answer
Minimum efficient scale (MES) is the lowest level of output at which a firm achieves the minimum long-run average cost (LRAC), beyond which further increases in output do not reduce average costs.
For Technology A, average costs fall from US$115 per kwh at 0.5 million kwh to US$97 per kwh at 10 million kwh, with a small fall between 4.0 and 10.0 million kwh, suggesting MES may not have been fully reached, as costs are still declining slightly at higher output levels.
For Technology B, average costs fall from US$120 per kwh at 0.5 million kwh to US$80 per kwh at 2.0 million kwh, and remain constant at US$80 per kwh at 4.0 and 10.0 million kwh, indicating MES has been reached at 2.0 million kwh, as further output increases do not lower average costs.
MES is the minimum output where LRAC is minimised and no longer falls with higher output; Technology A has likely not reached MES, while Technology B has reached MES at 2.0 million kwh.
Background Concept
Minimum efficient scale (MES) is a key concept related to economies of scale. It refers to the smallest level of output that a firm can produce while fully exploiting all available internal economies of scale, reaching the minimum point of the long-run average cost (LRAC) curve. Beyond this output level, the firm experiences constant returns to scale, so LRAC remains unchanged as output increases further. MES is important because it determines the optimal size of firms in an industry: if MES is very high relative to market demand, the industry will tend to be dominated by a small number of large firms (high concentration ratio), while a low MES allows many small firms to operate efficiently.
Understanding the Question
This 3-mark question asks you to explain what is meant by minimum efficient scale, and assess the extent to which the data in Table 1.1 suggests MES has been achieved for the two battery production technologies. The table shows average costs per kwh at different annual output levels for Technology A and B. You need to link the definition of MES to the data: if average costs are still falling at the highest output level, MES has not been reached; if average costs are constant at higher output levels, MES has been reached.
Approach
First, give a clear definition of MES, referencing the LRAC curve and the point where average costs stop falling. Then, analyse the data for each technology separately: for Technology A, check if average costs are still falling at the highest output (10 million kwh); for Technology B, check if average costs are constant at higher output levels after 2.0 million kwh. Be specific with the data figures to support your assessment.
Step-by-Step Reasoning
- Definition (1 mark): Define MES as the lowest output level where LRAC is minimised, and further output increases do not lead to lower average costs. This is the core knowledge point.
- Assessment of Technology A (1 mark): Look at the cost data for Technology A: costs fall from $115 at 0.5m kwh to $97 at 10m kwh, with a small fall from $98 to $97 between 4.0 and 10.0 million kwh. Since costs are still falling at the highest output level, MES has not been fully reached for Technology A.
- Assessment of Technology B (1 mark): Look at the cost data for Technology B: costs fall from $120 at 0.5m kwh to $80 at 2.0m kwh, and stay at $80 at 4.0 and 10.0 million kwh. Since costs stop falling after 2.0 million kwh, MES has been reached at this output level for Technology B.
Key Takeaways
- MES is the point on the LRAC curve where average costs are minimised and stop falling as output increases.
- When interpreting data tables for MES, look for the output level where average costs become constant at higher output levels: if costs are still falling at the maximum output shown, MES has not been reached.
- Always use specific figures from the table to support your assessment, rather than making general statements.
Common Mistakes
- Confusing MES with the minimum point of the short-run average cost (SRAC) curve: MES is a long-run concept, related to the LRAC curve.
- Stating that MES has been reached for Technology A because costs are almost constant at higher output levels, without noting the small fall between 4.0 and 10.0 million kwh. This would lose the second mark.
- Giving a generic definition of economies of scale instead of defining MES specifically, which would lose the first mark.
Things to Be Careful About
- Ensure your definition explicitly mentions that MES is the point where LRAC stops falling, as this is the key feature examiners look for.
- When assessing the data, refer to the exact output levels and cost figures from Table 1.1 to make your judgement clear and evidence-based.
Analyse, with the aid of a diagram, the likely impact of the change to EV on the labour market for workers producing ICE in southern Germany.
Answer
The shift from ICE to EV production will reduce demand for workers with skills in ICE manufacturing, as firms reallocate resources to EV production. These workers have occupation-specific skills that are no longer in demand, so they will experience structural (occupational) unemployment.
This fall in labour demand is shown by a leftward shift of the labour demand curve from D to D1. With an upward-sloping labour supply curve (S), the new equilibrium is at a lower wage (W1) and lower quantity of labour employed (L1), meaning higher unemployment for ICE production workers in southern Germany. Workers will require retraining to gain skills relevant to EV production to re-enter the labour market.
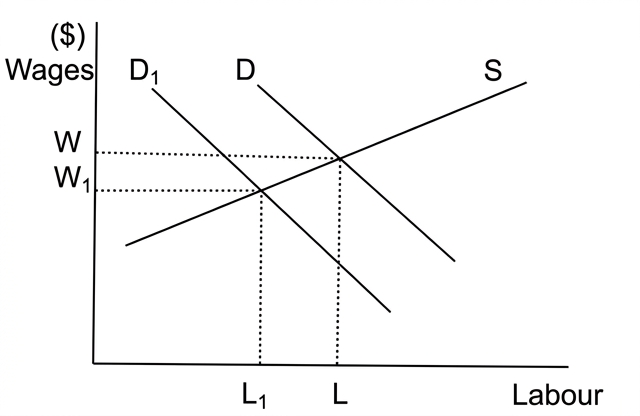
The switch to EV causes a leftward shift in demand for ICE labour, leading to lower wages (W1), lower employment (L1) and structural unemployment for workers in southern Germany, who will need retraining for EV sector jobs.
Background Concept
The demand for labour is a derived demand, meaning it depends on the demand for the goods and services that labour produces. When demand for a product falls, demand for the labour used to produce it also falls. Labour demand is determined by the marginal revenue product (MRP) of labour: if workers become less productive or the revenue from their output falls, demand for them decreases.
Structural unemployment is a type of disequilibrium unemployment that occurs when there is a mismatch between the skills of workers and the skills demanded by employers, often due to technological change or sectoral shifts in the economy. Unlike cyclical unemployment, it persists even when the economy is at full employment, as workers' skills are no longer relevant to available jobs.
The labour market diagram shows the equilibrium wage and employment level where the demand for labour (D) equals the supply of labour (S). A leftward shift in the demand curve (from D to D1) represents a fall in demand for labour, leading to a lower equilibrium wage and lower employment, and thus higher unemployment.
Understanding the Question
This 6-mark question asks you to analyse the impact of the switch from ICE to EV cars on the labour market for workers producing ICE vehicles in southern Germany, using a diagram. The extract notes that these workers are highly skilled mechanical engineers concentrated in southern Germany, and the shift to EV will make their skills obsolete. You need to explain the impact on wages, employment and the type of unemployment these workers face, and use a labour market diagram to illustrate the effect.
Approach
First, identify that the fall in demand for ICE cars reduces demand for the labour that produces them, leading to structural unemployment. Then, explain that this fall in labour demand shifts the labour demand curve leftward. Use a demand and supply diagram for the labour market to show the impact on the equilibrium wage and employment level. Finally, note that workers will need retraining to address the skill mismatch and find new jobs in the EV sector. Ensure you label all axes and curves in the diagram, as these are awarded separate marks.
Step-by-Step Reasoning
- Identify the type of unemployment (1 mark): The workers affected are highly skilled mechanical engineers with skills specific to ICE production. As demand for ICE cars falls, their skills are no longer in demand, so they face structural (occupational) unemployment, which arises from a mismatch between workers' skills and the skills required by available jobs.
- Fall in labour demand (1 mark): The switch to EV reduces firms' demand for ICE production labour, as firms reallocate capital and labour to EV manufacturing. This puts downward pressure on wages in the ICE sector, as firms have less need for these workers.
- Need for retraining (1 mark): To re-enter the labour market, these workers will need to acquire new skills relevant to EV production (e.g. battery technology, electric motor manufacturing) through retraining programmes.
- Diagram: shift in demand (1 mark): Draw a labour market diagram with wages on the vertical axis and labour on the horizontal axis. Draw an upward-sloping supply curve (S) and initial downward-sloping demand curve (D). Show a leftward shift of the demand curve to D1, representing the fall in demand for ICE labour.
- Diagram: impact on equilibrium (1 mark): Show that the new intersection of D1 and S is at a lower wage (W1) and lower quantity of labour (L1) than the original equilibrium (W, L), illustrating the fall in wages and employment, and rise in unemployment.
- Diagram: axes and labels (1 mark): Ensure both axes are clearly labelled ("Wages ($)" and "Labour"), and all curves (S, D, D1) and equilibrium values (W, W1, L, L1) are clearly marked, as these are awarded individual marks.
Key Takeaways
- Labour demand is a derived demand: it depends on the demand for the good that labour produces. A fall in demand for ICE cars reduces demand for the labour that makes them.
- Structural unemployment arises from skill mismatches, often caused by technological change or sectoral shifts, and is distinct from other types of unemployment such as cyclical or frictional.
- When a question requires a diagram, you must label all axes, curves and equilibrium points clearly, as these are often awarded separate marks.
- Always explain what the diagram shows in the surrounding prose, as an unexplained diagram will not gain full marks.
Common Mistakes
- Identifying the unemployment as cyclical or frictional, rather than structural. Cyclical unemployment arises from a fall in AD, while frictional unemployment is short-term unemployment between jobs. This would lose the first mark.
- Drawing a shift in the supply of labour instead of demand, or a rightward shift instead of leftward. This would lose the diagram marks.
- Forgetting to label the axes or curves in the diagram, which would lose the final diagram mark.
- Not linking the fall in demand to the specific context of ICE production workers, instead giving a generic explanation of labour demand shifts.
Things to Be Careful About
- Ensure the diagram is a labour market diagram, not a product market diagram, with wages on the vertical axis and labour on the horizontal axis.
- Explicitly state that the demand curve shifts leftward, not rightward, as demand for ICE labour is falling.
- Link the diagram to the context: explain that the fall in employment is specifically for ICE production workers in southern Germany, not all workers in the economy.
Evaluate the likely macroeconomic effects of the switch to EV for both Saudi Arabia and Singapore.
Answer
Effects for Saudi Arabia
Saudi Arabia relies on oil exports for 45% of its GNI. The switch to EV will reduce global demand for oil, lowering export revenue. This reduces the value of exports (X) in the balance of payments current account, worsening the trade balance (X - M falls). Lower export revenue reduces aggregate demand (AD), leading to a fall in real output and employment in the oil sector. The government may increase government spending (G) to offset the fall in AD and support output, or restrict oil supply to maintain prices, which could keep export revenue stable but would reduce output further if demand for oil is price inelastic.
Effects for Singapore
Singapore charges an indirect tax on petrol, which forms part of its general government revenue. The switch to EV will reduce petrol consumption, lowering tax revenue from this source. This may force the government to reduce spending, worsening AD and output, or increase taxes on other goods or income to maintain revenue, which could reduce consumer spending and investment. This could lead to a budget deficit if spending is not cut or alternative revenue is not found.
Evaluation
The severity of these effects depends on the speed of the EV transition: a rapid switch from 2030 will cause more severe short-run disruption, while a gradual transition allows more time for adjustment. For Saudi Arabia, the impact also depends on its ability to diversify its economy away from oil, developing alternative export industries such as renewable energy or tourism to replace lost oil revenue. For Singapore, the effect depends on whether electricity used to power EVs is generated from domestic sources rather than imported fossil fuels: if so, lower petrol tax revenue will be offset by reduced spending on energy imports, improving the current account.
Conclusion
The macroeconomic effects of the EV switch are likely to be more severe for Saudi Arabia in the short run, as it is heavily dependent on oil exports for national income, while Singapore has more flexibility to adjust its tax system and reduce import dependency. However, both economies can mitigate negative effects through policy adjustments and economic diversification over time.
The EV switch will have more severe short-run negative macroeconomic effects for Saudi Arabia due to its heavy reliance on oil export revenue, while Singapore can better mitigate impacts through tax system adjustments; both economies can reduce long-run harm through diversification and alternative energy adoption.
Background Concept
Macroeconomic effects of sectoral change are analysed using the aggregate demand (AD) framework and balance of payments accounting. Aggregate demand is the total demand for goods and services in an economy, calculated as AD = C + I + G + (X - M), where X is export revenue and M is import spending. A fall in export revenue reduces AD, leading to lower real output and employment, unless offset by increases in other components of AD (e.g. government spending).
Government revenue from indirect taxes (such as petrol taxes) is a component of the government budget. A fall in tax revenue may force the government to run a budget deficit (if spending exceeds revenue) or implement austerity measures (cutting spending or raising other taxes), both of which have further effects on AD and economic welfare.
The balance of payments current account records trade in goods and services, with export revenue generating a credit and import spending a debit. A fall in export revenue worsens the current account balance, which can lead to a depreciation of the exchange rate, higher inflation, and lower national income if the economy is highly dependent on exports.
Understanding the Question
This 8-mark evaluative question asks you to assess the likely macroeconomic effects of the switch from ICE to EV cars for two specific economies: Saudi Arabia, which relies on oil exports for 45% of its GNI, and Singapore, which raises revenue from indirect taxes on petrol. You need to analyse the effects for each country separately, then provide evaluation comments that consider the magnitude and likelihood of these effects, before reaching a justified conclusion. The question is worth 8 marks, with 3 marks for effects on Saudi Arabia, 3 marks for effects on Singapore, and 2 marks for evaluation.
Approach
First, analyse the effects on Saudi Arabia: reduced oil demand lowers export revenue, worsens the current account, reduces AD, output and employment, and may force government policy responses. Then, analyse the effects on Singapore: reduced petrol consumption lowers tax revenue, which may force spending cuts or tax rises, reducing AD and potentially leading to a budget deficit. For evaluation, identify two distinct criteria that affect the magnitude of the effects for each country: for Saudi Arabia, the ability to diversify its economy away from oil; for Singapore, the source of electricity used for EVs (which affects import bills and offsets lost tax revenue). Also note that the speed of the transition will affect the severity of short-run disruption. Finally, reach a justified conclusion comparing the effects on the two countries.
Step-by-Step Reasoning
Effects on Saudi Arabia (3 marks)
- Fall in export revenue (1 mark): Saudi Arabia relies on oil exports for 45% of its GNI. The switch to EV reduces global demand for oil, lowering the value of oil exports (X). This reduces the current account surplus (or worsens a deficit), as exports are a credit in the balance of payments.
- Fall in AD and output (1 mark): Lower export revenue reduces the (X - M) component of AD, leading to a fall in AD. This reduces real output and employment in the oil sector and related industries, potentially causing a rise in unemployment.
- Government policy responses (1 mark): The government may increase government spending (G) to offset the fall in AD and support output, or restrict oil supply (e.g. via OPEC agreements) to maintain oil prices, which could keep export revenue stable but would reduce output further if demand for oil is price inelastic.
Effects on Singapore (3 marks)
- Fall in tax revenue (1 mark): Singapore charges S$0.41 per litre indirect tax on petrol, which makes up part of its general government revenue. The switch to EV reduces petrol consumption, lowering tax receipts from this source.
- Impact on AD and government spending (1 mark): Lower tax revenue may force the government to cut spending, which reduces AD and output, or raise taxes on other goods or income to maintain revenue, which reduces consumer spending and investment, further lowering AD.
- Budget deficit (1 mark): If the government does not cut spending or find alternative revenue sources, the fall in tax receipts will lead to a budget deficit, where government spending exceeds revenue.
Evaluation (2 marks)
- Speed of transition: A rapid transition to EV by 2030 will cause more severe short-run disruption, as firms and workers have less time to adjust. A gradual transition allows more time for Saudi Arabia to diversify its economy and Singapore to adjust its tax system, reducing negative effects.
- Saudi Arabia's economic diversification (1 mark): The impact on Saudi Arabia depends on its ability to develop alternative export industries (such as renewable energy, tourism or manufacturing) to replace lost oil revenue. If diversification is successful, the negative effects on AD and output will be mitigated.
- Singapore's energy source for EVs (1 mark): The impact on Singapore depends on whether electricity used to power EVs is generated from domestic sources rather than imported fossil fuels. If so, lower petrol tax revenue will be offset by reduced spending on energy imports, improving the current account and reducing the negative fiscal impact.
Conclusion
The EV switch will have more severe short-run negative effects for Saudi Arabia, as its economy is heavily dependent on oil exports for national income, leaving it with limited immediate alternatives. Singapore has more flexibility to adjust its tax system and reduce import dependency, so it can better mitigate negative effects. However, both economies can reduce long-run harm through policy adjustments and diversification.
Key Takeaways
- The demand for a factor of production (like labour or natural resources) is derived from the demand for the final good it produces: a fall in demand for ICE cars reduces demand for oil and ICE production labour.
- Government revenue from indirect taxes is linked to consumption of the taxed good: if consumption of petrol falls due to EV adoption, tax revenue from petrol will fall.
- Evaluation of macroeconomic effects should use explicit criteria, such as the speed of adjustment, availability of alternative industries, or policy responses, to judge the magnitude of the impact.
- When comparing two economies, always consider their different structural characteristics (e.g. Saudi Arabia's reliance on oil exports vs Singapore's diversified trade-based economy) to explain differences in impact.
Common Mistakes
- Only analysing the effects for one country, ignoring the second. This would lose up to 3 marks for the missing country's analysis.
- Making one-sided evaluation comments, or using the same evaluative point for both countries. The mark scheme requires distinct evaluation points for each country to gain the full 2 evaluation marks.
- Ending with a summary of both sides instead of a justified conclusion that answers the specific question (comparing the effects on the two economies).
- Confusing the impact on the current account with the financial account: export revenue affects the current account, not the financial account.
- Assuming that lower petrol consumption will automatically lead to lower AD, without considering government policy responses (e.g. increasing spending or cutting other taxes) that could offset the effect.
Things to Be Careful About
- Always use the specific data from the extract for each country: Saudi Arabia's 45% GNI from oil exports, Singapore's S$0.41 per litre petrol tax (17% of price), to make your analysis evidence-based.
- Distinguish between short-run and long-run effects: short-run effects are more severe as firms and workers have less time to adjust, while long-run effects can be mitigated by diversification and policy changes.
- Ensure your evaluation comments are distinct for each country, as required by the mark scheme, to gain the full 2 evaluation marks.
Market failure exists in all economies.
Evaluate, with the aid of a diagram(s), the meaning of market failure and two policies a government may use to correct market failure.
Introduction
Market failure occurs when the free market fails to allocate resources efficiently, leading to a loss of welfare. One common cause is externalities, where the social costs or benefits differ from private costs or benefits. This essay will evaluate the meaning of market failure using the example of externalities, and evaluate two government policies – an indirect tax and a subsidy – to correct such failures.
Market failure: negative externality
A negative externality of production occurs when a firm's production imposes external costs on society, such as pollution. The marginal social cost (MSC) exceeds the marginal private cost (MPC). The market equilibrium, where demand equals MPC, results in a quantity Qm that is greater than the socially optimal quantity Qs, where demand equals MSC. This overproduction creates a deadweight welfare loss, representing allocative inefficiency.
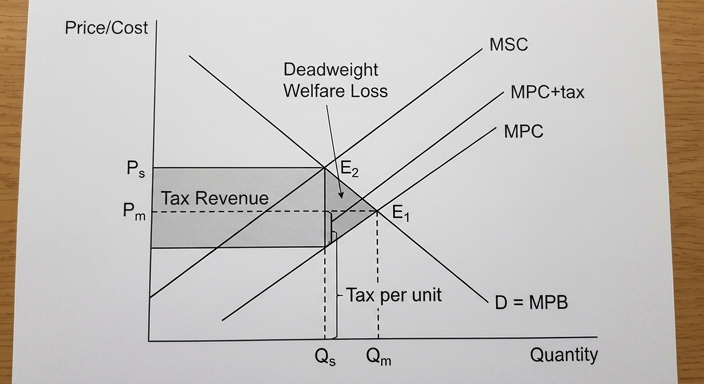
The diagram shows the MSC curve above the MPC curve. At Qm, the social cost of the last unit exceeds the private benefit, so resources are over-allocated to this good. This is the meaning of market failure: the price mechanism fails to signal the true social cost.
Policy 1: Indirect tax
To correct this, the government can impose an indirect tax equal to the external cost (MSC – MPC). This shifts the MPC curve upward to MPC + tax, which aligns with MSC. The new equilibrium occurs at Qs, the efficient output. The tax internalises the externality, making producers pay the full social cost, and reduces the deadweight loss.
Market failure: positive externality
A positive externality of consumption exists when consuming a good, such as education, provides external benefits (e.g., a more productive workforce). The marginal social benefit (MSB) exceeds the marginal private benefit (MPB). The market equilibrium, where supply equals MPB, results in a quantity Qm less than the socially optimal quantity Qs, where supply equals MSB. This underconsumption also creates a deadweight loss.
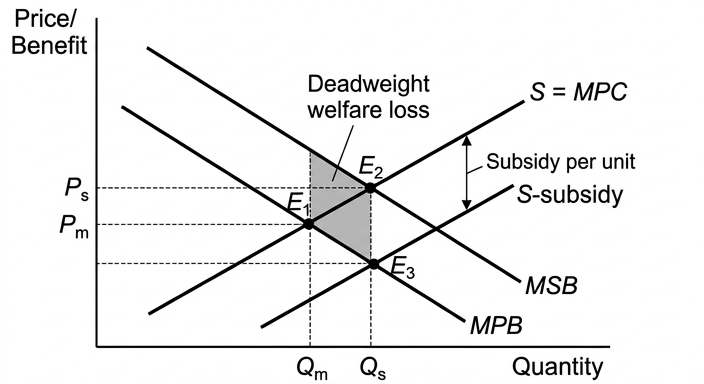
The diagram shows the MSB curve above the MPB curve. At Qm, the social benefit of the last unit exceeds the private cost, so resources are under-allocated. This is another instance of market failure.
Policy 2: Subsidy
To correct positive externalities, the government can provide a subsidy to producers (or consumers) equal to the external benefit (MSB – MPB). This shifts the supply curve downward by the amount of subsidy, reducing the price to consumers and increasing quantity to Qs. The subsidy encourages consumption to the socially optimal level, reducing deadweight loss.
Evaluation
Both policies aim to align private incentives with social welfare, but they face limitations.
- Measurement difficulty: The exact value of the externality is hard to quantify; governments may over- or under-correct, leading to continued inefficiency or new distortions.
- Cost: Subsidies require government spending, which has an opportunity cost (e.g., higher taxes elsewhere).
- Effectiveness depends on elasticities: A tax is more effective in reducing output if demand is elastic; a subsidy is more effective in increasing consumption if supply is elastic.
- Government failure: Policies may be influenced by political motives, or may create unintended consequences, such as black markets.
- Time lags: The impact of policies may take time to materialise, especially if production processes are long-term.
- Other policies: Alternatives like regulation or tradable permits may be more effective in some cases.
Conclusion
Market failure, as illustrated by externalities, leads to allocative inefficiency. Indirect taxes and subsidies can theoretically correct this by internalising externalities, but their effectiveness depends on accurate measurement, market conditions, and the absence of government failure. In many cases, a combination of market-based policies and regulation is likely to be most effective, but the net benefit of intervention is not guaranteed, and a case-by-case analysis is necessary.
Government intervention through taxes and subsidies can correct market failure caused by externalities, but the outcomes are uncertain due to measurement difficulties and government failure; a combination of policies is often required.
Background Concept
Market failure occurs when the free market does not allocate resources efficiently, meaning that the quantity produced or consumed of a good is not at the point where marginal social benefit (MSB) equals marginal social cost (MSC). Allocative efficiency requires MSB = MSC. One important cause of market failure is externalities – external costs or benefits that affect third parties not involved in the transaction.
- Negative externality of production: The firm ignores external costs (e.g., pollution), so its marginal private cost (MPC) is less than the marginal social cost (MSC). The market overproduces the good relative to the efficient level, creating a deadweight loss.
- Positive externality of consumption: Consumers ignore external benefits (e.g., education improves society), so marginal private benefit (MPB) is less than MSB. The market underproduces/underconsumes the good, also creating a deadweight loss.
Government intervention can attempt to correct these failures by internalising the externality, i.e., making private agents face the true social costs or benefits.
Understanding the Question
The question asks: "Evaluate, with the aid of a diagram(s), the meaning of market failure and two policies a government may use to correct market failure." This is a 20-mark essay on Paper 4, marked using level descriptors for AO1+AO2 (up to 14 marks) and AO3 (up to 6 marks). The command word "evaluate" requires a two-sided analysis and a justified conclusion. The top band for AO1+AO2 demands detailed knowledge, fully developed explanations, accurate and fully explained diagrams, and a well-organised response. The top band for AO3 requires a justified conclusion that addresses the specific requirements of the question, with developed evaluative comments.
You must:
- Explain the meaning of market failure (likely via externalities, though other forms could be used).
- Use at least one diagram to illustrate market failure.
- Explain two policies (e.g., tax and subsidy) and how they correct the failure.
- Evaluate the policies, discussing limitations and potential government failure.
- Reach a justified conclusion.
Approach
- Define market failure and introduce externalities as an example.
- Explain negative externality of production using a diagram: show MSC > MPC, market equilibrium Qm > efficient Qs, deadweight loss. This illustrates the meaning of market failure.
- Policy 1: Indirect tax – show on the diagram how a tax equal to the external cost shifts MPC to MPC+tax = MSC, restoring efficiency. Explain how it works.
- Explain positive externality of consumption using a second diagram: show MSB > MPB, market equilibrium Qm < efficient Qs, deadweight loss. This is another example of market failure.
- Policy 2: Subsidy – show on the diagram how a subsidy equal to the external benefit shifts supply down, increasing quantity to Qs.
- Evaluate both policies: discuss measurement difficulties, cost, elasticity, government failure, time lags, and alternatives.
- Conclusion – weigh the net benefit of intervention, acknowledging that while policies can improve efficiency, their success is not guaranteed and depends on the context.
Step-by-Step Reasoning
Step 1: Define market failure. Start by defining allocative efficiency: MSB = MSC. Market failure occurs when this condition is not met, often due to externalities, public goods, or information failures. For this answer, focus on externalities.
Step 2: Negative externality diagram. Draw a graph with price/cost on the vertical axis, quantity on the horizontal axis. Draw a downward-sloping demand curve (D) representing MPB (since in a competitive market, demand reflects private benefit). Draw an upward-sloping supply curve (MPC) representing private cost. The market equilibrium is where D = MPC, at point E1, with price P1 and quantity Qm. Then draw a second upward-sloping curve MSC above MPC, reflecting the external cost. The efficient equilibrium is where D = MSC, at point E2, with price P2 and quantity Qs. The triangle between Qs and Qm, bounded by D and MSC, is the deadweight welfare loss. Explain that at Qm, MSC > D, meaning the social cost of the last unit exceeds the private benefit, so too many resources are allocated to this good. This is a market failure: the price mechanism does not account for the external cost, so the market overproduces.
Step 3: Policy 1 – Indirect tax. To correct the negative externality, the government can impose a per-unit tax equal to the external cost (the vertical distance between MPC and MSC). This tax shifts the supply curve (MPC) upward by the amount of the tax, to MPC+tax, which coincides with MSC. The new equilibrium is at Qs, the efficient quantity. The tax internalises the externality: producers now pay the full social cost, and consumers face a higher price, reducing demand. The deadweight loss is eliminated. The tax revenue is the rectangle between the old and new supply curves at Qs.
Step 4: Positive externality diagram. Draw a new graph. The vertical axis is price/benefit, horizontal axis quantity. Draw a downward-sloping MPB curve (private benefit) and a downward-sloping MSB curve above it. Draw an upward-sloping supply curve (MPC = S). The market equilibrium is where S = MPB, at Qm. The efficient equilibrium is where S = MSB, at Qs. The triangle between Qm and Qs, bounded by MSB and S, is the deadweight loss from underconsumption. Explain that at Qm, MSB > MPC, so the social benefit of the last unit exceeds the private cost, meaning too few resources are allocated. This is another market failure.
Step 5: Policy 2 – Subsidy. To correct the positive externality, the government can provide a per-unit subsidy to producers (or consumers) equal to the external benefit (the vertical distance between MPB and MSB). This shifts the supply curve downward by the subsidy amount, to S – subsidy. The new equilibrium is at Qs, the efficient quantity. The subsidy lowers the price consumers pay and increases the quantity consumed to the socially optimal level. The deadweight loss is eliminated. The cost to the government is the subsidy multiplied by Qs.
Step 6: Evaluation. Now critically assess both policies.
- Measurement problem: To set the tax or subsidy at the correct level, the government must know the exact value of the external cost or benefit. This is extremely difficult; if the tax is too low, the externality persists; if too high, it may cause overcorrection.
- Cost of subsidy: Subsidies require government expenditure, which must be financed by taxes (distortionary) or borrowing, incurring opportunity cost.
- Elasticity: The effectiveness of a tax depends on the price elasticity of demand. If demand is inelastic, the tax may not reduce output much; similarly, a subsidy may be less effective if supply is inelastic.
- Government failure: Intervention may be captured by interest groups, or may create unintended consequences (e.g., black markets for heavily taxed goods).
- Time lags: The impact of policies may be delayed, especially if production processes are long-term.
- Alternatives: Other policies such as regulation, tradable permits, or direct provision may be more effective in certain contexts.
Step 7: Conclusion. Weigh the arguments. On one hand, Pigouvian taxes and subsidies are theoretically elegant and can correct market failure. On the other hand, practical difficulties limit their effectiveness. A justified conclusion might state that while these policies can improve efficiency, their net benefit depends on the accuracy of measurement, market conditions, and the absence of government failure. Often a combination of policies (e.g., tax + regulation) is more effective. The answer should clearly state a judgement, not just list pros and cons.
Key Takeaways
- Market failure defined as failure to achieve allocative efficiency (MSB ≠ MSC).
- Externalities cause divergence between private and social costs/benefits.
- Diagrams must be fully labelled and explained; show deadweight loss.
- Pigouvian tax and subsidy are market-based policies to internalise externalities.
- Evaluation must consider measurement, elasticity, government failure, and alternatives.
- A justified conclusion is essential for top marks.
Common Mistakes
- Omitting diagram(s) – The question explicitly requires diagrams; omitting them caps the mark at Level 2 for AO1+AO2.
- Drawing but not explaining the diagram – The diagram must be integrated into the text and explained.
- One-sided evaluation – Only discussing advantages without limitations loses all AO3 marks.
- No conclusion – Failing to provide a conclusion prevents reaching the top band for AO3.
- Vague conclusion – A conclusion that merely restates both sides without a judgement is insufficient.
- Mislabeling – Axes, curves, and equilibrium points must be clearly labelled.
- Confusing shifts – Ensure the tax shifts the supply curve, not demand; the subsidy shifts supply down.
- Ignoring measurement difficulty – The mark scheme highlights this as a key evaluative point.
Things to Be Careful About
- Use correct terminology: MSC, MPC, MSB, MPB, deadweight loss, allocative efficiency.
- Ensure the diagram accurately reflects the theory: MSC above MPC for negative externality; MSB above MPB for positive externality.
- Show the tax as shifting the supply curve upward; the subsidy as shifting it downward.
- Label all axes, curves, and points (P1, Q1, P2, Q2, etc.).
- The evaluation should be developed, not just a list. For each point, explain why it matters.
- The conclusion must be specific to the question: evaluate the overall effectiveness of the two policies in correcting market failure.
- The answer should be well-organised and coherent, with clear paragraphs and logical flow.
By following these guidelines, you can produce a response that meets the top band descriptors.
Evaluate, with the aid of a diagram(s), whether excess profit (supernormal profit) is always necessary for the continued existence of firms in perfect competition and monopoly.
Introduction
Perfect competition (PC) is a market structure with many firms, identical products, perfect information, and free entry and exit. Monopoly is a market structure with a single firm, high barriers to entry, and no close substitutes. Supernormal profit (SNP) is profit above normal profit, which is the minimum reward required to keep a firm in business. This essay evaluates whether SNP is always necessary for the continued existence of firms in these two structures.
Perfect Competition and Supernormal Profit
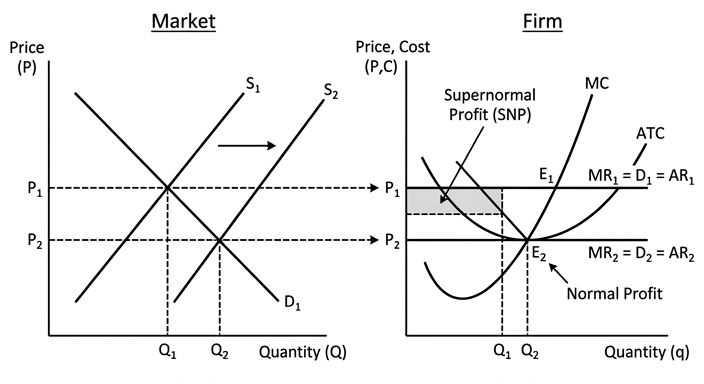
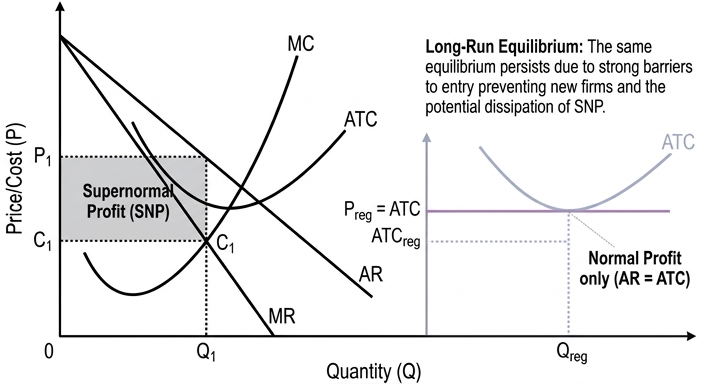
In the short run, a PC firm may earn SNP if market price exceeds average total cost (ATC). This occurs when demand increases, raising price above the firm's minimum ATC. The firm produces where MR = MC, and SNP is the area between price and ATC at that output. However, SNP attracts new entrants because entry is free. The market supply curve shifts right, lowering price until firms earn only normal profit (P = min ATC) in the long run. Therefore, in PC, SNP is not necessary for continued existence; firms survive on normal profit in the long run.
Monopoly and Supernormal Profit
A monopoly, protected by barriers to entry, can earn SNP in both the short run and the long run by producing where MR = MC and charging a price above ATC. The SNP is represented by the area between price and ATC at the profit-maximising output. This SNP can be used for investment, R&D, and dynamic efficiency, which may enhance the firm's long-term survival. However, SNP is not always necessary for the monopoly's continued existence. A natural monopoly, for example, may earn only normal profit if it is regulated or if demand is low relative to costs. Additionally, a monopoly may choose to pursue sales revenue maximisation or other objectives that result in normal profit. Therefore, SNP is not a prerequisite for survival; as long as the firm covers its ATC, it can continue to exist. Furthermore, the ability to earn SNP depends on successful profit maximisation; if the firm is X-inefficient, it may earn only normal profit.
Evaluation
The necessity of SNP for firm survival differs between the two structures. In PC, the freedom of entry ensures that SNP is eroded in the long run, so firms survive on normal profit. In monopoly, the absence of competition allows SNP to persist, but it is not strictly necessary for existence; normal profit is sufficient. However, SNP can be important for enabling the monopoly to invest in cost-reducing technology, which may improve its long-run viability. Moreover, the existence of a natural monopoly shows that a firm can survive without SNP if it is a single provider at minimum efficient scale. The context of regulation also matters: a regulated monopoly may be forced to price at average cost, earning only normal profit, yet it continues to exist. Therefore, SNP is not always necessary; normal profit is the essential condition for survival.
Conclusion
Supernormal profit is not always necessary for the continued existence of firms. In perfect competition, firms earn only normal profit in the long run and continue to exist. In monopoly, while SNP is often earned, it is not a requirement for survival; firms can persist on normal profit alone. The key is that total revenue covers total cost, including normal profit. Thus, the statement is incorrect: SNP is not always necessary.
Supernormal profit is not always necessary for the continued existence of firms; normal profit is sufficient for survival in both perfect competition and monopoly, though supernormal profit may provide additional resources for investment.
Background Concept
This question tests the theory of market structures, specifically perfect competition and monopoly, and the role of profit. Normal profit is the minimum return required to keep a firm in the industry; it is included in the firm's cost curves as part of ATC. Supernormal profit (SNP) is any profit above normal profit. In perfect competition, free entry and exit ensure that in the long run, firms earn only normal profit (P = min ATC). In monopoly, barriers to entry allow SNP to persist in the long run. The question asks whether SNP is always necessary for continued existence, i.e., can a firm survive without SNP?
Understanding the Question
The question is: "Evaluate, with the aid of a diagram(s), whether excess profit (supernormal profit) is always necessary for the continued existence of firms in perfect competition and monopoly." The command word "Evaluate" requires a two-sided analysis and a justified conclusion. The statement to evaluate is that SNP is always necessary for survival. You need to argue that it is not always necessary, and provide reasons. The question also specifies "with the aid of a diagram(s)", so diagrams are required and must be explained. The answer should cover both market structures separately, and then evaluate the necessity.
Approach
First, define key terms. Then, analyse the short-run and long-run positions of a perfectly competitive firm: show that in the short run SNP can exist, but in the long run it is eliminated, yet firms continue to exist. For monopoly, show that SNP can persist in the long run, but it is not a requirement for existence; a monopoly can survive on normal profit if it is regulated or if it chooses alternative objectives. The evaluation should weigh the arguments: in perfect competition, SNP is clearly not necessary; in monopoly, it is not necessary but can be beneficial. The conclusion should be that SNP is not always necessary; normal profit is the essential condition.
Step-by-Step Reasoning
-
Definitions: Normal profit is the opportunity cost of the entrepreneur; it is included in ATC. Supernormal profit is profit above normal profit. Perfect competition: many firms, identical products, perfect information, free entry/exit. Monopoly: single firm, barriers to entry, no close substitutes.
-
Perfect Competition: In the short run, if demand increases, market price rises above the firm's ATC. The firm makes SNP (area (P-ATC) x Q). This SNP signals to new firms to enter the industry. With free entry, the market supply curve shifts right, reducing price. This process continues until price equals minimum ATC, and firms earn only normal profit. Firms continue to exist even though SNP is zero. Therefore, SNP is not necessary for survival.
-
Diagram for Perfect Competition: Show the market (left panel) with supply and demand shifting from SR to LR. The firm (right panel) shows MC, ATC, and a horizontal MR curve. In the SR, MR = P1 > ATC, so SNP rectangle. In the LR, MR = P2 = min ATC, so only normal profit. The diagram should be fully explained in the text.
-
Monopoly: The monopolist faces a downward-sloping demand curve. It produces where MR = MC and charges a price above MC. Because of barriers to entry, this SNP can be maintained in the long run. However, SNP is not a necessary condition for survival: as long as price covers ATC, the firm earns at least normal profit and can continue. A natural monopoly may have economies of scale such that ATC is falling; if regulated to price at ATC, it earns only normal profit. Also, a monopoly may choose sales maximisation or other objectives, which may result in normal profit. Additionally, X-inefficiency may cause costs to be higher, reducing SNP. Thus, SNP is not always necessary.
-
Diagram for Monopoly: Show the monopolist's demand (AR), MR, MC, and ATC. The profit-maximising output is Q where MR = MC, price from AR is P, and ATC at that output is C. SNP is the rectangle (P-C) x Q. If the monopolist is regulated to price at ATC, the price would be lower and output higher, but normal profit is earned. The diagram should be explained.
-
Evaluation: Compare the two structures. In PC, the market mechanism ensures SNP is temporary; firms survive on normal profit. In monopoly, SNP can persist but is not essential. The benefit of SNP is that it can fund investment, leading to dynamic efficiency and lower costs over time, which may improve survival. However, if a monopoly does not earn SNP, it does not necessarily fail; it can continue if it covers costs. The question of "always necessary" is clearly false: normal profit is the necessary condition. The evaluative judgement should state that SNP is not always necessary, but it can be beneficial for innovation and long-term viability.
-
Conclusion: A justified conclusion that directly answers the question: SNP is not always necessary for the continued existence of firms; normal profit is sufficient. The statement is incorrect.
Key Takeaways
- Normal profit is the minimum for survival; supernormal profit is above that.
- In perfect competition, free entry eliminates SNP in the long run, but firms survive on normal profit.
- In monopoly, barriers to entry allow SNP, but it is not a requirement for existence; a monopoly can survive on normal profit.
- Diagrams are crucial: they must be fully labelled and explained in the text.
- Evaluation requires weighing arguments and reaching a justified conclusion.
Common Mistakes
- Confusing normal profit with zero profit: normal profit is a cost, so earning normal profit means the firm is covering all costs including opportunity cost.
- Thinking that in perfect competition, firms always earn zero profit in the SR: they can earn SNP in the SR.
- Forgetting to include the diagram or not explaining it: the question specifically requires "with the aid of a diagram(s)", so omitting it or not fully explaining it will lose marks.
- One-sided evaluation: the question asks to "evaluate whether... always necessary", so you must consider both sides: why it might be necessary (e.g., for investment) and why it is not. A one-sided answer cannot score top marks for evaluation.
- Not providing a conclusion: the top band requires a justified conclusion.
Things to Be Careful About
- Label all axes, curves, and equilibrium points in diagrams.
- Show the direction of shifts in the perfect competition diagram.
- Distinguish between short run and long run clearly.
- Use precise economic terminology: normal profit, supernormal profit, barriers to entry, profit maximisation.
- In the evaluation, mention specific scenarios: natural monopoly, regulation, alternative objectives.
- Ensure the conclusion directly addresses the question and is justified by the preceding analysis.
In 2022, many countries experienced a high rate of inflation caused by disruptions to the supply of goods and services arising from the Covid-19 pandemic and the conflict between Russia and Ukraine. In one country, the government cut taxes and the central bank raised interest rates.
Evaluate the likely impact of these policies on that government’s ability to control inflation.
Introduction
Inflation in 2022 was primarily cost-push, caused by supply disruptions shifting the short-run aggregate supply (SRAS) curve leftwards, raising the price level and reducing output. The government implemented two contradictory policies: a tax cut (expansionary fiscal policy) and an interest rate rise (contractionary monetary policy). This essay evaluates their combined impact on the government's ability to control inflation.
Analysis of Tax Cuts
A reduction in direct taxes (e.g., income tax) increases households' disposable income, raising consumption expenditure. Lower corporate taxes may increase retained profits, encouraging investment. Both effects shift the aggregate demand (AD) curve to the right. In the context of cost-push inflation, this further increases the price level, worsening inflation. The tax cut does not address the supply-side causes; it merely adds demand-pull pressure. The size of the effect depends on the marginal propensity to consume and the multiplier.
Analysis of Interest Rate Rises
Higher interest rates increase the cost of borrowing and the return on saving, reducing consumption and investment. This shifts the AD curve to the left, lowering the price level and reducing output. This policy directly counteracts the demand-pull element of inflation. However, it does not tackle the supply shortages; it may even exacerbate the output loss from the initial shock. The effectiveness depends on the interest elasticity of demand for credit and the speed of the monetary transmission mechanism.
Evaluation of Combined Impact
The two policies work in opposite directions on AD. The net effect on the price level is ambiguous: if the interest rate rise is large enough, it could offset the demand expansion from the tax cut, but this would likely cause a significant fall in output and employment. The policies are poorly targeted because the root cause is a supply shock. Neither policy increases aggregate supply; they only manage demand. Time lags reduce effectiveness: tax cuts may take months to affect spending, and interest rate changes affect investment with a lag. Expectations also matter: if households and firms expect inflation to persist, the tax cut may be saved rather than spent, weakening its impact. The opportunity cost of higher interest rates is lower growth and higher unemployment, conflicting with other macroeconomic objectives.
Conclusion
The combination of tax cuts and higher interest rates is contradictory and largely ineffective against cost-push inflation. The tax cuts exacerbate demand-pull pressure while the interest rate rises only partially offset this, and neither addresses the supply shortages. The government's ability to control inflation is severely limited unless complemented by supply-side policies that increase productivity or remove bottlenecks. Therefore, the net impact is likely to be a continued high inflation rate with lower output than otherwise.
The combination of tax cuts and higher interest rates is contradictory and largely ineffective against cost-push inflation; the tax cuts exacerbate demand-pull pressure while the interest rate rises only partially offset this, and neither addresses the supply shortages. The government's ability to control inflation is severely limited unless complemented by supply-side policies.
Background Concept
Inflation is a sustained increase in the general price level. It can be demand-pull (caused by excess aggregate demand) or cost-push (caused by rising costs of production, e.g., energy, raw materials, wages). The AD/AS model is used to analyse these: a leftward shift of SRAS raises the price level and reduces real output (stagflation). Fiscal policy (tax changes, government spending) and monetary policy (interest rates, money supply) are tools to manage aggregate demand. However, when inflation is cost-push, demand-side policies may be ineffective or even harmful because they do not address the supply constraints.
Understanding the Question
The question describes a real-world scenario: high inflation in 2022 due to supply disruptions from Covid-19 and the Russia-Ukraine conflict. The government cuts taxes (expansionary) and the central bank raises interest rates (contractionary). The task is to evaluate the likely impact of these policies on the government's ability to control inflation. The command word 'Evaluate' requires a two-sided analysis and a justified conclusion. The top band demands detailed knowledge, developed analysis (including a diagram), and evaluative comments that are reasoned and well-supported.
Approach
First, identify the type of inflation as cost-push. Then analyse each policy separately using AD/AS: tax cuts shift AD right (worsening inflation), interest rate rises shift AD left (reducing inflation). Then evaluate their combined effect: they are contradictory, so the net effect on inflation depends on the relative magnitudes. Also consider that neither policy addresses the supply shock. Evaluate using criteria: time lags, expectations, opportunity costs (output loss, unemployment). Conclude that the policies are poorly designed for cost-push inflation, limiting the government's ability to control inflation effectively.
Step-by-Step Reasoning
-
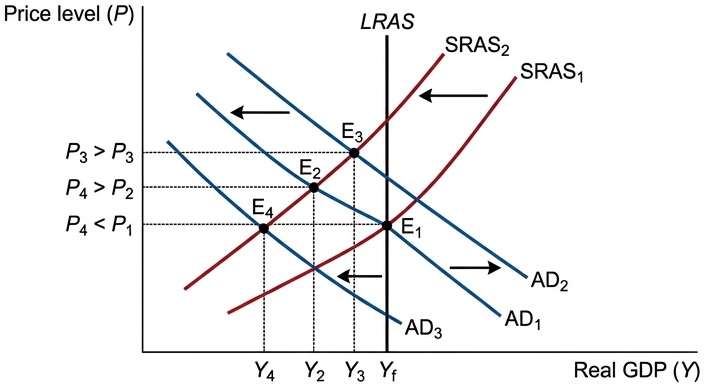
Initial situation: Draw AD/AS diagram. Start with AD1, SRAS1, LRAS at full employment output Yf. Supply shock shifts SRAS left to SRAS2. New equilibrium: price level P2 (higher), output Y2 (lower). This is stagflation.
-
Tax cut: Increases disposable income and investment, shifting AD right to AD2. Price level rises further to P3, output returns towards Yf. Inflation worsens. The tax cut is expansionary in a situation where demand is not the problem.
-
Interest rate rise: Reduces consumption and investment, shifting AD left to AD3. Price level falls to P4, but output falls to Y3 (below Y2). The interest rate rise partially offsets the demand expansion but at the cost of lower output.
-
Net effect: The price level after both policies (P4) is still above the initial P2? Actually, it depends on the magnitudes. If the interest rate rise is larger than the tax cut effect, P4 could be below P2, but output would be even lower. If the tax cut dominates, inflation remains high. The key point: neither policy increases SRAS, so the underlying cost-push pressure persists.
-
Evaluation: Time lags – tax cuts affect spending with a lag; interest rate changes affect investment with a lag. Expectations – if inflation is expected, workers demand higher wages, further shifting SRAS left. Opportunity cost – higher interest rates reduce investment and growth, conflicting with other objectives. The policies are contradictory, sending mixed signals to the economy. The government's ability to control inflation is weak because the tools are mismatched to the cause.
-
Conclusion: The policies are largely ineffective; the government should instead use supply-side policies (e.g., subsidies, deregulation) to increase aggregate supply.
Key Takeaways
- Cost-push inflation requires supply-side solutions; demand management alone is insufficient.
- Contradictory policies (expansionary fiscal + contractionary monetary) create uncertainty and may not achieve the desired outcome.
- AD/AS diagrams are essential for illustrating the effects of shocks and policies.
- Evaluation must consider time lags, expectations, and trade-offs with other objectives.
Common Mistakes
- Treating the inflation as purely demand-pull and ignoring the supply shock.
- One-sided analysis: only discussing the benefits of one policy without considering the other or the overall effect.
- Omitting the diagram or not explaining it fully.
- Failing to reach a justified conclusion; just listing pros and cons.
- Ignoring the contradictory nature of the two policies.
Things to Be Careful About
- Clearly label axes and curves in the diagram.
- Explain the direction of shifts and the resulting changes in price level and output.
- Use the extract's context (Covid-19, Russia-Ukraine) to ground the analysis.
- Ensure the conclusion directly answers the question about the government's ability to control inflation.
- Avoid vague statements; be specific about the conditions under which the policies might work or fail.
Evaluate the likely impact of globalisation on a low-income country’s standard of living.
Introduction
Globalisation refers to the increasing integration of economies through the flow of goods, services, capital, and labour across borders. A low-income country (LIC) typically has low GNI per capita, limited industrialisation, and high reliance on primary commodities. The standard of living encompasses both material well-being (real income per capita) and non-material aspects such as health, education, and environmental quality. This essay evaluates the likely impact of globalisation on an LIC’s standard of living.
Potential Benefits
Globalisation can increase investment and technology transfer, often through multinational corporations (MNCs). This boosts aggregate demand and aggregate supply, leading to economic growth. The multiplier effect amplifies the initial injection. Increased output can raise employment and incomes, improving material living standards. For example, foreign direct investment (FDI) in Bangladesh’s garment industry created jobs and raised incomes. Over time, the PPF shifts outward, indicating greater potential output.
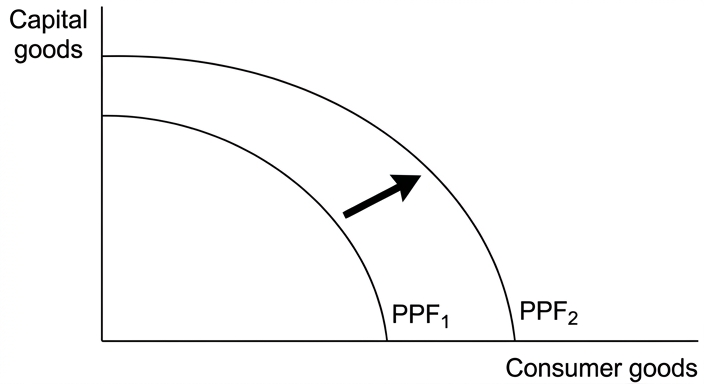
Diagram explanation: The PPF shifts from PPF1 to PPF2, representing an increase in the economy's capacity to produce both capital and consumer goods. This reflects the long-term growth enabled by globalisation-driven investment.
Furthermore, globalisation provides access to larger markets, enabling economies of scale and increased efficiency. It may also facilitate the transfer of knowledge and technology, improving productivity and potentially raising non-material living standards through better healthcare, education, and infrastructure funded by higher tax revenues.
Potential Drawbacks
However, globalisation can have negative effects. MNCs may exploit low labour standards, offering poor wages and conditions. The jobs created might be low-skilled, with higher-skilled roles filled by expatriates, limiting human capital development. Globalisation can also lead to the destruction of local industries unable to compete, causing unemployment and increased poverty. For example, local textile producers in some African countries were displaced by cheap imports.
Moreover, MNCs may engage in transfer pricing to avoid taxes, reducing government revenue available for public services. Environmental degradation from resource extraction can harm health and long-term sustainability. Income inequality may worsen, as gains accrue mainly to the owners of capital and skilled workers, while the poor are left behind. This can reduce the non-material standard of living despite GDP growth.
Evaluation
The net impact of globalisation on an LIC's standard of living is not uniform. It depends on the country's initial conditions, the nature of foreign investment, government policies, and the degree of regulation. Countries like Vietnam have successfully used globalisation to achieve rapid growth and poverty reduction, while others, such as some resource-rich African nations, have seen limited benefits and increased inequality. The key is whether the country can attract FDI that creates decent jobs, builds local capacity, and is managed to avoid exploitation. Strong institutions, education, and infrastructure are crucial to maximise benefits and mitigate harms.
Conclusion
Globalisation has the potential to significantly improve the material standard of living in a low-income country through economic growth, employment, and technology transfer. However, it also poses risks of exploitation, inequality, and environmental damage that can undermine non-material living standards. Therefore, the impact is likely to be positive overall only if the country implements appropriate policies to regulate MNCs, invest in human capital, and ensure equitable distribution of gains. Without such policies, globalisation may worsen living standards for the most vulnerable.
Globalisation has the potential to increase the standard of living in a low-income country, but the actual outcome depends on policy and institutional quality; the net effect is likely positive only if the country can regulate MNCs and invest in human capital.
Background Concept
Globalisation is the process of increasing economic integration between countries, driven by trade liberalisation, capital mobility, and technological change. It allows factors of production, especially capital and knowledge, to flow across borders. A low-income country (LIC) is typically characterised by low GNI per capita, a large agricultural sector, weak institutions, and limited infrastructure. The standard of living is a broad concept that includes material welfare (income and consumption) and non-material aspects (health, education, environment, freedom). Economists often use GDP per capita as a proxy, but recognise its limitations.
The impact of globalisation on an LIC operates through several channels: foreign direct investment (FDI), trade, technology transfer, and labour migration. These can affect aggregate demand (AD) and aggregate supply (AS), as well as the distribution of income. The production possibility frontier (PPF) illustrates the maximum output an economy can produce with given resources. An outward shift represents potential economic growth.
Understanding the Question
The question asks you to evaluate the likely impact of globalisation on a low-income country’s standard of living. The command word 'evaluate' requires you to consider both positive and negative effects, weigh them, and reach a justified conclusion. The standard of living includes both material and non-material aspects, so your answer must address both. The question is broad, so you need to select key channels: investment, employment, inequality, environment, cultural impacts. The mark scheme awards up to 14 marks for AO1/AO2 (knowledge and analysis) and 6 marks for AO3 (evaluation). The top band for AO1/AO2 demands detailed knowledge, fully developed explanations, and accurate use of diagrams. The top band for AO3 requires a justified conclusion and developed evaluative comments.
Approach
Structure your essay with an introduction defining key terms, then two main sections: potential benefits and potential drawbacks. Follow with an evaluation that weighs the two sides, considering context-dependency. Conclude with a justified judgement. Include a PPF diagram to illustrate potential long-run growth from globalisation. Use specific examples (e.g., Bangladesh, Vietnam, African countries) to support points. Ensure each point is developed: explain the chain of reasoning from globalisation to changes in living standards.
Step-by-Step Reasoning
- Introduction: Define globalisation, low-income country, and standard of living. State that the impact is complex and depends on various factors.
- Benefits:
- FDI increases investment, boosting AD through the multiplier. This raises output and employment, increasing incomes and material living standards.
- Technology transfer improves productivity, shifting AS and the PPF outward, leading to sustainable growth.
- Trade access allows economies of scale, reducing costs and increasing variety of goods, benefiting consumers.
- Tax revenues from MNCs can fund public services (health, education), improving non-material living standards.
- Example: Vietnam's integration into global supply chains lifted millions out of poverty.
- Drawbacks:
- MNCs may exploit low labour standards, paying low wages and providing poor conditions, harming workers' well-being.
- Local industries may be unable to compete, leading to deindustrialisation and unemployment.
- Transfer pricing reduces tax revenue, limiting ability to invest in public goods.
- Environmental degradation (e.g., mining, deforestation) harms health and long-term sustainability.
- Inequality may rise as benefits concentrate among the wealthy and skilled, while the poor are left behind, worsening non-material living standards.
- Example: In some African countries, resource extraction has led to environmental damage and limited local employment.
- Evaluation:
- The net impact is not predetermined. It depends on the nature of FDI (e.g., labour-intensive vs. capital-intensive), the country's institutional quality, and policies (e.g., labour laws, environmental regulations, tax enforcement).
- Countries with strong institutions and good governance (e.g., Vietnam) have managed to harness globalisation for broad-based growth, while those with weak institutions (e.g., some resource-rich states) have experienced negative effects.
- The time horizon matters: short-term gains from employment may be offset by long-term environmental costs or inequality.
- Non-material aspects: if globalisation leads to cultural homogenisation or social disruption, it may reduce well-being even if incomes rise.
- Conclusion:
- Globalisation has the potential to raise living standards in LICs, but the outcome is conditional. A justified conclusion: the impact is likely positive overall if the country adopts complementary policies (education, regulation, infrastructure) and if globalisation is managed carefully. Without such policies, the negative effects may dominate, especially for the poorest and for non-material aspects.
Key Takeaways
- Standard of living is multidimensional; exam answers must cover both material and non-material aspects.
- Globalisation’s impact is not automatically positive or negative; it depends on country-specific factors and policies.
- Use diagrams (PPF, AD/AS) to illustrate long-run growth.
- Provide specific examples to support arguments.
- For evaluation, weigh the two sides, consider context, and reach a justified conclusion.
Common Mistakes
- One-sided answer: only discussing benefits or only drawbacks loses evaluation marks. Must cover both.
- Vague conclusion: simply saying 'it depends' without specifying conditions or making a judgement. Must give a clear verdict based on analysis.
- No diagram: while not mandatory, a diagram (PPF or AD/AS) can strengthen analysis and is expected for top band.
- Ignoring non-material aspects: focusing only on GDP per capita neglects important dimensions of living standards.
- Generic examples: using 'some countries' without specifics. Use named examples like Bangladesh, Vietnam, or Nigeria.
- Lack of development: listing points without explaining the causal chain. Each point must be fully developed.
Things to Be Careful About
- Ensure definitions are precise and relevant.
- Label axes and curves clearly in any diagram.
- Explain the diagram in the text, not just present it.
- Use economic terminology correctly (e.g., multiplier, FDI, transfer pricing).
- Keep the essay focused on the low-income country context; don't stray into general globalisation discussion.
- The conclusion should be specific to the question: 'Evaluate the likely impact...' so the conclusion should state the likely impact, not just summarise.
- Avoid overgeneralisation: acknowledge that different LICs may experience different outcomes.