Economics 9708/32 — May/June 2024
Cambridge A-Level · A Level Multiple Choice · answer key with instant marking and worked solutions
Topics Externalities, Social Costs and Benefits · Market Structures · Growth and Survival of Firms · Government Policies to Correct Market Failure · Demand for and Supply of Labour · Money and Banking · +18 more
Tap an option under each question to check it — your score builds as you go.
The table shows the total utility gained by a consumer from the consumption of water.
| quantity consumed / bottles | total utility |
|---|---|
| 0 | 0 |
| 1 | 30 |
| 2 | 40 |
| 3 | 48 |
| 4 | 54 |
| 5 | 58 |
What can be concluded from this table?
Options
A Marginal utility increases as consumption increases.
B The consumer cannot switch expenditure to another product to increase total utility.
C The marginal utility of the 3rd unit is 8.
D The marginal utility of the 5th unit is 2.
Working
Marginal utility (MU) = change in total utility from consuming one additional unit.
MU of 1st unit = 30 - 0 = 30
MU of 2nd unit = 40 - 30 = 10
MU of 3rd unit = 48 - 40 = 8
MU of 4th unit = 54 - 48 = 6
MU of 5th unit = 58 - 54 = 4
Option C is correct: the marginal utility of the 3rd unit is 8.
Answer
C
C
Background Concept
Total utility (TU) is the total satisfaction a consumer gets from consuming a certain quantity of a good. Marginal utility (MU) is the additional satisfaction from consuming one more unit. It is calculated as the change in total utility divided by the change in quantity (usually 1 unit). The law of diminishing marginal utility states that as consumption of a good increases, the marginal utility eventually declines. This is a fundamental concept in consumer theory.
Understanding the Question
The question provides a table showing total utility from consuming different quantities of water (bottles). It asks what can be concluded from the table. The options are statements about marginal utility. The correct answer is that the marginal utility of the 3rd unit is 8. This requires calculating marginal utility from the total utility data.
Approach
Compute marginal utility for each quantity by subtracting the previous total utility from the current total utility. Then compare the computed values with the options. Also check if the pattern shows diminishing marginal utility, which rules out option A. Option B is not supported by the data as it requires knowledge of other products. Option D has incorrect calculation.
Step-by-Step Reasoning
- Calculate MU for each unit:
- Q1: MU = 30 - 0 = 30
- Q2: MU = 40 - 30 = 10
- Q3: MU = 48 - 40 = 8
- Q4: MU = 54 - 48 = 6
- Q5: MU = 58 - 54 = 4
- Observe that MU is decreasing (30, 10, 8, 6, 4). This is diminishing marginal utility.
- Option A: "Marginal utility increases as consumption increases." – false, it decreases. So A is incorrect.
- Option B: "The consumer cannot switch expenditure to another product to increase total utility." – the table only shows water consumption, no information about other products or prices. The consumer might be able to increase total utility by reallocating spending if another good gives higher marginal utility per unit of money. But we cannot conclude this from the table alone. So B is incorrect.
- Option C: "The marginal utility of the 3rd unit is 8." – correct, as calculated.
- Option D: "The marginal utility of the 5th unit is 2." – actually 4, so D is incorrect.
Key Takeaways
- How to derive marginal utility from total utility data.
- Understanding that total utility increases at a decreasing rate due to diminishing marginal utility.
- The importance of careful calculation and reading the table correctly.
- Not to over-interpret data; option B requires additional information not provided.
Common Mistakes
- Confusing total utility with marginal utility. For example, one might think MU of 3rd unit is the total utility at 3 units (48).
- Miscalculating marginal utility: subtracting the wrong way (e.g., 40 - 48 = -8).
- Assuming that because total utility is increasing, marginal utility is also increasing (it's diminishing).
- Not reading the table correctly: the 3rd unit corresponds to the change from 2 to 3 bottles.
- Selecting option D if they miscalculate: 58 - 54 = 4, not 2. So D is wrong.
Things to Be Careful About
- Always subtract the previous total utility from the current total utility to get marginal utility.
- Ensure you identify the correct unit: "3rd unit" means the third bottle, so the change from quantity 2 to quantity 3. The table shows total utility at quantity 2 and 3.
- Check all options before concluding; even if one looks correct, verify others to ensure no trick.
- For option B, avoid making assumptions beyond the data. The question asks what can be concluded from the table, so only statements that are directly supported by the data are valid.
A consumer has $100 to spend on two products, X and Y.
The budget line shows the different possible combinations of products X and Y that can be purchased when all the consumer’s income is spent.
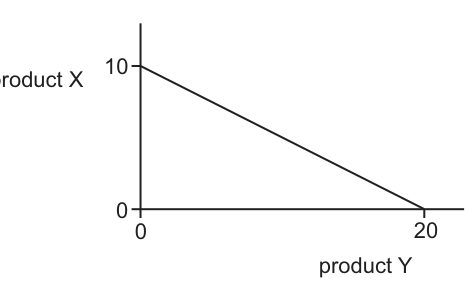
If the price of product Y increases to $10, what will be the maximum number of units of product X and product Y that the consumer can now purchase?
Options
| product X | product Y | |
|---|---|---|
| A | 5 | 10 |
| B | 5 | 20 |
| C | 10 | 10 |
| D | 20 | 10 |
Working
Income = $100.
From the budget line in Fig. 2.1:
- Maximum product X = 10 units, so Px = $100 / 10 = $10.
- Maximum product Y = 20 units, so original Py = $100 / 20 = $5.
If the price of Y increases to $10:
- Maximum product Y = $100 / $10 = 10 units.
- Maximum product X = $100 / $10 = 10 units (Px unchanged).
Answer
C
C
Background Concept
A budget line (or budget constraint) shows all combinations of two goods that a consumer can purchase given their income and the prices of the goods. The budget line equation is Px × Qx + Py × Qy = Income. The vertical intercept (where Qy = 0) equals Income / Px and represents the maximum quantity of the good on the vertical axis. The horizontal intercept (where Qx = 0) equals Income / Py and represents the maximum quantity of the good on the horizontal axis. When the price of one good changes, the budget line pivots (rotates) from the axis of the unchanged good.
Understanding the Question
The question gives a consumer's income as $100 and a budget line diagram where product X is on the vertical axis (maximum 10 units) and product Y is on the horizontal axis (maximum 20 units). The price of product Y then rises to $10. The task is to find the new maximum number of units of both products X and Y that can be purchased. This requires first recovering the original prices from the intercepts, then recalculating the intercepts after the price change.
Approach
- Calculate the original price of X using the vertical intercept: Px = Income / Max X.
- Calculate the original price of Y using the horizontal intercept: Py = Income / Max Y.
- Apply the new price of Y ($10) while keeping income and Px constant.
- Calculate the new maximum Y: Income / New Py.
- Calculate the maximum X: Income / Px (unchanged).
- Select the option matching these two values.
Step-by-Step Reasoning
- Income is $100.
- From the diagram, the vertical intercept is 10 units of X. Therefore, Px = $100 / 10 = $10 per unit.
- From the diagram, the horizontal intercept is 20 units of Y. Therefore, the original Py = $100 / 20 = $5 per unit.
- The price of Y increases to $10. The price of X remains $10, and income remains $100.
- New maximum Y = $100 / $10 = 10 units.
- New maximum X = $100 / $10 = 10 units.
- The consumer can now purchase a maximum of 10 units of X and 10 units of Y.
- This matches option C.
Key Takeaways
- Budget line intercepts reveal prices when income is known: Max quantity = Income / Price.
- A price increase rotates the budget line inward along the axis of the affected good, reducing the maximum quantity of that good.
- The maximum quantity of the other good (whose price is unchanged) remains the same.
Common Mistakes
- Reading the axes incorrectly: product X is on the vertical axis and product Y on the horizontal axis. Swapping them gives wrong prices.
- Assuming the budget line shifts parallel rather than pivoting when a price changes.
- Recalculating the maximum of X even though its price has not changed.
- Forgetting to divide income by the new price to find the new intercept.
Things to Be Careful About
- Always verify which good is on which axis before reading intercept values.
- Ensure prices are expressed in dollars per unit.
- When only one price changes, only the intercept on that good's axis changes; the other intercept is unaffected.
Which combination of costs and benefits will lead to an increase in net social costs?
Options
| private benefits | external benefits | private costs | external costs | |
|---|---|---|---|---|
| A | falls | falls | no change | no change |
| B | no change | increases | falls | no change |
| C | no change | increases | falls | falls |
| D | increases | increases | no change | falls |
Net social cost = total social cost – total social benefit. Total social cost = private costs + external costs. Total social benefit = private benefits + external benefits. For net social cost to increase, social cost must rise relative to social benefit. Option A: private benefits fall and external benefits fall, so social benefit falls. Private costs and external costs unchanged, so social cost unchanged. Net social cost = cost (unchanged) – benefit (fall) → net social cost rises. Options B, C and D all raise social benefit or lower social cost, reducing net social cost.
Answer
A
A
Background Concept
Social cost is the full cost to society of an economic activity, including both the private costs borne by the producer or consumer and the external costs imposed on third parties. Similarly, social benefit includes both private benefits and external benefits. Net social cost (or net social benefit when positive) is defined as social cost minus social benefit. When social cost exceeds social benefit, the activity generates a net welfare loss. The question asks for the change that would increase net social cost, meaning the gap between social cost and social benefit widens.
Understanding the Question
The question presents a table with four options showing changes (increase, decrease, or no change) in private benefits, external benefits, private costs, and external costs. The task is to identify which combination would lead to a higher net social cost. The command word is “lead to”, so one must reason step by step from the changes to the effect on net social cost. No calculation of absolute values is needed; only direction matters.
Approach
First, recall the definitions:
- Total social benefit (TSB) = private benefits + external benefits.
- Total social cost (TSC) = private costs + external costs.
- Net social cost = TSC – TSB.
For net social cost to increase, either TSC must rise, or TSB must fall, or both in a way that makes the difference larger. Evaluate each option by determining the net change in TSB and TSC, then compute the directional change in net social cost.
Step-by-Step Reasoning
Option A:
- Private benefits: falls (↓)
- External benefits: falls (↓)
--> TSB falls (↓). - Private costs: no change (0)
- External costs: no change (0)
--> TSC unchanged (0).
Net social cost = TSC (0) – TSB (↓) = 0 minus a smaller number = positive increase. So net social cost rises.
Option B:
- Private benefits: no change (0)
- External benefits: increases (↑)
--> TSB rises (↑). - Private costs: falls (↓)
- External costs: no change (0)
--> TSC falls (↓).
Net social cost = TSC (↓) – TSB (↑) = larger negative (or smaller positive) – clear reduction in net social cost.
Option C:
- Private benefits: no change (0)
- External benefits: increases (↑)
--> TSB rises (↑). - Private costs: falls (↓)
- External costs: falls (↓)
--> TSC falls (↓).
Again net social cost falls.
Option D:
- Private benefits: increases (↑)
- External benefits: increases (↑)
--> TSB rises (↑). - Private costs: no change (0)
- External costs: falls (↓)
--> TSC falls (↓).
Net social cost falls.
Only Option A produces a rise in net social cost.
Key Takeaways
This question tests the fundamental decomposition of social costs and benefits into private and external components. The key skill is tracing how changes in each component affect the overall net social cost. In any policy analysis, understanding whether a change improves or worsens welfare requires comparing the direction of change in both TSC and TSB.
Common Mistakes
- Confusing net social benefit with net social cost (the sign difference). Some candidates might think an increase in net social cost is desirable, but it is the opposite. The question simply asks for the combination that would cause an increase, not whether it is good or bad.
- Failing to add both private and external components correctly, e.g., treating private benefits as the only benefit.
- Thinking that a decrease in external costs directly increases net social cost without also considering changes in benefits.
Things to Be Careful About
- Always define net social cost as TSC – TSB, not the other way around.
- Work through each option systematically: first compute ΔTSB, then ΔTSC, then the net effect.
- Remember that an increase in TSB or a decrease in TSC works in the same direction to reduce net social cost.
- The question does not require quantifying the magnitude, only the direction of change.
A firm increases its output, starting from zero.
How will this affect its short-run marginal cost (MC), average total cost (ATC) and average fixed cost (AFC)?
Options
| MC | ATC | AFC | |
|---|---|---|---|
| A | fall then rise | fall then rise | fall |
| B | fall then rise | rise then fall | rise |
| C | rise then fall | fall then rise | fall |
| D | rise then fall | rise then fall | rise |
Answer
In the short run, as output increases from zero:
- MC initially falls due to increasing returns (specialisation), then rises due to the law of diminishing returns.
- ATC initially falls as fixed costs are spread over more units and as MC is low, then rises when diminishing returns push MC up.
- AFC falls continuously as total fixed cost is spread over an increasing number of units.
This matches option A.
A
Background Concept
In the short run, at least one factor of production is fixed (e.g., capital, factory size). Total cost (TC) is the sum of total fixed cost (TFC) and total variable cost (TVC). From these we derive:
- Average Fixed Cost (AFC) = TFC / Q. Since TFC is constant, AFC falls continuously as output (Q) rises.
- Average Variable Cost (AVC) = TVC / Q. TVC rises with output, but at a changing rate due to the law of diminishing returns.
- Average Total Cost (ATC) = TC / Q = AFC + AVC.
- Marginal Cost (MC) = change in TC / change in Q. It is the cost of producing one more unit.
The law of diminishing returns states that as more of a variable factor (e.g., labour) is added to a fixed factor (e.g., capital), the marginal product of the variable factor eventually falls. This causes MC to eventually rise.
Understanding the Question
The question asks how three cost curves (MC, ATC, AFC) behave as a firm increases output from zero. It is a multiple-choice question testing knowledge of the typical U-shaped and L-shaped cost curves in the short run. The correct answer must match the pattern for all three curves.
Approach
Recall the standard shapes:
- AFC: always falls (a rectangular hyperbola).
- MC: falls initially (increasing returns), then rises (diminishing returns).
- ATC: falls initially (spreading fixed costs and low MC), then rises (rising MC dominates).
Match these patterns to the options.
Step-by-Step Reasoning
-
AFC: TFC is constant. As Q increases, AFC = TFC/Q decreases. It never rises. This eliminates options B and D, which show AFC rising.
-
MC: With increasing returns at low output (specialisation), MC falls. Eventually, diminishing returns set in, so MC rises. The pattern is "fall then rise". This eliminates option C ("rise then fall").
-
ATC: At low output, AFC is high but falling fast, and MC is low, so ATC falls. As output increases further, rising MC eventually outweighs the falling AFC, so ATC rises. The pattern is "fall then rise".
Only option A shows: MC fall then rise, ATC fall then rise, AFC fall.
Key Takeaways
- AFC always falls in the short run.
- MC and ATC are both U-shaped (fall then rise) in the short run, but MC reaches its minimum before ATC.
- The law of diminishing returns is the key reason for the rising portion of MC and ATC.
Common Mistakes
- Confusing the shape of AFC (always falling) with AVC or ATC (U-shaped).
- Thinking MC rises from the start — it initially falls due to specialisation.
- Mixing up the order: MC falls first, then rises; ATC follows a similar pattern but lags behind MC.
Things to Be Careful About
- The question specifies "short-run" — fixed costs exist.
- "Starting from zero" means the very first units are produced, so the initial fall in MC and ATC is relevant.
- Read all three columns together; a single mismatch eliminates the option.
Assuming the absence of price controls, in which industry is an individual firm least likely to be able to alter the price at which it sells its product?
Options
A air transportation
B hairdressing
C steel production
D wheat farming
Reasoning
A firm's ability to alter the price of its product depends on the market structure in which it operates. In perfect competition, firms are price takers and must accept the market price. Wheat farming is the industry among the options that most closely approximates perfect competition: many small producers, a homogeneous product (wheat is largely undifferentiated), and free entry and exit. An individual wheat farmer cannot influence the market price by changing their own output. In contrast, air transportation (oligopoly with product differentiation), hairdressing (monopolistic competition with differentiation), and steel production (oligopoly with barriers to entry) all allow firms some degree of price-setting power. Therefore, wheat farming is the industry where a firm is least likely to be able to alter price.
Answer
D
D
Background Concept
Market structures describe the competitive environment in which firms operate. The key distinction for this question is between a price taker and a price maker. A price taker is a firm that cannot influence the market price of its product; it must accept the price determined by market supply and demand. This occurs when the firm is one of many small producers of a homogeneous product, with no barriers to entry or exit — the conditions of perfect competition. A price maker (or price setter) has some control over the price, typically because it faces a downward-sloping demand curve for its differentiated product, or because it is a large player in the market. The ability to alter price is linked to the degree of market power.
Understanding the Question
This is a multiple-choice question asking: Assuming the absence of price controls, in which industry is an individual firm least likely to be able to alter the price at which it sells its product? The phrase "absence of price controls" removes the possibility that government intervention (e.g., price ceilings or floors) is the reason a firm cannot set price. It tells us to focus purely on market structure. The command word "least likely" requires us to identify the industry where an individual firm has the smallest degree of price-setting power. The options are: air transportation, hairdressing, steel production, and wheat farming.
Approach
To answer, we must assess each industry's market structure based on typical characteristics: number of firms, product differentiation, barriers to entry, and the firm's influence over price. We then compare them to the textbook model of perfect competition, where firms are price takers. The industry that most closely resembles perfect competition will be the one where individual firms have the least ability to alter price. Wheat farming is the natural candidate because it is often cited as a real-world example of near-perfect competition: many farmers, homogeneous product, free entry, and no single farmer can affect the world price. The other options involve some degree of market power: air transportation has high fixed costs, few airlines, and product differentiation; hairdressing has product differentiation (different stylists, location) and some local market power; steel production is capital-intensive with high barriers to entry and a few large firms (oligopoly).
Step-by-Step Reasoning
-
Identify the market structure of each industry:
- Wheat farming: Many small farmers, homogeneous product (wheat is a commodity), free entry and exit (land can be bought and sold, no significant barriers). This is closest to perfect competition.
- Air transportation: Few large airlines (oligopoly), high barriers to entry (aircraft, landing slots, regulations), product differentiation (brand, service, routes). Firms have some price-setting power, though they must consider competitors' reactions.
- Hairdressing: Many salons, but product differentiation (location, skill, brand, service). This is monopolistic competition; firms have some control over price because they face a downward-sloping demand curve, but entry is relatively easy.
- Steel production: Few large firms, high capital costs, significant barriers to entry. This is an oligopoly, often with price leadership or collusion. Firms have considerable market power.
-
Apply the price taker vs. price maker test:
- In perfect competition, a firm's demand curve is perfectly elastic at the market price. The firm cannot charge a higher price (consumers will go to other farmers) and has no incentive to charge a lower price (it can sell all it wants at the market price). Therefore, the individual firm has zero ability to alter price.
- In monopolistic competition (hairdressing), the firm's demand curve is slightly downward-sloping, meaning it can raise price a little without losing all customers, because of differentiation. So it has some ability to alter price, albeit limited.
- In oligopoly (air transportation, steel production), firms have significant market power, but they are interdependent. They can often influence price, though they may face retaliation.
-
Compare the likelihood of altering price:
- Wheat farming: least likely (price taker).
- Hairdressing: slightly more likely (some brand loyalty, differentiation).
- Steel production: more likely (oligopoly with price-setting power).
- Air transportation: also likely (oligopoly with price-setting power).
-
Conclusion: The correct answer is D (wheat farming).
Key Takeaways
- A firm's ability to set price depends on the market structure it operates in.
- Perfect competition leads to price-taking behaviour; any deviation from perfect competition (product differentiation, barriers to entry, few firms) gives the firm some degree of price-setting power.
- Real-world examples: wheat farming is a standard example of a market close to perfect competition; services like hairdressing illustrate monopolistic competition; industries like steel and airlines are oligopolies.
- The question's assumption "absence of price controls" eliminates government intervention as a reason for price-taking, so we focus solely on market structure.
Common Mistakes
- Confusing wheat farming with other industries: Some students might think that because wheat is a staple, the government might control prices (but the question says "assuming absence of price controls"). Or they might think farmers have some power because they can choose to store grain, but that does not affect the market price in a competitive market.
- Thinking hairdressing is perfectly competitive: Because there are many hairdressers, some assume it is perfect competition. But product differentiation (different skills, locations, service quality) gives each firm some price-setting power, even if limited.
- Overlooking the phrase "least likely": The question is comparative; we need to rank the industries by the degree of price-setting power. The answer is the one where the firm has the least ability, not the one where it has none at all (though wheat farming is essentially zero).
- Bringing in other factors: Some students might consider demand elasticity or cost structures, but the core issue is market structure.
Things to Be Careful About
- Assumptions matter: The question explicitly says "assuming absence of price controls". Do not assume any government intervention; it's a pure market structure analysis.
- Distinguish between price taker and price maker: A price taker cannot influence price; a price maker can. Wheat farming is the classic price taker example.
- Be aware of real-world nuances: While wheat farming is close to perfect competition, it is not perfectly perfect (e.g., futures markets, subsidies). But for Cambridge A-Level purposes, it is the standard example.
- Read the entire question: The options are specific; know the characteristics of each industry.
A firm has the choice between five levels of output. The table shows the total cost and total revenue of producing at each output level. The firm could sell whatever output it produces.
| output units | total cost $ | total revenue $ |
|---|---|---|
| 1000 | 8 000 | 10 000 |
| 2000 | 12 000 | 18 000 |
| 3000 | 19 000 | 24 000 |
| 4000 | 23 000 | 28 000 |
| 5000 | 25 000 | 25 000 |
The firm decides to produce 4000 units.
What is the firm’s aim?
Options
A to maximise profit
B to maximise sales
C to maximise revenue
D to minimise average costs
Answer
Calculate profit and total revenue for each output level:
- At 1000 units: profit = $10 000 - $8 000 = $2 000; revenue = $10 000
- At 2000 units: profit = $18 000 - $12 000 = $6 000; revenue = $18 000
- At 3000 units: profit = $24 000 - $19 000 = $5 000; revenue = $24 000
- At 4000 units: profit = $28 000 - $23 000 = $5 000; revenue = $28 000
- At 5000 units: profit = $25 000 - $25 000 = $0; revenue = $25 000
Profit is maximised at 2000 units ($6 000), but the firm chooses 4000 units. Total revenue is highest at 4000 units ($28 000). Average cost is lowest at 5000 units ($5 per unit). The firm's choice corresponds to the output that maximises total revenue, so its aim is to maximise revenue. Therefore, the correct answer is C.
C
Background Concept
Firms can have different objectives. The traditional profit-maximising objective assumes firms aim to maximise profit, where profit = total revenue (TR) - total cost (TC). Revenue maximisation, as in Baumol's model, occurs when managers aim to maximise total sales revenue, often subject to a minimum profit constraint. Sales maximisation (also Baumol) aims to maximise the quantity of output sold, subject to a break-even constraint (profit >= 0). Average cost minimisation is about producing at the lowest possible unit cost.
Understanding the Question
The firm provides a table of total cost and total revenue at five output levels. It can sell any output it produces. The firm chooses to produce 4000 units. We need to determine which objective (A profit maximisation, B sales maximisation, C revenue maximisation, D average cost minimisation) is consistent with that choice. The question tests the ability to compute and compare the relevant figures.
Approach
Compute profit, total revenue, and average cost for each output level. Identify which output level maximises each objective. Then see which objective matches the firm's actual choice of 4000 units.
Step-by-Step Reasoning
-
Compute profit (TR - TC) for each output:
- 1000: 10000 - 8000 = 2000
- 2000: 18000 - 12000 = 6000
- 3000: 24000 - 19000 = 5000
- 4000: 28000 - 23000 = 5000
- 5000: 25000 - 25000 = 0
Profit is highest at 2000 units (6000). The firm does not choose 2000, so profit maximisation is not the aim.
-
Total revenue is given directly. The highest is at 4000 units (28000). The firm chooses 4000, so revenue maximisation is consistent.
-
Average cost (TC/Q):
- 1000: 8
- 2000: 6
- 3000: 6.33
- 4000: 5.75
- 5000: 5
Lowest is at 5000 (5). The firm chooses 4000, so average cost minimisation is not the aim.
-
Sales maximisation (maximising output subject to a break-even constraint, profit >= 0): The maximum output with non-negative profit is 5000 units (profit = 0). The firm does not choose 5000, so sales maximisation is not the aim.
Thus, the only objective that matches the choice is revenue maximisation. The correct answer is C.
Key Takeaways
- Firms can have different objectives; profit maximisation is not always the goal.
- Revenue maximisation occurs where total revenue is highest, which may be at a different output than profit maximisation.
- Sales maximisation (Baumol) involves producing the maximum output subject to at least zero profit.
- Average cost minimisation is about efficiency, not necessarily profit.
Common Mistakes
- Assuming the firm always maximises profit without checking the data.
- Confusing revenue maximisation with sales maximisation (quantity).
- Not calculating profit for all output levels and just comparing TR and TC.
Things to Be Careful About
- Ensure correct arithmetic: profit = TR - TC.
- Remember that sales maximisation is about quantity, not revenue.
- The firm can sell any output, so the table gives TR directly; no need to find price.
- Pay attention to the order of outputs: the highest revenue is at 4000, not 5000.
The diagram shows the costs and benefits of producing steel in a free market.
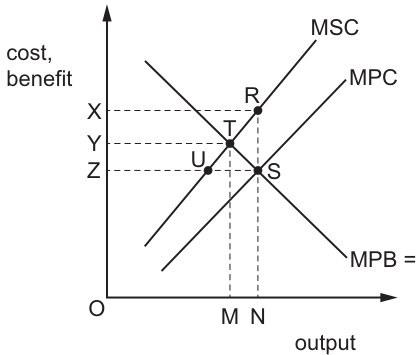
Which area measures the deadweight loss of economic welfare?
Options
A RTS
B RUS
C TUS
D YTUS
Working
The diagram shows a negative production externality, as MSC lies above MPC. The free market equilibrium occurs where MPC = MPB at point S, output N. The socially optimal equilibrium occurs where MSC = MPB at point T, output M. The deadweight loss arises from the overproduction of units between M and N, where the social marginal cost exceeds the marginal benefit to consumers. This loss is represented by the triangular area between points R, T and S.
Answer
A
A
Background Concept
An externality exists when a third party not involved in a market transaction experiences a cost or benefit from that transaction. A negative production externality occurs when producing a good imposes uncompensated costs on third parties (e.g. steel production causing air pollution that harms local residents).
Private marginal cost (MPC) is the cost of producing one additional unit that is borne directly by the firm. Social marginal cost (MSC) is the total cost to society of producing one additional unit, equal to MPC plus the marginal external cost (MEC) of the externality: MSC = MPC + MEC. When MEC is positive, MSC lies above MPC.
Marginal private benefit (MPB) is the benefit consumers receive from one additional unit of the good. In the absence of consumption externalities, MPB equals marginal social benefit (MSB), as all benefits from consumption are captured by the buyer.
In a free market, firms ignore external costs and produce where MPC = MPB, leading to a higher output than is socially optimal. The socially optimal output is where MSC = MSB, as this is the point where total societal welfare (total surplus) is maximised.
Deadweight loss of economic welfare is the loss of total societal surplus that occurs when the market produces an output level different from the social optimum. For a negative production externality, this loss comes from the units that are overproduced in the free market: for each of these units, the social cost of production exceeds the benefit consumers gain from consuming it, so these units reduce overall welfare.
Understanding the Question
The question provides a standard diagram illustrating a negative production externality in the steel market, and asks you to identify which labelled area represents the deadweight loss of economic welfare. The diagram includes three upward-sloping curves (MPC, MSC, with MSC above MPC) and one downward-sloping curve (MPB = MSB), with four labelled points (R, T, S, U) and four area options. The question is a 1-mark multiple-choice question, so it tests your ability to recognise the standard deadweight loss triangle for this type of market failure, rather than requiring calculation or extended reasoning. The key task is to distinguish the free market outcome from the socially optimal outcome, then match the deadweight loss area to the correct set of points.
Approach
To solve this question, follow these steps:
- First, identify the type of market failure: the diagram shows MSC above MPC, so this is a negative production externality (external costs are imposed on third parties by production).
- Locate the free market equilibrium: this occurs where private costs equal private benefits, i.e. the intersection of MPC and MPB. This is point S, at output level N.
- Locate the socially optimal equilibrium: this occurs where all social costs equal all social benefits, i.e. the intersection of MSC and MPB (since MPB = MSB here). This is point T, at output level M.
- Note that the free market overproduces relative to the social optimum (N > M), because firms ignore the external costs of production. The deadweight loss comes from the overproduced units between M and N, where the social cost of each unit is higher than the benefit consumers receive from it.
- The deadweight loss is the triangular area bounded by the MSC curve, the MPB curve, and the vertical line at output N, between the two equilibrium points. This is the area RTS, which corresponds to option A.
- Eliminate the other options: RUS includes the area between MPC and MSC which is external cost but not deadweight loss; TUS is the area between MPC and MPB which represents private surplus (consumer + producer surplus) from the overproduced units, not a loss; YTUS is a larger area that includes both private surplus and external cost, not just the welfare loss.
Step-by-Step Reasoning
- First, confirm the market failure type: The diagram has MSC above MPC, meaning there is a positive marginal external cost (MEC = MSC - MPC) for every unit of steel produced. This is a classic negative production externality, for example from pollution emitted during steel manufacturing.
- Free market equilibrium: In an unregulated free market, firms only consider their private costs when deciding how much to produce. They will therefore choose the output level where their private marginal cost equals the marginal benefit consumers get from the good, i.e. MPC = MPB. This intersection is point S, which corresponds to output N and price/cost level Z.
- Socially optimal equilibrium: From society's perspective, the optimal output is where the total cost to society of producing an extra unit equals the total benefit to society from consuming it. Since there are no consumption externalities, MSB = MPB, so the social optimum is where MSC = MPB. This intersection is point T, which corresponds to output M and cost/benefit level Y. Note that M < N, so the free market overproduces steel relative to the social optimum.
- Source of deadweight loss: For every unit of steel produced between M and N, the social marginal cost (the total cost to society of producing that unit) is higher than the marginal private benefit (the value consumers place on that unit). This means each of these units reduces total societal welfare: the cost to society of producing them is greater than the benefit society gets from consuming them. The total welfare loss from these units is the deadweight loss.
- Calculating the deadweight loss area: The deadweight loss is the sum of the difference between MSC and MPB for each unit from M to N. On the diagram, this is the triangular area bounded by:
- The MSC curve from point T (MSC at output M) to point R (MSC at output N)
- The MPB curve from point T to point S (MPB at output N)
- The segment RS, which forms the third side of the triangle, enclosing all units where MSC exceeds MPB.
- Eliminating other options:
- Option B (RUS): This is a quadrilateral that includes the area between MPC and MSC (external costs) as well as the area between MPC and MPB (private surplus). Only the part of this area where MSC > MPB is deadweight loss, so RUS is too large.
- Option C (TUS): This is the area between MPC and MPB from M to N, which represents the private surplus (consumer surplus plus producer surplus) generated by the overproduced units. This is a benefit to private parties, not a loss to society, so it is not deadweight loss.
- Option D (YTUS): This area includes both the private surplus from the overproduced units and the external costs of those units, but it does not capture the net welfare loss (the difference between external cost and private benefit). It is not the deadweight loss area.
- Therefore, the correct answer is option A, area RTS.
Key Takeaways
- A negative production externality occurs when MSC > MPC, leading to overproduction in a free market.
- The deadweight loss from a negative production externality is the triangular area between the MSC curve, the MPB curve, covering the overproduced units where social cost exceeds social benefit.
- Always distinguish between private costs/benefits and social costs/benefits when analysing market failure: deadweight loss is a societal, not private, concept.
- The free market equilibrium is found at MPC = MPB, while the social optimum is at MSC = MSB.
Common Mistakes
- Confusing the deadweight loss area with the total external cost area: The total external cost of overproduction is the area between MSC and MPC from M to N (the trapezoid TRSU), but deadweight loss is only the part of this where the external cost exceeds the consumer benefit, i.e. the triangle RTS. Students often select the larger trapezoid area instead of the correct triangle.
- Mixing up the equilibrium points: Some students incorrectly take the free market equilibrium as MSC = MPB, or the social optimum as MPC = MPB, leading them to select the wrong area.
- Forgetting that MPB = MSB in the absence of consumption externalities: If students assume there are consumption externalities, they may look for an MSB curve separate from MPB, which is not present here, leading to confusion.
- Selecting an area that represents private surplus (like TUS) instead of welfare loss: Private surplus is a benefit to consumers and producers, not a loss to society, so it cannot be deadweight loss.
Things to Be Careful About
- Always check which curves are intersecting to identify each equilibrium: MPC ∩ MPB = free market, MSC ∩ MPB = social optimum (when no consumption externalities exist).
- Deadweight loss is always the area between the social marginal cost/benefit curve and the private marginal cost/benefit curve for the units that are over/under-produced relative to the social optimum. For a negative production externality, this is the area between MSC and MPB for the overproduced units (N - M).
- Label all points correctly when analysing the diagram: point R is on the MSC curve at the free market output N, point T is the intersection of MSC and MPB at the social optimum M, point S is the intersection of MPC and MPB at the free market output N, and point U is on the MPC curve at the social optimum M. Matching these points to the correct curves is essential to identifying the right area.
- Remember that deadweight loss is a net welfare loss: it is the difference between the social cost and social benefit of the misallocated units, not the total external cost or total private surplus.
What is likely to make it more difficult for a small firm to survive?
Options
A increased preference on the part of consumers for distinctive non-standardised products
B reductions in the rate of interest charged by commercial banks
C the absence of effective barriers to the entry of potential competitors
D the existence of decreasing returns to scale
Reasoning
Small firms survive in markets where they are protected from competition, often by barriers to entry. The absence of effective barriers to entry (Option C) means new competitors can enter the market freely, increasing competition and making it harder for an existing small firm to survive. Options A, B, and D do not directly threaten survival: A (consumer preference for distinctive products) may actually help small firms differentiate themselves; B (lower interest rates) reduces borrowing costs and eases financial pressure; D (decreasing returns to scale) is a cost disadvantage that affects all firms but is not the most direct threat to survival.
Answer
C
C
Background Concept
Small firms survive in markets where they face limited competition. Barriers to entry — such as high start-up costs, legal restrictions, brand loyalty, or economies of scale — protect existing firms from new rivals. When barriers are low or absent, new firms can enter easily, increasing supply and reducing the market share and profits of incumbents. This is especially threatening to small firms, which often lack the resources to compete aggressively on price or marketing.
Understanding the Question
The question asks which factor would make it more difficult for a small firm to survive. The key is to identify the option that increases competitive pressure on the small firm. Each option must be evaluated for its effect on the firm's ability to maintain sales and profits.
Approach
Consider each option in turn:
- A: Consumer preference for distinctive, non-standardised products — this could be a niche that small firms exploit, so it may help rather than hinder.
- B: Lower interest rates — this reduces the cost of borrowing, which could help a small firm finance investment or working capital, making survival easier.
- C: Absence of effective barriers to entry — this means new competitors can enter the market freely, increasing competition and threatening the small firm's market share and profits.
- D: Decreasing returns to scale — this is a cost disadvantage that affects all firms, but it does not directly increase competition; it may even discourage new entrants.
Step-by-Step Reasoning
-
Option A: If consumers want distinctive, non-standardised products, small firms can cater to niche markets that larger firms may ignore. This differentiation can give small firms a competitive advantage, making survival easier, not harder. So A is incorrect.
-
Option B: A reduction in interest rates lowers the cost of borrowing. For a small firm, this means cheaper loans for expansion, equipment, or cash flow. It reduces financial pressure and makes survival easier. So B is incorrect.
-
Option C: Barriers to entry protect existing firms from new competition. If there are no effective barriers, new firms can enter the market easily. This increases the number of competitors, which can reduce the market share and profits of the existing small firm. Intense competition may force prices down and make it harder for the small firm to survive. This is the correct answer.
-
Option D: Decreasing returns to scale mean that as the firm expands output, average costs rise. This is a cost disadvantage, but it affects all firms in the industry. It does not directly increase the number of competitors. In fact, it may deter new entrants because they would also face rising costs. So D is incorrect.
Key Takeaways
- Small firms survive when they are protected from competition, often by barriers to entry.
- The absence of barriers to entry increases competition and threatens small firm survival.
- Factors that reduce costs or allow differentiation tend to help small firms, not harm them.
Common Mistakes
- Confusing 'barriers to entry' with 'economies of scale': Barriers to entry are obstacles that prevent new firms from entering a market; economies of scale are cost advantages that large firms have. The absence of barriers is a threat; the absence of economies of scale is not necessarily a threat.
- Misinterpreting 'decreasing returns to scale': This is a cost condition, not a competitive threat. It does not directly increase the number of rivals.
- Thinking that lower interest rates always help: While lower rates generally ease financial pressure, the question asks what makes survival more difficult, so a helpful factor is the opposite of what is needed.
Things to Be Careful About
- Read the question carefully: it asks what makes survival more difficult, not easier.
- Distinguish between factors that affect costs and factors that affect competition. The most direct threat to a small firm's survival is increased competition, not higher costs.
- Remember that small firms often thrive in niche markets where they can differentiate their products — this is a survival strategy, not a threat.
A market structure in which a small number of firms face competition from potential entrants.
What does this describe?
Options
A a contestable market
B a monopoly
C monopolistic competition
D perfect competition
Answer
A contestable market is one where there are few firms currently operating, but the threat of potential entry from new competitors is strong because barriers to entry and exit are low. This threat of entry forces existing firms to behave competitively, even if the market is concentrated. The description in the question — a small number of firms facing competition from potential entrants — exactly matches the definition of a contestable market.
Answer
A
A
Background Concept
A contestable market is a market structure in which there are few firms currently operating, but the threat of potential competition is high because barriers to entry and exit are very low. The key idea is that even a monopoly or oligopoly will be forced to behave competitively (produce at low cost, charge a price close to marginal cost, and earn only normal profit) if new firms can enter easily and leave without cost. This contrasts with a pure monopoly, where high barriers to entry protect the incumbent from any threat of competition.
Understanding the Question
The question asks you to identify which market structure is described by the statement: "A market structure in which a small number of firms face competition from potential entrants." The key phrase is "small number of firms" combined with "competition from potential entrants." This is a direct test of the definition of a contestable market. The four options are standard market structures from the syllabus.
Approach
Read each option and check whether its definition matches the given description. Focus on the two critical features: (1) a small number of firms currently in the market, and (2) competition from potential entrants (i.e., low barriers to entry). Eliminate options that do not satisfy both conditions.
Step-by-Step Reasoning
- Option A: a contestable market. This is the correct answer. A contestable market is defined by low barriers to entry and exit, so even if only a few firms are present, they face the constant threat of new entrants. The description matches exactly.
- Option B: a monopoly. A monopoly has only one firm, not a small number. Moreover, a monopoly typically has high barriers to entry, so it does not face competition from potential entrants. Eliminate.
- Option C: monopolistic competition. This market structure has many firms, not a small number. Each firm has some market power due to product differentiation, but there are many competitors. The description says "a small number of firms," so this does not fit. Eliminate.
- Option D: perfect competition. Perfect competition has a very large number of firms, each producing an identical product. There is no "small number of firms." Eliminate.
Therefore, only option A matches.
Key Takeaways
- A contestable market is defined by low barriers to entry and exit, not by the number of firms currently operating.
- The threat of potential entry is the key disciplining force in a contestable market.
- Be able to distinguish contestable markets from other market structures based on the number of firms and the ease of entry.
Common Mistakes
- Confusing a contestable market with perfect competition. Both have free entry, but perfect competition also requires a very large number of firms and identical products, whereas a contestable market can have few firms and differentiated products.
- Thinking that a small number of firms automatically means an oligopoly. While oligopoly also has few firms, the question specifically mentions "competition from potential entrants," which is the hallmark of contestability, not oligopoly (which often has significant barriers to entry).
Things to Be Careful About
- Read the description carefully: "a small number of firms" and "competition from potential entrants" are both essential. If the description had said "a small number of firms that compete with each other" without mentioning potential entrants, the answer would be oligopoly.
- Remember that contestable markets are a separate category in the syllabus, distinct from the four traditional market structures (perfect competition, monopolistic competition, oligopoly, monopoly).
What is an example of backward vertical integration?
Options
A a bakery buying a wheat farm
B a car manufacturer buying a car showroom
C a vineyard buying an apple orchard
D two rival supermarkets joining together
Reasoning
Backward vertical integration occurs when a firm acquires another firm operating at an earlier stage of the production process (i.e., closer to the raw materials). A bakery buying a wheat farm is an example of backward integration because the bakery is integrating backwards towards the source of its raw material (wheat). Option B is forward integration (car manufacturer buying a showroom, which is later in the chain). Option C is unrelated integration (vineyard and apple orchard are different products, not in the same supply chain). Option D is horizontal integration (two rivals at the same stage). Therefore, A is correct.
Answer
A
A
Background Concept
Vertical integration refers to a firm expanding its operations into different stages of the same production or supply chain. When a firm acquires or merges with a business that operates at an earlier stage of the chain – closer to raw materials or inputs – it is called backward vertical integration. This allows the firm to secure its supply of inputs, reduce costs, and gain more control over quality and delivery. The opposite, forward vertical integration, occurs when a firm expands into later stages (e.g., a manufacturer buying a retailer). Horizontal integration involves merging with a competitor at the same stage of production.
Understanding the Question
The question asks for a real-world example of backward vertical integration. It provides four options. The task is to identify which option matches the definition of a firm buying another business that supplies inputs to it, i.e., one step earlier in the production chain. The correct option must show the buyer operating downstream relative to the target.
Approach
First, recall the definitions of backward and forward vertical integration and horizontal integration. Then, examine each option in terms of the supply chain relationship between the buyer and the target. Identify the one where the buyer is at a later stage and the target is at an earlier stage of the same production process.
Step-by-Step Reasoning
- Option A: A bakery buys a wheat farm. The bakery uses wheat as an input. The wheat farm is upstream (earlier stage). This fits backward integration perfectly: the bakery moves backwards to secure its key input.
- Option B: A car manufacturer buys a car showroom. The showroom is downstream (later stage) – it sells cars to consumers. This is forward vertical integration, not backward.
- Option C: A vineyard buys an apple orchard. Vineyard and apple orchard are different products (grapes vs apples). They are not part of the same production chain. This is unrelated diversification/conglomerate integration, not vertical.
- Option D: Two rival supermarkets join together. They are at the same stage of the supply chain (selling to consumers). This is horizontal integration.
Only A matches the definition of backward vertical integration.
Key Takeaways
- Backward vertical integration involves acquiring a supplier or earlier-stage firm.
- Forward vertical integration involves acquiring a distributor or retailer.
- Horizontal integration involves merging with a competitor.
- To identify the type, trace the supply chain: raw materials -> production -> distribution -> retail.
Common Mistakes
- Confusing backward and forward integration: buying a retailer is forward, not backward.
- Mistaking unrelated diversification for backward vertical integration: both firms must be in the same product chain.
- Misidentifying a merger of two producers at the same stage as vertical (it is horizontal).
Things to Be Careful About
- Always determine which direction the acquisition is relative to the firm's current position in the chain.
- Ensure the two firms are in the same industry chain; otherwise, it is not vertical integration.
- Remember that backward integration is towards the source; forward integration is towards the customer.
A government wants to introduce a policy that will reduce the pollution caused by the production of a good.
Which policy would not make use of market forces?
Options
A a quota to limit the production of the good
B a regulation to ban the production of the good
C a tax on the production of the good
D a tradable pollution permit system for producers of the good
Reasoning
A government ban on production removes the market for the good entirely, so the price mechanism cannot allocate resources. In contrast, a quota limits supply but still allows the market to determine the price; a tax alters the price signal within the market; and a tradable permit system creates a new market for permits. Therefore, the ban does not make use of market forces.
Answer
B
B
Background Concept
Market forces refer to the free interplay of demand and supply that determines prices and allocates resources through the price mechanism. Governments often intervene to correct market failure, such as negative externalities from pollution. Policies that 'make use of market forces' work within the existing market system—they adjust incentives or quantities while still letting the price signal guide decisions. Examples include taxes, subsidies, and tradable permits. In contrast, command-and-control policies directly dictate behaviour through regulations, bans, or quantity restrictions that bypass the market mechanism entirely.
Understanding the Question
The question presents four policy options and asks which one does NOT use market forces. The pollution is a negative externality of production, so the government wants to reduce it. The options are:
- A quota (limit on production)
- A regulation banning production
- A tax on production
- A tradable pollution permit system
The key is to determine which policy removes or completely overrides the market process versus one that works through it.
Approach
- Recall the definition of market forces: the price mechanism allocating resources based on demand and supply.
- Assess each policy: does it allow the market to determine the outcome (price and quantity) subject to the policy constraint, or does it replace the market with a direct command?
- A tax changes the cost but leaves the market to respond.
- A quota sets a maximum quantity; price still adjusts to balance demand and supply.
- A tradable permit system creates a new market for pollution rights; the price of permits is market-determined.
- A ban eliminates production entirely—the market ceases to exist for that good.
- Identify that the ban is the only one that destroys the market, so it does not use market forces.
Step-by-Step Reasoning
- Option A: Quota – The government sets a maximum output level. Firms still compete to produce up to that limit, and consumers bid for the output. The price is determined by the intersection of demand with the now-inelastic supply constrained by the quota. This is a market outcome, albeit with a quantity ceiling. Thus, market forces operate.
- Option B: Ban – The government prohibits production altogether. No legal market exists; consumers cannot buy, and firms cannot sell. The price mechanism is completely bypassed. Therefore, this policy does not make use of market forces.
- Option C: Tax – A per-unit tax raises the cost of production, shifting the supply curve left. The market still determines the equilibrium price and quantity, now with a higher price and lower quantity. The tax uses price signals to discourage pollution. Market forces are essential.
- Option D: Tradable pollution permit system – The government issues a fixed number of permits that allow a certain amount of pollution. Firms can buy and sell these permits, creating a market price for pollution. The permit price reflects scarcity and firms' marginal abatement costs. This is a pure market-based approach.
Thus, only the ban eliminates the market itself.
Key Takeaways
- Market-based policies (taxes, subsidies, tradable permits) work through the price mechanism to correct externalities.
- Command-and-control policies (bans, direct regulations, quotas) impose restrictions without relying on price signals.
- The distinction is important when evaluating government intervention: market-based policies often achieve the same outcome more efficiently because they allow flexibility and use information dispersed in the market.
Common Mistakes
- Confusing a quota with a ban: both restrict output, but a quota sets a limit within a still-functioning market, whereas a ban removes the market entirely. Some students may think any quantitative restriction eliminates market forces, but the key is whether the price mechanism still determines allocation.
- Thinking that a tax does not use market forces because it is a government intervention; however, the tax works through the market by altering prices, not replacing them.
- Forgetting that tradable permits actually create a new market, so they are the ultimate use of market forces.
Things to Be Careful About
- Focus on the phrase 'make use of market forces': the question is not about which policy is most effective, but solely about the mechanism.
- In an MCQ, read all options carefully; some may seem similar but differ in how they interact with the market.
- For an essay, you would need to compare the efficiency and equity of these policies; here only classification is required.
The table shows the annual percentage change in the output per worker employed for four nationalised industries before and after privatisation.
| nationalised industry | before privatisation % | after privatisation % |
|---|---|---|
| railways | -4 | 2 |
| electricity supply | 7 | 9 |
| shipbuilding | 4 | -1 |
| telecommunications | 6 | 6 |
What can be concluded about the effect of privatisation?
Options
A Employment fell in the railway industry.
B Employment was unchanged in the telecommunications industry.
C Output was greatest in the electricity supply industry.
D Workers became less efficient in the shipbuilding industry.
Reasoning
The data shows annual percentage changes in output per worker for four industries before and after privatisation. Output per worker is a measure of labour productivity, so a decrease indicates a fall in efficiency.
- Railways: -4% to +2% → productivity improved.
- Electricity supply: +7% to +9% → productivity improved.
- Shipbuilding: +4% to -1% → productivity fell after privatisation.
- Telecommunications: unchanged at 6%.
Option D states: "Workers became less efficient in the shipbuilding industry." Since output per worker fell from +4% to -1%, efficiency (productivity) decreased. This conclusion is directly supported by the data.
Options A, B and C cannot be concluded because the data gives output per worker, not total output or employment levels. A fall in output per worker could occur with rising employment if output rose less than proportionately, and changes in employment are not shown. Therefore D is correct.
Answer
D
D
Background Concept
Output per worker (labour productivity) is a measure of efficiency: how much output each worker produces in a given time. Privatisation is often claimed to improve efficiency because private firms face profit incentives, competition, and harder budget constraints. However, the actual effect depends on market structure, regulation, and other factors. A change in output per worker is not the same as a change in total output or employment — it is a ratio.
Understanding the Question
This question presents a table of annual percentage changes in output per worker for four nationalised industries before and after privatisation. The task is to select which of the four statements can be correctly concluded from the data alone. The key skill is distinguishing between what the data directly shows and what would require additional information (e.g., total output, number of workers).
Approach
Read the table carefully, noting the direction of change for each industry. Check each option against the data:
- Option A refers to employment — not provided.
- Option B refers to employment — not provided.
- Option C refers to total output — not provided.
- Option D refers to efficiency (productivity) — the data directly measures this.
Only D is directly supported. The others would need extra assumptions or data.
Step-by-Step Reasoning
- Data given: annual % change in output per worker.
- For shipbuilding: before = +4%, after = -1%. This means that after privatisation, output per worker decreased by 1% per year (instead of increasing by 4%). So productivity fell.
- A fall in productivity means workers, on average, produced less per year than before. That is a decline in efficiency.
- Option D matches this interpretation.
- Option A: a fall in employment could be a cause of rising output per worker (if less productive workers are laid off), but the data does not tell us about employment. So we cannot conclude employment fell.
- Option B: similarly, unchanged telecommunications output per worker does not imply unchanged employment; employment could have changed while output changed proportionally.
- Option C: the electricity supply industry had the largest percentage increase in output per worker, but that does not mean its total output was greatest — the base level of output is unknown.
Hence D is the only valid conclusion.
Key Takeaways
- Output per worker is a rate, not a level. A percentage change tells you about growth, not the absolute amount.
- When interpreting data, distinguish between what is directly measured and what would be an inference requiring extra information.
- Privatisation's effect on productivity is case-specific; the data shows mixed results (improvement in railways and electricity, deterioration in shipbuilding, no change in telecoms).
Common Mistakes
- Assuming that a higher growth rate in output per worker means higher total output. (Wrong — the base matters.)
- Thinking that a fall in output per worker must mean fewer workers. (Wrong — output could fall faster than employment.)
- Choosing an option that sounds plausible but is not actually supported by the data. Many students pick A or B because they associate privatisation with job losses, but the data does not show jobs.
Things to Be Careful About
- Watch the units: "annual percentage change" — it is a growth rate, not a level.
- Do not infer beyond the data. The question asks what "can be concluded", not what might be true.
- Note the four industries show different results; there is no single "effect of privatisation" from this table.
Most workers in a country are employed in the manufacturing sector where they are paid a fixed wage rate per hour.
What will lead to an increase in the net advantage of workers currently employed in the manufacturing sector?
Options
A a reduction in working hours available
B a shift in the country’s economy to the service sector
C a subsidised lunch is made available
D an increase in the number of jobs available
Reasoning
Net advantage is the overall benefit from employment, including both monetary wage and non-monetary factors such as working conditions, perks, and safety. Workers in the manufacturing sector are paid a fixed wage rate per hour. A subsidised lunch (option C) is a non-wage benefit that raises the total compensation package without changing the wage rate, therefore increasing net advantage.
Option A – a reduction in working hours – reduces total earnings if hours are cut, lowering net advantage. Option B – a shift of the economy to services – does not directly affect manufacturing workers’ conditions or pay. Option D – an increase in available jobs – expands employment opportunities but does not increase net advantage for those already employed in the sector.
Only option C improves net advantage for existing manufacturing workers.
Answer
C
C
Background Concept
Net advantage is a concept from labour market theory that describes the total attractiveness of a particular occupation or job. It includes not only the wage – the monetary reward – but also all non-wage characteristics: working conditions (safety, hours, flexibility), reputation, job security, fringe benefits (company car, subsidised meals, pensions), location, and even the social status of the job. The supply of labour to an occupation is determined by net advantage relative to other occupations. When net advantage rises, more workers are willing to supply their labour at the same wage rate.
Understanding the Question
The question describes a country where most workers are in manufacturing, paid a fixed wage per hour. We are asked which change will increase the net advantage of workers currently employed in manufacturing. The key is that we focus on existing workers, not potential new entrants, and we consider any factor that makes their job more attractive overall. Each option must be evaluated to see whether it raises net advantage for those already working there.
Approach
We recall the definition of net advantage and examine each option:
- Identify whether the change affects wages (monetary) or non-wage factors.
- Determine if the effect is positive, negative, or neutral for current workers.
- Only an improvement that is directly experienced by existing workers counts.
Step-by-Step Reasoning
Option A: a reduction in working hours available
If the number of hours available is cut, existing workers earn less total income (fixed wage per hour times fewer hours). This reduces monetary benefit, likely worsening net advantage unless workers value the extra leisure highly. The net effect is ambiguous but generally negative because hours are cut without choice, so it is not an unambiguous increase in net advantage. Moreover, the question asks what will lead to an increase – this option would typically reduce net advantage.
Option B: a shift in the country’s economy to the service sector
This changes the structure of the economy, but does not directly alter the wage rate or non-wage benefits of manufacturing jobs. The manufacturing sector might shrink, but current workers still face the same conditions. Therefore, no change to their net advantage.
Option C: a subsidised lunch is made available
This is a direct non-wage benefit – a free or cheaper lunch at work. It raises the total compensation package without reducing the wage. Current workers enjoy this perk, so net advantage clearly increases. This is the correct answer.
Option D: an increase in the number of jobs available
More jobs in manufacturing might make it easier for others to enter, but for workers already employed, nothing changes. They still have the same wage and conditions. Net advantage remains unchanged.
Only option C unambiguously increases net advantage.
Key Takeaways
- Net advantage includes wage plus all non-wage benefits. A perk or improvement in conditions can increase net advantage even if the wage stays constant.
- When evaluating multiple-choice options, apply the definition precisely: does the change directly improve the package for the target group?
- Many students incorrectly think an increase in job availability improves conditions for existing workers – it does not.
Common Mistakes
- Confusing net advantage with wage: students may forget non-wage factors and choose D because more jobs seem better. But net advantage concerns the job itself, not the availability of jobs.
- Choosing A because fewer hours might be preferred – but a mandated reduction without compensation reduces total earnings unless leisure is highly valued; more importantly, the question expects a clear increase, and A is ambiguous at best.
- Ignoring the phrase “currently employed”: the change must affect existing workers, not the labour market as a whole.
Things to Be Careful About
- Always consider both monetary and non-monetary aspects of a job when assessing net advantage.
- Read the wording: “will lead to an increase” implies a certain, unqualified effect. Only one option clearly qualifies.
- Do not overthink: a subsidised lunch is a straightforward perk that raises net advantage.
When will a profit-maximising firm employ the optimum number of workers?
Options
A when the average revenue product of labour equals the average cost of hiring workers
B when the marginal revenue product of labour equals the average cost of hiring workers
C when the marginal revenue product of labour equals the marginal cost of hiring workers
D when the marginal revenue product of labour equals the trade union supplied cost of workers
Reasoning
A profit-maximising firm will hire workers up to the point where the additional revenue from the last worker (marginal revenue product of labour) equals the additional cost of that worker (marginal cost of labour). This is the standard marginal condition for optimal factor employment. Option C correctly states this condition.
Answer
C
C
Background Concept
Marginal revenue product of labour (MRPL) is the extra revenue a firm earns by employing one more unit of labour. It is calculated as the marginal physical product of labour (MPPL) multiplied by marginal revenue (MR) from selling that extra output: MRPL = MPPL x MR. In a perfectly competitive product market, MR equals price, so MRPL = MPPL x P. The marginal cost of labour (MCL) is the extra cost of hiring one more worker. In a perfectly competitive labour market, MCL equals the market wage rate; in a monopsony, MCL exceeds the wage because hiring an additional worker raises the wage for all existing workers.
Profit-maximising firms apply the same marginal principle to labour as they do to output: they keep hiring as long as the marginal benefit (MRPL) exceeds the marginal cost (MCL), and stop when MRPL = MCL. This is the optimum (profit-maximising) number of workers.
Understanding the Question
The question asks when a profit-maximising firm employs the optimum number of workers. It tests the correct application of marginal analysis to the labour input. The answer must be the condition that maximises profit, not one that gives zero average profit or relates to a specific institutional feature like trade unions.
Approach
Recall the general profit-maximising rule for any variable input: hire until marginal revenue product equals marginal input cost. Then identify which option expresses MRPL = MCL. Eliminate options that use average concepts or refer to irrelevant factors.
Step-by-Step Reasoning
-
A profit-maximising firm will increase its workforce as long as the extra revenue generated by an additional worker exceeds the extra cost of hiring that worker. Each addition increases profit until the two are equal.
-
The extra revenue is the marginal revenue product of labour (MRPL). The extra cost is the marginal cost of labour (MCL). The optimum occurs where MRPL = MCL.
-
Option C states exactly this: "when the marginal revenue product of labour equals the marginal cost of hiring workers".
-
Option A uses average revenue product and average cost. Average figures do not guide the marginal hiring decision. A firm could have ARPL > AC and still not be maximising profit if MRPL < MCL.
-
Option B uses MRPL but pairs it with average cost. The correct comparison is with marginal cost, not average cost.
-
Option D mentions "trade union supplied cost of workers". This is not a standard economic concept. Even if a union sets the wage, the profit-maximising condition remains MRPL = MCL (where MCL is the wage determined by the union in a perfectly competitive labour market, or the union's wage plus any effects on hiring costs). The phrasing is misleading and incorrect as a general condition.
Thus option C is correct.
Key Takeaways
- The profit-maximising employment condition is MRPL = MCL, derived from marginal analysis.
- Always use marginal (not average) values when deciding how much of an input to hire.
- The condition holds across different labour market structures; only the expression of MCL changes (wage in perfect competition, wage plus mark-up in monopsony).
Common Mistakes
- Choosing option A or B because they sound plausible but involve averages. Students often mistakenly think that if average revenue product equals average cost the firm is "breaking even" and that is optimal, but profit max requires MRPL = MCL.
- Thinking that the trade union's influence (option D) alters the condition; the union may affect the wage, but the condition remains MRPL = MCL (where MCL equals the union wage in a competitive market).
- Forgetting that the condition applies to each worker; the marginal worker is the last one hired.
Things to Be Careful About
- Distinguish carefully between average and marginal values in factor markets.
- In a perfectly competitive labour market, MCL = wage, so the condition simplifies to MRPL = wage. In a monopsony, MCL > wage, and the correct condition still uses MCL, not the wage.
- The condition for labour is analogous to the profit-maximising output condition where MR = MC.
The diagram shows the labour market for farm workers in New Zealand.
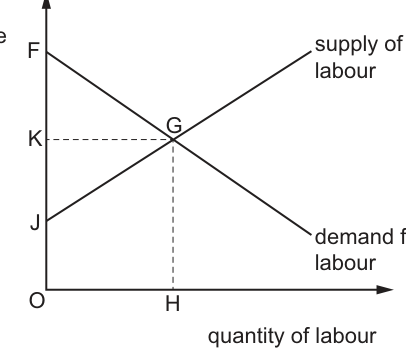
Which areas represent the economic rent and transfer earnings of the farm workers?
Options
| economic rent | transfer earnings | |
|---|---|---|
| A | GFK | GHOJ |
| B | GHOJ | GJK |
| C | GJK | GJF |
| D | GJK | GHOJ |
Working
Transfer earnings are the minimum payment a worker requires to supply labour to a particular job, equal to the wage they could earn in their next best alternative. The supply of labour curve shows the cumulative transfer earnings of all workers up to each quantity of labour, so total transfer earnings for the OH workers employed is the area under the supply curve, which is the quadrilateral GHOJ.
Economic rent is any payment to labour above their transfer earnings. Total earnings of the employed workers are the equilibrium wage (OK) multiplied by the quantity of labour (OH), equal to the rectangle OKGH. Economic rent is therefore total earnings minus transfer earnings: OKGH - GHOJ = the triangular area GJK.
Answer
D
D
Background Concept
The labour market operates like any other factor market: the price of labour (the wage rate) is set by the interaction of demand for labour (from firms, who demand labour as a derived input for production) and supply of labour (from workers, who offer their time in return for pay).
Two core concepts for analysing factor payments are:
- Transfer earnings: The minimum payment a factor of production (here, labour) must receive to remain in its current use, rather than moving to its next best alternative. For a worker, this is the wage they could earn in their best alternative job, representing the opportunity cost of working in this particular role. The labour supply curve is built from these individual minimum acceptable wages: at any quantity of labour, the height of the supply curve equals the transfer earnings of the marginal (last) worker willing to supply labour at that wage. Total transfer earnings for all employed workers is therefore the total area under the supply curve up to the quantity of labour hired.
- Economic rent: Any payment to a factor of production above its transfer earnings. It is the excess pay a worker receives due to factors like unique skills, scarcity of their labour, or barriers to entering the profession. For workers paid above their individual transfer earnings, the gap between their actual wage and their transfer earnings is their economic rent. Total economic rent for all employed workers is the total area between the actual wage rate and the supply curve, up to the quantity of labour employed.
Understanding the Question
This 1-mark multiple-choice question provides a diagram of the New Zealand farm worker labour market, with wage rate on the vertical axis and quantity of labour on the horizontal axis. The upward-sloping supply of labour curve starts at point J on the vertical axis, the downward-sloping demand for labour curve starts at point F, and they intersect at equilibrium point G. A horizontal dashed line from G meets the vertical axis at K (the equilibrium wage rate), and a vertical dashed line from G meets the horizontal axis at H (the equilibrium quantity of labour).
The question asks you to match the labelled areas to total economic rent and total transfer earnings for the farm workers. This tests your ability to apply standard factor payment definitions to a real-world labour market diagram.
Approach
To solve this, link each definition directly to the relevant area on the diagram:
- First identify total transfer earnings: this is the area under the labour supply curve up to the equilibrium quantity (OH), as the supply curve maps directly to workers' minimum acceptable wages.
- Next identify total economic rent: this is the difference between total actual worker earnings (equilibrium wage × equilibrium quantity) and total transfer earnings, or equivalently the area between the equilibrium wage line and the supply curve up to OH.
- Match these areas to the options provided, taking care to match the order of the columns (economic rent first, then transfer earnings).
Step-by-Step Reasoning
- Calculate total transfer earnings: The labour supply curve runs from point J (the minimum wage any worker is willing to accept for farm work) up to equilibrium point G. The total transfer earnings of all OH employed workers is the sum of each worker's minimum acceptable wage, represented by the area under the supply curve from quantity 0 to H. This is the quadrilateral bounded by points G, H, the origin O, and J, labelled GHOJ in the options.
- Calculate total economic rent: Total pay to all employed farm workers is the equilibrium wage (OK, the height of point G on the vertical axis) multiplied by equilibrium quantity (OH), equal to the rectangle OKGH. Economic rent is the excess of total earnings over transfer earnings:
Total economic rent = Total earnings - Total transfer earnings = OKGH - GHOJ = the triangular area bounded by points G, J, and K, labelled GJK. - Match to options: The question asks for economic rent first, then transfer earnings. We have economic rent = GJK, transfer earnings = GHOJ, which corresponds to option D.
Key Takeaways
- The supply curve of any factor of production directly represents the cumulative transfer earnings of all units of that factor up to each quantity: the height of the supply curve at any quantity is the transfer earnings of the marginal unit of the factor.
- Total transfer earnings is always the area under the supply curve up to the quantity of the factor employed.
- Economic rent is the area between the actual factor price (wage for labour) and the supply curve, up to the quantity employed, equal to total factor earnings minus total transfer earnings.
- These concepts apply to all factors of production: for example, for land, transfer earnings are the rent the land could earn in its next best use, and economic rent is any excess over that.
Common Mistakes
- Swapping economic rent and transfer earnings: This is the most common error, leading to option B. Remember: transfer earnings are the minimum required payment, so they are the larger lower area under the supply curve, while economic rent is the smaller excess area above the supply curve and below the wage line.
- Confusing the area under the demand curve with transfer earnings: The area under the demand for labour curve represents the total revenue product of labour (the total revenue firms earn from employing workers), which is unrelated to workers' earnings.
- Misidentifying economic rent as the area above the equilibrium wage: The area above the equilibrium wage (e.g., GFK) is not a payment to workers, so it cannot be economic rent.
- Ignoring the positive intercept of the supply curve: The supply curve starts at J, not the origin, so the first workers have positive transfer earnings equal to OJ, not zero. Transfer earnings are not the triangle OGH.
Things to Be Careful About
- Always link the definition to the diagram: the supply curve is the key to identifying transfer earnings, as it maps directly to workers' minimum acceptable wages.
- Check the order of the columns in the question: the first column is economic rent, the second is transfer earnings, so do not mix up the order when matching to the options.
- For 1-mark MCQs, you do not need to overcomplicate the answer: applying the core definitions correctly is sufficient to earn the mark.
What is not a function of a commercial bank?
Options
A to help firms raise finance
B to hold cash on deposit for firms
C to lend money to households
D to provide savings accounts
Answer
Commercial banks accept deposits, make loans, and provide payment services. They do not typically help firms raise finance by issuing shares or bonds; that is the role of investment banks or capital markets. Therefore, option A is not a function of a commercial bank.
Answer
A
A
Background Concept
Commercial banks are financial institutions that accept deposits from the public, make loans, and provide payment services (e.g., checking accounts, money transfers). Their core functions can be summarised as:
- Taking deposits (savings, current, fixed deposits)
- Lending to individuals, businesses, and governments
- Facilitating payments (cheques, electronic transfers)
Other financial institutions, such as investment banks, underwrite securities, help firms issue shares or bonds, and provide advisory services for mergers and acquisitions. Stock markets also enable firms to raise equity finance. While commercial banks do lend to firms (which is a form of debt finance), the phrase "help firms raise finance" in this context refers to the broader activity of raising capital through the issuance of securities, which is not a typical commercial bank function.
Understanding the Question
The question asks which of the four options is NOT a function of a commercial bank. The options are:
- A: to help firms raise finance
- B: to hold cash on deposit for firms
- C: to lend money to households
- D: to provide savings accounts
A candidate must identify which activity falls outside the scope of a commercial bank's role.
Approach
- Recall the three core functions of a commercial bank: taking deposits, making loans, and payment services.
- Evaluate each option against these functions.
- Identify the option that is not part of the core functions.
- Select the correct answer.
Step-by-Step Reasoning
- Option B: to hold cash on deposit for firms — This is a fundamental function. Commercial banks offer current accounts, savings accounts, and fixed deposits for businesses. So B is a function.
- Option C: to lend money to households — Commercial banks provide mortgages, personal loans, credit cards, etc. This is a core lending function. So C is a function.
- Option D: to provide savings accounts — Savings accounts are a type of deposit account. This is a core deposit-taking function. So D is a function.
- Option A: to help firms raise finance — This is ambiguous. Commercial banks do lend to firms (business loans, overdrafts), which is a form of finance. However, the phrase "help firms raise finance" in economics often refers to raising equity or bond finance through capital markets, which is not a typical commercial bank function. Investment banks specialise in this. Moreover, the presence of the other three clearly core functions suggests that A is the odd one out. The mark scheme confirms A as not a function. So A is the correct answer.
Key Takeaways
- Commercial banks have a distinct set of functions centred on deposits, loans, and payments.
- Other financial institutions (investment banks, stock markets) serve different purposes.
- Understanding these distinctions helps analyse the role of banks in the economy.
Common Mistakes
- Thinking that commercial banks help firms "raise finance" in the sense of issuing shares or bonds, which is not correct. Some students may think that commercial banks do help raise finance through lending, so they might incorrectly reject A. But the standard classification distinguishes lending (a bank function) from raising equity/debt capital (investment banking). In this question, A is the only one that does not match the core deposit/lend/pay functions.
- Confusing commercial banks with central banks or investment banks.
Things to Be Careful About
- Read the options carefully. Option A is broad; the test expects you to recognise that "raising finance" typically refers to capital markets, not commercial lending.
- Be precise about the functions: taking deposits, making loans, and facilitating payments are the core. Everything else is secondary or belongs to other institutions.
In 2020 in a country, the unemployment rate of the 16–64 age group seeking work was 4.0%.
The employment rate for this group in the same period was 76.6%.
What can be concluded from this?
Options
A 19.4% of the economy is working illegally.
B 23.4% of the age group is economically inactive.
C 80.6% of the age group is economically active.
D The data is inaccurate.
Answer
The unemployment rate is given as 4.0% of the 16–64 age group who are seeking work. This means that 4.0% of the age group are unemployed and actively seeking work. The employment rate is 76.6% of the same age group. Therefore, the total economically active (employed + unemployed) as a proportion of the age group is 76.6% + 4.0% = 80.6%. Hence, 80.6% of the age group is economically active. Options A, B, and D are incorrect because: A refers to illegal working, B gives the inactive rate as 23.4% (which would be 100% – 76.6%, ignoring the unemployed), and D suggests inaccuracy without evidence.
Answer
C
C
Background Concept
In labour market statistics, the working-age population is divided into three groups: employed, unemployed (actively seeking work), and economically inactive (not seeking work). The employment rate is the percentage of the working-age population that is employed. The unemployment rate is conventionally the percentage of the labour force (employed + unemployed) that is unemployed. However, in this question, the phrase 'unemployment rate of the 16–64 age group seeking work' indicates that the unemployment rate is given as a proportion of the age group itself, not of the labour force. This means that the 4.0% refers to the share of the age group that is both unemployed and seeking work.
Understanding the Question
The data provides two percentages for the same age group (16–64 years old): an unemployment rate of 4.0% and an employment rate of 76.6%. The question asks what can be concluded from these two numbers. The key is to recognise that both rates are percentages of the same base population (the age group). Therefore, the sum of the two gives the proportion of the age group that is economically active (i.e., either employed or actively seeking work). The economically inactive are those not in the labour force.
Approach
We can directly add the two percentages (since they are both out of the same total population) to find the economic activity rate: 76.6% + 4.0% = 80.6%. Then we compare this result with the given options. Option C states '80.6% of the age group is economically active', which matches our calculation. Options A, B, and D are incorrect for reasons we will examine.
Step-by-Step Reasoning
- Identify the definitions: The employment rate (76.6%) is the proportion of the age group that is employed. The unemployment rate (4.0%) is given as the proportion of the age group that is unemployed and seeking work. (This is an alternative definition; the standard definition would use the labour force as the denominator.)
- Compute the economically active proportion: Since both rates refer to the same total population (the age group), the sum represents the share that is either employed or unemployed (i.e., in the labour force): 76.6% + 4.0% = 80.6%.
- Interpret the result: 80.6% of the 16–64 age group is economically active (in the labour force). The remaining 19.4% (100% – 80.6%) is economically inactive (not seeking work).
- Evaluate the options:
- Option A: '19.4% of the economy is working illegally.' This is not supported; the 19.4% is the inactive proportion, and there is no information about illegal work.
- Option B: '23.4% of the age group is economically inactive.' This equals 100% – 76.6%, which ignores the unemployed (4.0%), so it is incorrect.
- Option C: '80.6% of the age group is economically active.' This matches our calculation and is correct.
- Option D: 'The data is inaccurate.' There is no evidence to deem the data inaccurate; the numbers are consistent if interpreted correctly.
Key Takeaways
- Always check the base population used in rates: employment rate is usually % of working-age population; unemployment rate is usually % of labour force, but questions may define it differently.
- When both rates are percentages of the same population, the economic activity rate can be found by adding the employment rate and the unemployment rate (if the latter is also expressed as a % of that population).
- The economically inactive proportion is 100% minus the economic activity rate.
- Read the wording carefully to avoid misinterpreting definitions.
Common Mistakes
- Assuming the unemployment rate is always defined as a percentage of the labour force. If so, the two percentages could not be added directly, and a more complex calculation would be needed. However, the phrasing 'unemployment rate of the 16–64 age group seeking work' signals that it is a proportion of the age group, not of the labour force.
- Confusing 'economically inactive' with 'unemployed'. The inactive are those not seeking work, while the unemployed are actively seeking work.
- Trying to calculate labour force participation without recognising that both percentages share the same denominator.
Things to Be Careful About
- In conventional statistics, the unemployment rate is unemployed / labour force * 100, and the employment rate is employed / working-age population * 100. When given alongside each other, you cannot simply add them unless you also know the labour force participation rate. In this question, the wording specifically makes both rates relative to the age group, allowing direct addition.
- Always check for alternative definitions in exam questions; the marking scheme confirms that the intended interpretation is the one that leads to option C.
Which statement relating to unemployment benefits provided by a government is not valid?
Options
A They allow firms to dismiss workers as unemployment benefits provide support to unemployed workers.
B They force firms to raise wages to encourage workers to work rather than relying on unemployment benefits.
C They provide a safety net to workers which might reduce their efforts to find a suitable job.
D They increase government spending and force it to raise taxes.
Reasoning
Unemployment benefits are a government transfer to the unemployed. They do not impose a direct cost on firms, so firms are not forced to raise wages. While the benefits may increase the reservation wage of workers, leading to upward pressure on wages, this is a market response, not a compulsion. Statements A, C, and D are valid consequences: A is valid because the safety net reduces the social cost of dismissal; C is valid because benefits can reduce the incentive to search for work; D is valid because benefits are a government expenditure that may require tax increases. Therefore, statement B is not a valid statement.
Answer
B
B
Background Concept
Unemployment benefits are payments made by the government to individuals who are out of work and meet certain eligibility criteria. They are a form of social insurance and a redistributive policy. The provision of such benefits has several economic consequences: it affects the behaviour of workers (e.g., search effort, reservation wage), the behaviour of firms (e.g., hiring and firing decisions), and the government's fiscal position. The reservation wage is the lowest wage a worker is willing to accept; unemployment benefits increase this wage, potentially reducing the labour supply. Moral hazard arises when the safety net reduces the incentive to find work quickly.
Understanding the Question
This multiple-choice question asks which of four statements about the effects of government-provided unemployment benefits is not valid. The candidate must evaluate each statement based on economic theory and identify the one that is either false or not a necessary consequence. The correct answer is B, which claims that benefits force firms to raise wages to encourage workers to work. This statement is not valid because firms are not compelled by the government to raise wages; the effect on wages is an indirect market outcome, not a direct force. The other statements are plausible and widely accepted.
Approach
I will evaluate each statement in turn, considering whether it is a valid economic consequence of unemployment benefits. The key is to distinguish between direct effects (e.g., government spending increases, safety net) and indirect market adjustments (e.g., wage changes). The statement that is not valid is likely the one that overstates the causal link or misrepresents the direction of the effect.
Step-by-Step Reasoning
Statement A: "They allow firms to dismiss workers as unemployment benefits provide support to unemployed workers."
- This is valid. When workers have a safety net, firms may face less resistance or social pressure when dismissing workers, because the unemployed are not left without any income. The benefit reduces the perceived cost of redundancy, making dismissal easier for firms. This is a recognised consequence.
Statement B: "They force firms to raise wages to encourage workers to work rather than relying on unemployment benefits."
- This statement is not valid. Unemployment benefits are paid by the government, not by firms. While it is true that generous benefits increase the reservation wage, firms may need to offer higher wages to attract workers, but this is a market adjustment, not a "force" imposed on firms. Moreover, the statement implies that firms are compelled to raise wages, which is not accurate. Firms can choose to pay lower wages and accept that some workers will remain on benefits. The link is indirect and dependent on the level of benefits and labour market conditions. Therefore, statement B is the one that is not valid.
Statement C: "They provide a safety net to workers which might reduce their efforts to find a suitable job."
- This is valid. This is the classic moral hazard problem: with income support, unemployed workers may search less intensively or be pickier about job offers, prolonging unemployment. This is a well-known unintended consequence.
Statement D: "They increase government spending and force it to raise taxes."
- This is valid. Unemployment benefits are a government expenditure, so they increase spending. To finance this, the government may need to raise taxes (or borrow, which eventually may require tax increases). This is a direct fiscal consequence.
Thus, the only statement that is not a valid economic consequence is B.
Key Takeaways
- Unemployment benefits have multiple effects: they provide a safety net, reduce the cost of job loss, increase the reservation wage, create moral hazard, and increase government spending.
- Not all effects are direct or compulsory; market adjustments are not equivalent to government mandates.
- When evaluating statements about policy, distinguish between necessary consequences and possible but contingent outcomes.
Common Mistakes
- Assuming that because unemployment benefits increase the reservation wage, firms are "forced" to raise wages, ignoring that the wage adjustment is a voluntary market response and not a legal requirement.
- Confusing the reservation wage effect with a direct cost on firms. The cost to firms is higher wages, but this is not a direct consequence of the benefit itself; it is an indirect effect via labour supply.
- Overlooking that statement A, C, and D are all standard economic arguments, while B is the only one that is not a core, widely accepted consequence.
Things to Be Careful About
- Read the question carefully: it asks for the statement that is not valid. Eliminate the valid ones first.
- Consider the wording: "force firms to raise wages" is a strong claim; economic reasoning often says benefits may put upward pressure on wages, but not that they force firms.
- Remember that unemployment benefits are a government transfer, not a firm cost, so the direct link to wages is not as straightforward as implied.
- In multiple-choice questions, the incorrect statement often contains an absolute or exaggerated claim.
Country X has a marginal propensity to consume (MPC) of 0.7. Its marginal propensity to save (MPS), marginal rate of taxation (MRT) and marginal propensity to import (MPM) are each 0.1.
What is likely to lead to the biggest increase in the national income multiplier?
Options
A a 5% increase in the MPC together with a 5% fall in the MRT
B a 5% increase in the MPM together with a 5% fall in the MRT
C a 5% increase in the MPS together with a 5% fall in the MPM
D a 5% increase in the MRT together with a 5% fall in the MPS
Working
The national income multiplier in an open economy with government is given by:
k = 1 / (MPS + MRT + MPM)
Initial values: MPS = 0.1, MRT = 0.1, MPM = 0.1, so k = 1 / 0.3 = 3.33.
Now evaluate each option, assuming a 5% change means the parameter is multiplied by 1.05 (increase) or 0.95 (decrease).
- Option A: 5% increase in MPC (to 0.735) and 5% fall in MRT (to 0.095). MPC is not a leakage, so total leakage = MPS + new MRT + MPM = 0.1 + 0.095 + 0.1 = 0.295. New multiplier = 1 / 0.295 = 3.39, an increase.
- Option B: 5% increase in MPM (to 0.105) and 5% fall in MRT (to 0.095). Total leakage = 0.1 + 0.095 + 0.105 = 0.3, unchanged, so multiplier unchanged.
- Option C: 5% increase in MPS (to 0.105) and 5% fall in MPM (to 0.095). Total leakage = 0.105 + 0.1 + 0.095 = 0.3, unchanged.
- Option D: 5% increase in MRT (to 0.105) and 5% fall in MPS (to 0.095). Total leakage = 0.095 + 0.105 + 0.1 = 0.3, unchanged.
Only Option A reduces the total leakage and therefore increases the multiplier. The same conclusion holds if the alternative formula k = 1/(1 - MPC + MRT + MPM) is used.
Answer
A
A
Background Concept
The national income multiplier measures the change in equilibrium national income resulting from a change in autonomous spending (e.g., investment, government spending, exports). In an open economy with a government that levies proportional taxes, the multiplier is reduced by leakages from the circular flow: saving, taxation, and imports. The marginal propensities to save (MPS), tax (MRT), and import (MPM) represent the fraction of each additional unit of income that is withdrawn from the spending stream. The multiplier is the reciprocal of the sum of these marginal propensities to withdraw: k = 1/(MPS + MRT + MPM). Alternatively, the formula can be expressed as k = 1/(1 - MPC + MRT + MPM) or k = 1/(1 - MPC(1 - MRT) + MPM), all of which are mathematically equivalent when the identity MPC + MPS + MRT + MPM = 1 holds. The key is that a smaller sum of leakages (or a smaller denominator) implies a larger multiplier.
Understanding the Question
The question provides initial values for MPC, MPS, MRT, and MPM, and asks which of four paired percentage changes (increase or decrease by 5% of the current value) would lead to the biggest increase in the multiplier. Each option involves two simultaneous changes. The answer requires calculating the effect of each change on the total leakage (or the denominator of the multiplier formula) and comparing the resulting multipliers. The command word "what is likely to lead to the biggest increase" implies a comparative evaluation of the options.
Approach
We will use the leakage formula k = 1/(MPS + MRT + MPM) because it directly shows that the multiplier increases when the total leakage falls. For each option, we compute the new values of the changed parameters, calculate the new total leakage, and determine the new multiplier. Options that leave total leakage unchanged do not increase the multiplier. Option A is the only one that reduces total leakage, so it yields the largest increase. We will also verify that the alternative formulas give the same result.
Step-by-Step Reasoning
-
Initial values: MPS = 0.1, MRT = 0.1, MPM = 0.1. Total leakage = 0.3, multiplier = 1/0.3 = 3.33.
-
Option A: Increase MPC by 5% to 0.735, fall MRT by 5% to 0.095. MPC is not a leakage, so total leakage = MPS + new MRT + MPM = 0.1 + 0.095 + 0.1 = 0.295. New multiplier = 1/0.295 = 3.39. Increase = 0.06.
-
Option B: Increase MPM by 5% to 0.105, fall MRT by 5% to 0.095. Total leakage = MPS + new MRT + new MPM = 0.1 + 0.095 + 0.105 = 0.3. No change in multiplier.
-
Option C: Increase MPS by 5% to 0.105, fall MPM by 5% to 0.095. Total leakage = new MPS + MRT + new MPM = 0.105 + 0.1 + 0.095 = 0.3. No change.
-
Option D: Increase MRT by 5% to 0.105, fall MPS by 5% to 0.095. Total leakage = new MPS + new MRT + MPM = 0.095 + 0.105 + 0.1 = 0.3. No change.
Thus, only Option A reduces the total leakage, increasing the multiplier. The alternative formulas (k = 1/(1 - MPC + MRT + MPM) and k = 1/(1 - MPC(1 - MRT) + MPM)) yield the same conclusion: Option A reduces the denominator, while the other options either leave it unchanged or increase it (decreasing the multiplier). The magnitude of the increase is largest for Option A.
Key Takeaways
- The multiplier is determined by the sum of marginal propensities to withdraw (leakages).
- To increase the multiplier, the total leakage must decrease. This can be achieved by reducing any of the leakages (MPS, MRT, MPM) or by increasing the MPC (which reduces the sum of leakages indirectly).
- When comparing simultaneous changes, compute the net effect on the total leakage or the denominator of the multiplier formula.
- The identity MPC + MPS + MRT + MPM = 1 is useful, but changes in one parameter may affect others; careful interpretation is needed.
Common Mistakes
- Confusing the multiplier formula: using k = 1/(1 - MPC) without accounting for taxes and imports. This would give a different initial multiplier and lead to incorrect comparisons.
- Interpreting the percentage changes as absolute percentage point changes (e.g., MPC increases by 5 percentage points from 0.7 to 0.75) rather than relative changes. The question says "5% increase", which is relative to the current value.
- Assuming that an increase in MPC always increases the multiplier, without considering that the other parameters might change simultaneously. In Option A, the fall in MRT reinforces the increase.
- Forgetting to check the net effect of the two changes; some options may have offsetting effects.
Things to Be Careful About
- Always write the correct multiplier formula for the given model. The syllabus includes the formula k = 1/(MPS + MRT + MPM) for an open economy with government.
- When a parameter is not in the leakage sum (like MPC), its effect on the multiplier must be considered through the alternative formula. However, in this question, the leakage formula suffices because only one option involves a change in MPC.
- Ensure that the percentage changes are applied correctly: multiply by 1.05 for an increase and by 0.95 for a decrease.
- The question asks for the "biggest increase", so check if any option actually decreases the multiplier; Option B and D decrease the multiplier under some formulas, but the focus is on increase.
- In the exam, a quick method is to notice that reducing any leakage increases the multiplier, and Option A is the only one that reduces a leakage (MRT) without increasing another leakage. Options B, C, and D involve opposite changes that cancel out in the total leakage.
The diagrams show the performance of an economy using different measures.
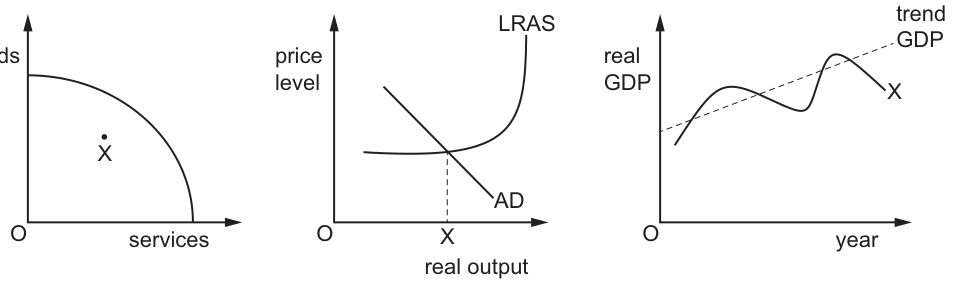
If an economy is currently at point X on each diagram, what is the most likely conclusion that can be made based on this evidence?
Options
A Prices will increase significantly as the economy grows in the near future.
B Supply-side policies would be the best option to encourage economic growth.
C The economy is currently experiencing a deflationary gap.
D There are shortages of skilled labour throughout the economy.
Reasoning
Point X inside the PPC shows underutilization of resources. In the AD/AS diagram, X is where AD meets the horizontal (Keynesian) part of LRAS, indicating a deflationary gap. The GDP graph shows actual GDP below trend, confirming a negative output gap. All three diagrams indicate the economy is operating below full capacity.
Answer
C
C
Background Concept
A production possibility curve (PPC) shows the maximum output combinations an economy can achieve when all resources are fully and efficiently employed. Any point inside the curve, such as X, represents underutilization of resources—typically unemployment and idle capacity—meaning the economy is producing less than its potential.
The AD/AS model depicts the relationship between the price level and real output. The long-run aggregate supply (LRAS) curve represents potential output at full employment. In the Keynesian range, LRAS is horizontal, indicating that increases in aggregate demand raise output without raising prices because spare capacity exists. When AD intersects this horizontal section, the economy has a deflationary (or recessionary) gap: equilibrium output is below potential output, and there is cyclical unemployment.
A time-series graph of real GDP against trend GDP shows the actual growth path relative to the long-run trend. When actual GDP lies below trend GDP, the economy is experiencing a negative output gap, producing less than its sustainable capacity.
Understanding the Question
The question presents three diagrams—a PPC, an AD/AS diagram, and a GDP time-series graph—all with point X marked. The task is to identify the single most likely conclusion that can be drawn from point X appearing in all three diagrams simultaneously. This requires recognizing that all three diagrams are depicting the same macroeconomic condition: the economy is operating below its full capacity.
Approach
Analyze each diagram individually to determine what point X represents, then synthesize the evidence:
- PPC: X is inside the curve → underutilization of resources.
- AD/AS: X is at the intersection of AD and the horizontal part of LRAS → deflationary gap.
- GDP graph: X is below trend GDP → negative output gap.
All three point to the same conclusion. Evaluate each option against this synthesized evidence.
Step-by-Step Reasoning
Diagram 1 (PPC): Point X lies inside the production possibility frontier. This indicates the economy is not producing efficiently; it has unemployed resources or is using its resources inefficiently. This is consistent with a recession or economic slowdown.
Diagram 2 (AD/AS): The LRAS curve has a horizontal section (Keynesian range) and a vertical section (classical range at full employment). Point X is located where the AD curve intersects the horizontal portion of LRAS. This means aggregate demand is insufficient to purchase all output that could be produced at full employment. The result is a deflationary gap—the amount by which AD must increase to close the gap between current equilibrium output and potential output.
Diagram 3 (GDP time series): The dashed trend line shows the long-run growth path. Point X is on the actual GDP line at a trough, below the trend line. This confirms the economy is in a downturn with a negative output gap.
Evaluating the options:
- Option A suggests prices will increase significantly. With a deflationary gap and spare capacity, there is downward pressure on prices or at least subdued inflation, not significant increases. This is incorrect.
- Option B suggests supply-side policies are the best option. While supply-side policies can shift LRAS rightward, the diagrams show a demand-deficient situation. The question asks for the most likely conclusion from the evidence, not the policy prescription. Moreover, demand-side policies would be more direct for closing a deflationary gap. This is not the best conclusion.
- Option C states the economy is experiencing a deflationary gap. This is consistent with all three diagrams: underutilized resources (PPC), AD below full employment (AD/AS), and actual GDP below trend (time series).
- Option D suggests shortages of skilled labour. A deflationary gap implies unemployment and surplus labour, not shortages. This is incorrect.
Therefore, C is the correct answer.
Key Takeaways
- A point inside the PPC indicates inefficiency and underutilization of resources.
- In the AD/AS model, a deflationary gap exists when AD intersects the horizontal (Keynesian) section of LRAS, indicating output below potential.
- Actual GDP below trend GDP indicates a negative output gap.
- All three diagrams are consistent with the economy being in a recessionary or deflationary state.
Common Mistakes
- Confusing the deflationary gap with an inflationary gap (where AD intersects the vertical section of LRAS).
- Misinterpreting point X on the PPC as being on the curve (efficient) rather than inside it (inefficient).
- Choosing option B because supply-side policies are associated with growth, without recognizing that the diagrams show a demand-side problem, or that the question asks for a descriptive conclusion rather than a policy recommendation.
- Choosing option D by confusing labour shortages with labour surplus in a recession.
Things to Be Careful About
- Ensure you distinguish between the horizontal (Keynesian) and vertical (classical) sections of the LRAS curve; point X is specifically on the horizontal part.
- Note that "deflationary gap" and "recessionary gap" are often used interchangeably, but the deflationary gap specifically refers to the demand shortfall below full employment.
- The GDP graph shows a "trough" which is a low point in the business cycle, consistent with a negative output gap.
Which row correctly identifies the characteristics of an economy experiencing the liquidity trap?
Options
| rate of economic growth | rate of inflation | rate of interest | |
|---|---|---|---|
| A | high | high | low |
| B | low | high | low |
| C | low | low | low |
| D | low | low | high |
Reasoning
A liquidity trap occurs when the central bank's monetary policy is ineffective because interest rates are already very low, so the opportunity cost of holding money is negligible. In such a situation, the economy is typically in a recession (low economic growth), with low inflation (or deflation), and low interest rates. Therefore, the correct combination is low growth, low inflation, low interest rate, which corresponds to row C.
Answer
C
C
Background Concept
A liquidity trap is a Keynesian concept that arises from the liquidity preference theory of the demand for money. According to this theory, people hold money for three motives: transactions (to make purchases), precautionary (for unexpected expenses), and speculative (to hold wealth in liquid form to take advantage of future changes in interest rates). When interest rates are very low, the opportunity cost of holding money is minimal, and the speculative demand for money becomes perfectly elastic – people are willing to hold any amount of money at that rate. As a result, an increase in the money supply cannot push interest rates any lower, and monetary policy becomes ineffective at stimulating aggregate demand. The economy is typically in a recessionary phase with low or negative growth, low inflation (or deflation), and near-zero interest rates.
Understanding the Question
The question asks to identify the correct combination of three macroeconomic indicators – rate of economic growth, rate of inflation, and rate of interest – that characterise an economy experiencing a liquidity trap. The options present four possible combinations. The candidate must recall the typical conditions associated with a liquidity trap and select the row that matches those conditions.
Approach
We need to recall the defining features of a liquidity trap: it is a situation where the economy is in a recession (low growth), inflation is low (often below target or deflationary), and the central bank has already set a very low interest rate (often near zero). Therefore, we can eliminate any row that shows high growth, high inflation, or high interest rates. The only row that contains all three attributes as low is row C.
Step-by-Step Reasoning
-
Review the rows:
- Row A: high growth, high inflation, low interest.
- Row B: low growth, high inflation, low interest.
- Row C: low growth, low inflation, low interest.
- Row D: low growth, low inflation, high interest.
-
Examine each characteristic:
- Rate of economic growth: In a liquidity trap, the economy is typically operating below potential, with a negative output gap. Hence, growth is low. This eliminates row A (high growth).
- Rate of inflation: A liquidity trap is associated with deficient demand, so inflation is low, often below target or even negative. This eliminates row B (high inflation).
- Rate of interest: The hallmark of the liquidity trap is that the central bank has reduced the policy interest rate to a low level (near zero) and cannot lower it further. This eliminates row D (high interest).
-
The only remaining row is C, which has all three characteristics low. This matches the textbook description of a liquidity trap.
Key Takeaways
- The liquidity trap is a situation where conventional monetary policy becomes ineffective because interest rates are already at or near zero.
- The macroeconomic conditions are recession (low growth), low inflation, and low interest rates.
- This concept is central to the Keynesian critique of monetary policy during deep recessions.
Common Mistakes
- Confusing the liquidity trap with high-inflation environments (e.g., stagflation) where growth is low but inflation is high – that would be row B, which is incorrect.
- Thinking that low interest rates must be accompanied by high growth – that would be row A, which is not the case in a liquidity trap.
- Forgetting that in a liquidity trap interest rates are low, not high – row D is a common distractor for those who misremember the concept.
Things to Be Careful About
- The liquidity trap is a specific Keynesian condition; do not confuse it with a general low-interest-rate environment that may still be effective for monetary policy.
- The question tests knowledge of the characteristics, not the policy implications. Be precise about the macroeconomic indicators.
- In multiple-choice questions, eliminate distractors systematically using each condition.
Which combination of policies would be most likely to bring a country out of recession?
Options
A expansionary fiscal and monetary policy as well as supply-side policies
B expansionary fiscal policy and tight monetary policy
C tight fiscal and monetary policy
D supply-side policies alone
Working
A recession is a period of falling real output and rising unemployment, typically caused by deficient aggregate demand (AD). The most effective policy mix to bring a country out of recession combines expansionary fiscal policy (higher government spending and/or lower taxes) and expansionary monetary policy (lower interest rates and/or quantitative easing) to boost AD, together with supply-side policies (e.g., deregulation, training, infrastructure) to increase long-run aggregate supply (LRAS) and potential output. This combination tackles both the immediate demand shortfall and the long-term productive capacity, making recovery more sustainable. Option A is the only one that includes both expansionary demand-side measures and supply-side measures. Option B pairs expansionary fiscal with tight monetary, which would offset the fiscal stimulus. Option C uses tight fiscal and monetary, worsening the recession. Option D relies solely on supply-side policies, which take time to affect output and do not address the immediate lack of demand.
Answer
A
A
Background Concept
A recession is a significant decline in economic activity, typically defined as two consecutive quarters of falling real GDP. It is characterised by high unemployment, low consumer and business confidence, and low aggregate demand. The standard Keynesian prescription for a recession is expansionary demand-side policies: expansionary fiscal policy (increasing government spending or cutting taxes) and expansionary monetary policy (lowering interest rates, increasing money supply, or quantitative easing). These policies aim to shift the aggregate demand (AD) curve to the right, raising output and employment. However, demand-side policies alone may lead to inflation if the economy is near full capacity. Supply-side policies (e.g., improving labour market flexibility, reducing regulation, investing in infrastructure and education) aim to increase the economy's productive capacity, shifting the long-run aggregate supply (LRAS) curve to the right. This can help sustain non-inflationary growth. In a recession, the best approach often combines expansionary demand-side policies to boost AD in the short run with supply-side policies to enhance potential output in the long run.
Understanding the Question
The question asks: "Which combination of policies would be most likely to bring a country out of recession?" It is a multiple-choice question with four options presenting different policy mixes. The key is to evaluate which combination is most effective in raising output and reducing unemployment. Option A includes expansionary fiscal and monetary policy (both demand-side) plus supply-side policies. Option B includes expansionary fiscal but tight monetary policy, which would work against each other. Option C includes tight fiscal and monetary policy (contractionary), which would deepen the recession. Option D includes only supply-side policies, which are long-term and do not address the immediate demand deficiency. The correct answer is A because it addresses both the short-run demand shortfall and the long-run potential output.
Approach
To answer this question, we need to understand the macroeconomic tools and their effects on aggregate demand and aggregate supply. We can use the AD-AS framework to analyse each option. For a recession, the economy is operating below potential output, with a negative output gap. The goal is to increase output towards potential. The most effective approach is to simultaneously boost AD (through expansionary fiscal and monetary policy) and increase LRAS (through supply-side policies). This combination minimises inflationary pressure because the increase in AD is matched by an increase in productive capacity. The other options are either contradictory, contractionary, or insufficient.
Step-by-Step Reasoning
-
Option A: Expansionary fiscal and monetary policy plus supply-side policies.
- Expansionary fiscal policy (e.g., increased government spending, tax cuts) shifts the AD curve to the right.
- Expansionary monetary policy (e.g., lower interest rates, quantitative easing) also shifts AD to the right.
- Supply-side policies (e.g., training, deregulation, infrastructure) shift the LRAS curve to the right.
- The combined effect: output rises significantly (from Y1 to Y2), and the increase in AD is partly accommodated by the increase in LRAS, so the price level may rise only moderately. This is the most effective and sustainable way to bring the economy out of recession.
-
Option B: Expansionary fiscal policy and tight monetary policy.
- Expansionary fiscal policy shifts AD right.
- Tight monetary policy (higher interest rates, reduced money supply) shifts AD left.
- The net effect on AD is ambiguous; it depends on the relative strengths. At best, there is little or no net increase in AD. This policy mix is contradictory and unlikely to effectively combat the recession.
-
Option C: Tight fiscal and monetary policy.
- Both policies are contractionary: fiscal tightening (reduced spending, higher taxes) shifts AD left; monetary tightening shifts AD left.
- This would reduce AD further, worsening the recession, increasing unemployment, and lowering output. This is the opposite of what is needed.
-
Option D: Supply-side policies alone.
- Supply-side policies shift LRAS right, increasing potential output.
- However, without a boost to AD, actual output may not increase because there is insufficient demand. The economy remains in a recession with a negative output gap. Supply-side policies are long-term and do not address the immediate demand deficiency. Hence, they are unlikely to bring the economy out of recession in the short run.
Therefore, Option A is the only combination that effectively addresses both the short-run demand shortfall and the long-run supply potential, making it the most likely to bring the country out of recession.
Key Takeaways
- A recession is characterised by deficient aggregate demand; therefore, expansionary demand-side policies are crucial for short-term recovery.
- Supply-side policies are important for long-term growth and can help sustain non-inflationary expansion, but they are not sufficient on their own to boost demand.
- Contradictory policy mixes (e.g., expansionary fiscal with tight monetary) are ineffective because they offset each other.
- The most effective policy mix to combat a recession combines expansionary fiscal and monetary policy to boost AD with supply-side policies to increase LRAS.
Common Mistakes
- Choosing Option D (supply-side policies alone) because of a belief that supply-side reforms solve all problems, ignoring the immediate need to boost demand.
- Choosing Option B (expansionary fiscal + tight monetary) without recognising that the two policies work against each other, leading to an ambiguous net effect.
- Confusing tight (contractionary) policies with expansionary ones, leading to selection of Option C.
- Thinking that any single policy is enough, without considering the synergy of combining demand-side and supply-side policies.
Things to Be Careful About
- Understand the difference between short-run and long-run effects: demand-side policies work quickly, while supply-side policies take time to materialise.
- In a recession, the primary problem is insufficient AD, so demand-side policies are essential; supply-side policies alone are insufficient.
- Be careful with the term "tight" – it means contractionary, not expansionary. Tight fiscal policy reduces AD, which is harmful in a recession.
- The AD-AS framework is a powerful tool to analyse the effects of policy combinations. Always consider shifts in both AD and AS curves.
- This question is a good example of why policy coordination matters: combining expansionary demand-side and supply-side policies yields the best outcome.
The inflation rate in a country increased.
Which effect would this most likely have on the country’s balance of payments?
Options
A an improvement in the current account balance
B an increase in price competitiveness
C an increase in export revenue
D an increase in import expenditure
Answer
Higher domestic inflation makes a country's goods and services relatively more expensive compared to those produced abroad. This reduces the price competitiveness of the country's exports, so export revenue is likely to fall (option C is incorrect). At the same time, imports become relatively cheaper, so the quantity of imports demanded rises, increasing import expenditure (option D is correct). The current account balance therefore worsens rather than improves (option A is incorrect). Price competitiveness is reduced, not increased (option B is incorrect). Hence, the most likely effect is an increase in import expenditure.
D
Background Concept
Inflation is a sustained increase in the general price level. When a country's inflation rate rises faster than that of its trading partners, its goods become less price-competitive internationally. This affects the balance of payments, specifically the current account, which records trade in goods and services, investment income, and transfers. A key relationship is that higher domestic inflation tends to worsen the current account because exports become more expensive for foreigners (so export demand falls) and imports become cheaper relative to domestic goods (so import demand rises).
Understanding the Question
The question asks: if inflation in a country increases, what is the most likely effect on its balance of payments? The four options offer specific outcomes: an improvement in the current account balance, an increase in price competitiveness, an increase in export revenue, or an increase in import expenditure. The task is to identify which of these is the direct and logical consequence of higher inflation. Note that the question says 'most likely', so we need the most direct immediate effect, not a secondary or indirect effect that might occur via exchange rate adjustments or other policy responses.
Approach
First, recall the basic mechanism: higher domestic inflation -> domestic goods become relatively more expensive than foreign goods. This has two effects: (1) exports become less competitive, so export revenue tends to fall; (2) imports become relatively cheaper, so import expenditure tends to rise. Both effects worsen the current account balance. Among the options, only D 'an increase in import expenditure' is a direct and plausible outcome. Option A (improvement) is the opposite. Option B (increase in price competitiveness) is the opposite of what happens. Option C (increase in export revenue) is also unlikely because exports become less competitive. Therefore, D is correct.
Step-by-Step Reasoning
- Start with the premise: inflation rate increases. This means the domestic price level rises relative to the price level in other countries (assuming no offsetting changes in exchange rates).
- Consider exports: domestic goods are now more expensive for foreign buyers. The price elasticity of demand for exports determines how much quantity demanded falls. Even if demand is inelastic, export revenue may not fall drastically, but the direction is downward. Thus, export revenue is likely to decrease, not increase. So option C is incorrect.
- Consider imports: foreign goods become relatively cheaper compared to domestic goods. Domestic consumers switch to imports, so the quantity of imports demanded rises. With higher quantity and possibly higher foreign prices (but not necessarily), import expenditure rises. This is the most direct and unambiguous effect. So option D is correct.
- Price competitiveness: higher inflation reduces price competitiveness, so option B is false.
- Current account balance: since exports fall and imports rise, the current account worsens (deficit increases or surplus decreases). So option A is false.
- Therefore, the most likely effect is an increase in import expenditure.
Key Takeaways
- Domestic inflation erodes international price competitiveness.
- Higher inflation tends to worsen the current account by reducing exports and increasing imports.
- The immediate effect on import expenditure is a direct consequence of relative price changes.
- This question tests the understanding of the causal link between inflation and the trade balance, a key concept in macroeconomic objectives and conflicts.
Common Mistakes
- Confusing the direction: thinking that inflation makes exports cheaper (it does the opposite).
- Assuming that the central bank will raise interest rates to counteract inflation, and then considering the effect of higher interest rates on the balance of payments (e.g., capital inflows). The question asks about the effect of the increase in inflation itself, not the policy response. Stay focused on the direct chain.
- Overlooking the distinction between nominal and real effects: inflation affects relative prices, which is the key.
- Choosing option A (improvement) because they think inflation makes exports cheaper (wrong).
Things to Be Careful About
- The question says 'most likely' – we are to pick the direct and immediate effect, not a secondary effect that might occur after exchange rate adjustments or policy interventions.
- Understand that the balance of payments includes the financial account, but the options focus on the current account. The effect on the current account is the most relevant.
- Do not assume that the exchange rate will adjust to maintain purchasing power parity; the question does not mention any change in the exchange rate, so we assume it remains constant initially.
- The answer is D, but note that 'increase in import expenditure' is not necessarily a net worsening of the balance of payments if exports also increase – but the logic says exports decrease, so it's a worsening. However, among the options, D is the only plausible direct effect.
A government uses monetary policy and fiscal policy to solve a problem of deflation.
Which policy combination is likely to be the most successful?
Options
| monetary policy | fiscal policy | |
|---|---|---|
| A | increasing interest rates | contractionary |
| B | increasing interest rates | expansionary |
| C | reducing interest rates | contractionary |
| D | reducing interest rates | expansionary |
Reasoning
Deflation is caused by insufficient aggregate demand. The appropriate response is expansionary policies: lower interest rates (monetary) and expansionary fiscal policy (higher spending or tax cuts). The only option that pairs both expansionary measures is D.
Answer
D
D
Background Concept
Deflation is a sustained fall in the general price level, typically associated with weak aggregate demand, falling output, and rising unemployment. In such a situation, macroeconomic policy aims to stimulate aggregate demand (AD) to push the economy back towards full employment and price stability.
Monetary policy involves changes in interest rates or the money supply. Cutting interest rates reduces the cost of borrowing, encouraging consumption and investment, and also tends to weaken the exchange rate, boosting net exports. All these increase AD. Contractionary monetary policy (raising rates) reduces AD.
Fiscal policy involves changes in government spending and taxation. Expansionary fiscal policy (higher spending or lower taxes) directly increases AD and/or boosts disposable income and consumption. Contractionary fiscal policy (spending cuts or tax rises) reduces AD.
To successfully combat deflation, both policies should be expansionary and work in the same direction. A mix of expansionary and contractionary policies would have conflicting effects, potentially offsetting each other and delivering a weaker overall stimulus.
Understanding the Question
The question presents a scenario: a government wants to use both monetary and fiscal policy to solve a problem of deflation. You are asked to select the policy combination from a table that pairs a monetary policy action (change in interest rates) with a fiscal policy stance (expansionary or contractionary). You need to determine which pair is most likely to succeed in raising AD and ending deflation.
The correct answer is D: reducing interest rates (expansionary monetary policy) combined with expansionary fiscal policy.
Approach
First, recall the effect of each policy action on aggregate demand. Deflation requires an increase in AD, so you are looking for policies that boost AD. Identify which of the four combinations has both policies expansionary. Then verify that the other combinations either do the opposite or mix contradictory stances.
Step-by-Step Reasoning
- Understand the problem: Deflation means falling prices, usually due to deficient AD. The goal is to increase AD.
- Identify expansionary policies:
- Monetary: reduce interest rates (expansionary). Increasing rates is contractionary.
- Fiscal: expansionary (increase spending or cut taxes). Contractionary fiscal reduces AD.
- Evaluate each option:
- Option A: increasing interest rates (contractionary) + contractionary fiscal -> both reduce AD, worsening deflation. Incorrect.
- Option B: increasing interest rates (contractionary) + expansionary fiscal -> contradictory; the monetary contraction will offset some or all of the fiscal expansion. The net effect on AD is uncertain and likely weaker than if both were expansionary. Incorrect.
- Option C: reducing interest rates (expansionary) + contractionary fiscal -> again contradictory; fiscal contraction dampens the monetary stimulus. Incorrect.
- Option D: reducing interest rates (expansionary) + expansionary fiscal -> both work to increase AD, providing a strong, consistent boost. This is the most successful combination. Correct.
Key Takeaways
- Deflation is combated with expansionary policies.
- Both monetary and fiscal policy can be used, but they must be consistently expansionary to maximise the impact on AD.
- Mixing expansionary and contractionary policies leads to conflict and reduced effectiveness.
- This question tests your understanding of the direction of policy effects.
Common Mistakes
- Confusing deflation with inflation: a common error is to think that deflation requires contractionary policies, but the opposite is true.
- Ignoring the consistency of the policy mix: even if one policy is expansionary, if the other is contractionary, the overall effect may be limited or nil.
- Misreading the table: option B and C each have one expansionary and one contractionary; some students might choose B or C because they see one expansionary policy, but fail to notice the contradictory component.
Things to Be Careful About
- Ensure you know the direction of change: “reducing interest rates” is expansionary; “expansionary fiscal policy” means increasing AD. Contractionary means reducing AD.
- For deflation, always pair expansionary with expansionary.
- Check all options before finalising; do not jump to a choice because one component seems correct.
The table shows indicators for the macroeconomies of two South American countries over one year. During this year, both governments attempted to reduce unemployment by expanding aggregate demand.
| country | GDP % change | current account balance % of GDP | change in currency units against US dollar |
|---|---|---|---|
| Argentina | 17.9 | 1.7 | -18.9 |
| Chile | 17.2 | -1.8 | -13.3 |
Based on the information given, what is the most likely reason why Argentina achieved a higher % change in the unemployment rate than Chile?
Options
A Argentina had a greater % change in GDP growth.
B Chile’s performance on the current account balance was worse.
C Each country had a weak exchange rate against the US dollar.
D Wage increases in each country were linked to their respective rates of inflation.
Answer
The data shows that Argentina had a higher percentage change in GDP (17.9%) than Chile (17.2%). An expansion in aggregate demand leads to higher GDP growth, which typically reduces unemployment through the relationship known as Okun's law. Therefore, the greater GDP growth in Argentina is the most likely reason for a larger reduction in unemployment (i.e., a higher percentage change in the unemployment rate). The other options are not directly supported by the data or do not provide a differential explanation.
A
Background Concept
Okun's law describes the empirical relationship between changes in the unemployment rate and changes in real GDP. In its simplest form, a 1% increase in the unemployment rate is associated with a roughly 2% decrease in GDP relative to potential. Conversely, higher GDP growth tends to reduce unemployment. When governments expand aggregate demand, they aim to boost real GDP and thereby lower unemployment.
Understanding the Question
The question presents data for Argentina and Chile: GDP growth rates, current account balances, and changes in currency values. Both governments expanded aggregate demand to reduce unemployment. The question asks why Argentina experienced a larger percentage change in the unemployment rate (likely a larger reduction) than Chile. We need to identify the most likely reason from the given options, using the data.
Approach
We examine each option against the data:
- Option A: Argentina had higher GDP growth (17.9% vs 17.2%). Higher GDP growth is directly linked to larger reductions in unemployment via Okun's law. This is a plausible differential explanation.
- Option B: Chile's current account deficit was worse (-1.8% vs Argentina's surplus of 1.7%). While a current account deficit may indicate an economy importing more than exporting, which could dampen GDP growth, the data already shows Chile's GDP growth is slightly lower. So this option is not a direct alternative explanation.
- Option C: Both currencies depreciated, but the depreciation was larger for Argentina. However, both had weak exchange rates, so this does not differentiate the unemployment outcomes.
- Option D: No information on wage increases or inflation is provided, so this cannot be inferred.
Thus, A is the most consistent with the data and economic theory.
Step-by-Step Reasoning
- The table shows Argentina's GDP growth (17.9%) is higher than Chile's (17.2%).
- Okun's law suggests that a higher rate of GDP growth leads to a larger decrease in the unemployment rate.
- Both governments expanded AD, so the difference in GDP growth is likely due to other factors, but the data shows Argentina's growth was higher.
- Therefore, the higher GDP growth in Argentina is the most likely reason for a larger reduction in unemployment.
- Option B: Chile's current account deficit is worse, but that does not directly cause a higher unemployment change; it could be a consequence of lower net exports, which might have reduced GDP growth, but that is already captured in the GDP figures.
- Option C: Both currencies depreciated, which could boost exports and AD, but the depreciation is larger for Argentina, which might have contributed to higher GDP growth, but the question asks for the most likely reason, and GDP growth is the direct measure.
- Option D: No data on wages or inflation, so it cannot be determined.
Hence, the correct answer is A.
Key Takeaways
- The relationship between GDP growth and unemployment is central to macroeconomics: higher growth typically reduces unemployment.
- When comparing two countries, look for differential factors that explain differences in outcomes.
- Data interpretation requires linking economic theory to the numbers provided.
Common Mistakes
- Misinterpreting the phrase 'higher % change in the unemployment rate' as a larger increase rather than a larger decrease. The context of governments trying to reduce unemployment clarifies that it means a larger reduction.
- Choosing Option C because both currencies are weak, but that does not explain the difference.
- Overlooking the importance of GDP growth as the most direct indicator.
Things to Be Careful About
- Read the question carefully: 'higher % change in the unemployment rate' could be ambiguous; use the context to infer the intended meaning.
- Ensure that the chosen option is supported by the data presented, not by general knowledge alone.
- Avoid introducing extraneous factors not mentioned in the data.
A measure encourages consumers to change spending on imports to spending on domestically produced goods.
What does this describe?
Options
A an expenditure-reducing policy
B an expenditure-switching policy
C the law of comparative advantage
D the Marshall–Lerner condition
Answer
The description refers to a policy that encourages consumers to switch their spending from imports to domestically produced goods. This is the definition of an expenditure-switching policy. Such policies include tariffs, quotas, and exchange rate adjustments that make imports relatively more expensive or domestic goods relatively cheaper.
Option A, an expenditure-reducing policy, aims to reduce total spending (e.g., through contractionary fiscal or monetary policy) to reduce imports, but does not involve switching. Option C, the law of comparative advantage, explains the gains from trade, not a policy to change the composition of spending. Option D, the Marshall-Lerner condition, is a condition for a currency depreciation to improve the trade balance, not a policy itself.
Therefore, the correct answer is B.
B
Background Concept
Expenditure-switching policies are government measures designed to alter the composition of spending between domestic goods and foreign goods. They work by making imports relatively more expensive or exports relatively cheaper, thereby encouraging consumers and firms to buy domestically produced goods instead of imports. Examples include tariffs, import quotas, subsidies to domestic industries, and devaluation or depreciation of the exchange rate. In contrast, expenditure-reducing policies aim to reduce the overall level of spending in the economy (e.g., through deflationary fiscal or monetary policy) to reduce the demand for imports, without necessarily changing the relative prices of domestic and foreign goods.
Understanding the Question
The question provides a direct description: "A measure encourages consumers to change spending on imports to spending on domestically produced goods." This is a clear definition of an expenditure-switching policy. The four options are: expenditure-reducing policy, expenditure-switching policy, law of comparative advantage, and Marshall-Lerner condition. The task is to identify which one matches the description.
Approach
Recognise that the key phrase is "change spending on imports to spending on domestically produced goods" – this involves switching, not reducing total spending. Therefore, the answer is expenditure-switching policy. The other options are related but distinct concepts.
Step-by-Step Reasoning
- Read the description carefully: It says "encourages consumers to change spending on imports to spending on domestically produced goods." This implies a reallocation of existing spending, not a reduction in total spending.
- Consider option A: Expenditure-reducing policy – This reduces aggregate demand to lower import demand, but does not necessarily cause a switch to domestic goods. The focus is on reducing total expenditure, not switching. So it's incorrect.
- Option B: Expenditure-switching policy – This exactly matches the description: it shifts expenditure from imports to domestic goods. Common tools include tariffs, quotas, subsidies, and exchange rate changes. This is correct.
- Option C: Law of comparative advantage – This is a theory explaining why countries benefit from trade by specializing in what they produce relatively more efficiently. It does not describe a policy to change spending patterns. Incorrect.
- Option D: Marshall-Lerner condition – This is a condition (sum of price elasticities of demand for exports and imports > 1) that must hold for a currency depreciation to improve the trade balance. It is not a policy measure. Incorrect.
Thus, the correct answer is B.
Key Takeaways
- Expenditure-switching policies directly alter relative prices to encourage domestic consumption over imports.
- Expenditure-reducing policies reduce overall spending to lower imports.
- The Marshall-Lerner condition is a criterion for the effectiveness of exchange rate policy, not a policy itself.
- The law of comparative advantage is a theory of trade, not a policy.
Common Mistakes
- Confusing expenditure-switching with expenditure-reducing: a common error is to think that any policy that reduces imports must be expenditure-reducing, but if it does so by making domestic goods more attractive, it is switching.
- Thinking that the Marshall-Lerner condition is a policy; it is a condition that must hold for a devaluation/depreciation (which is a switching policy) to work.
- Associating the law of comparative advantage with policy; it is a theoretical concept.
Things to Be Careful About
- Pay attention to the wording: "change spending on imports to spending on domestically produced goods" is a switch, not a reduction.
- Know the definitions of the four terms precisely.
- In multiple-choice questions, eliminate options that are not policies or not relevant to the description.
The macroeconomic objective of a government is to move the current account of the balance of payments from deficit to surplus. To achieve this, it devalues the currency.
Under which condition would a devaluation of the currency achieve this objective?
Options
A if the combined price elasticity of demand for exports and imports is greater than 1
B if the combined price elasticity of demand for exports and imports is less than 1
C if the income elasticity of demand is less than 1
D if other countries decide to impose tariffs on all imported goods and services
Answer
The Marshall-Lerner condition states that a devaluation (or depreciation) will improve the current account of the balance of payments if the sum of the price elasticities of demand for exports and imports (in absolute values) is greater than 1. This is because the volume effect of the devaluation (more exports sold, fewer imports bought) must outweigh the price effect (exports earn less per unit in foreign currency, imports cost more per unit in domestic currency).
Option A correctly states this condition. Option B is the opposite – if the sum is less than 1, the current account would worsen. Option C refers to income elasticity, which is irrelevant to the direct price effect of a devaluation. Option D refers to foreign tariffs, which reduce the effectiveness of a devaluation but are not a condition for devaluation itself to work.
Answer
A
A
Background Concept
The Marshall-Lerner condition is a key concept in international economics that determines whether a change in the exchange rate (devaluation or depreciation) will improve a country’s trade balance (current account). It focuses on the price elasticities of demand for exports and imports. Price elasticity of demand measures the responsiveness of quantity demanded to a change in price. For exports, a devaluation makes them cheaper for foreign buyers, so the quantity demanded rises. For imports, a devaluation makes them more expensive for domestic buyers, so quantity demanded falls. The condition says that the sum of the absolute values of these elasticities must exceed 1 for the trade balance to improve. If the sum is exactly 1, the balance stays the same; if less than 1, it worsens.
Understanding the Question
The question presents a government objective: move the current account from deficit to surplus. The policy tool is a devaluation of the currency. We are asked to identify the condition under which this devaluation will achieve the objective. The four options present different elasticity or trade policy conditions. Option A and B refer to the combined price elasticities of exports and imports (Marshall-Lerner). Option C introduces income elasticity, which is not directly related to the price effect of a devaluation. Option D is about foreign countries imposing tariffs, which is a separate policy that could reduce import demand but is not a condition for the devaluation to work; in fact, tariffs work against the purpose of a devaluation by limiting trade. The correct condition is the Marshall-Lerner condition: the sum of the price elasticities of demand for exports and imports (in absolute value) must be greater than 1.
Approach
Recognise that the question tests the Marshall-Lerner condition directly. Eliminate options that do not relate to price elasticities. Then confirm that option A states the correct inequality and option B states the reverse. Be careful: the wording "combined price elasticity of demand for exports and imports" means the sum of the two elasticities. The condition requires this sum > 1 (in absolute value, but since both are negative in sign, the absolute values are used).
Step-by-Step Reasoning
-
The current account is affected by changes in the volume and price of exports and imports. After a devaluation, exports become cheaper in foreign currency, increasing the volume sold; imports become more expensive in domestic currency, decreasing the volume bought. These volume changes tend to improve the trade balance. However, the price effect works in the opposite direction: for exports, each unit earns less foreign currency (so a given volume brings in less revenue); for imports, each unit costs more domestic currency (so a given volume costs more). The net effect depends on the elasticities.
-
Let PEDx and PEDm be the absolute values of price elasticity of demand for exports and imports respectively. The Marshall-Lerner condition is: PEDx + PEDm > 1. This ensures that the positive volume effect outweighs the negative price effect, so the trade balance improves.
-
Option A: "if the combined price elasticity of demand for exports and imports is greater than 1" – this exactly means PEDx + PEDm > 1, so correct.
-
Option B: "less than 1" would make the condition fail, so the trade balance would worsen – incorrect.
-
Option C: income elasticity of demand (YED) measures responsiveness to changes in income, not to price changes. A devaluation does not directly change income, so YED is irrelevant to the direct effect – incorrect.
-
Option D: other countries imposing tariffs reduces the volume of exports (since tariffs make exports more expensive in foreign markets), which would counteract the devaluation's effect. This is not a condition for devaluation to work but rather a hindrance – incorrect.
Thus, the answer is A.
Key Takeaways
- The Marshall-Lerner condition is the fundamental criterion for whether a devaluation or depreciation improves the trade balance.
- The condition involves the sum of absolute price elasticities of exports and imports.
- Understand that other factors (income elasticities, foreign tariffs) can affect the outcome but do not define the condition.
Common Mistakes
- Confusing the condition as "sum greater than zero" or "each elasticity greater than 1" – it's the sum that matters, not each individually.
- Selecting option B by misremembering the inequality.
- Choosing option D because tariffs reduce imports, but tariffs are not the condition for devaluation to work; they are a separate trade barrier that could reduce exports and worsen the balance, not a condition.
Things to Be Careful About
- The question asks for the condition under which a devaluation would achieve the objective (improve the current account). Focus on the direct effect of devaluation, not the broader trade policy context.
- Price elasticities are negative but we consider absolute values when summing.
- Option C's reference to income elasticity is a distractor; always tie the effect to the policy instrument (devaluation changes relative prices, not income).
A multinational company (MNC) buys a manufacturing firm in a developing country that produces goods for the developing country’s domestic consumers. The MNC then exports machinery and raw materials that it needs to the developing country.
What is the most likely consequence of this foreign direct investment (FDI) by the MNC on the balance of payments of the developing country?
Options
| current account | financial account | |
|---|---|---|
| A | improves | improves |
| B | improves | worsens |
| C | worsens | improves |
| D | worsens | worsens |
Working
The MNC buys a manufacturing firm in the developing country. This purchase is a capital inflow into the developing country — a credit on the financial account — so the financial account improves.
The MNC then exports machinery and raw materials to the developing country. These are imports for the developing country, which are a debit on its current account, so the current account worsens.
Answer
C
C
Background Concept
The balance of payments records all economic transactions between residents of one country and the rest of the world over a period. It has two main accounts:
- Current account: records trade in goods and services (exports and imports), income flows, and current transfers. Exports are credits (positive), imports are debits (negative).
- Financial account: records cross-border purchases and sales of financial and physical assets — shares, bonds, real estate, and direct investment. A capital inflow (foreigners buying domestic assets) is a credit; a capital outflow (domestics buying foreign assets) is a debit.
Foreign Direct Investment (FDI) occurs when a firm from one country acquires a lasting interest in an enterprise in another country — typically by buying a company, building a factory, or establishing a subsidiary. FDI appears in the financial account as a capital inflow for the host country.
Understanding the Question
The question describes two distinct transactions by the MNC:
- It buys a manufacturing firm in the developing country.
- It then exports machinery and raw materials to that developing country.
We are asked: what is the most likely consequence of this FDI on the developing country's balance of payments? The answer requires tracking each transaction to the correct account and determining whether it is a credit (improvement) or a debit (worsening).
Approach
- Identify the balance of payments account affected by the purchase of the firm.
- Identify the account affected by the import of machinery and raw materials.
- Determine the direction of each flow and whether it improves or worsens the account.
- Match the combination to the options.
Step-by-Step Reasoning
Step 1: The purchase of the manufacturing firm
The MNC is buying an asset in the developing country. This is a capital inflow — foreign money entering the country to purchase a domestic asset. In the balance of payments, this is recorded as a credit on the financial account. A credit improves the financial account balance. So the financial account improves.
Step 2: The export of machinery and raw materials
The MNC sends machinery and raw materials to the developing country. From the developing country's perspective, these are imports — goods coming into the country from abroad. Imports are recorded as a debit on the current account. A debit worsens the current account balance. So the current account worsens.
Step 3: Combining the effects
- Current account: worsens (due to imports)
- Financial account: improves (due to capital inflow from the purchase)
This matches option C.
Why the other options are wrong:
- A (both improve): Incorrect because the imports worsen the current account.
- B (current improves, financial worsens): Incorrect because the purchase is a capital inflow (improves financial), and the imports worsen the current.
- D (both worsen): Incorrect because the purchase is a capital inflow, which improves the financial account.
Key Takeaways
- FDI typically involves a capital inflow (financial account credit) for the host country.
- The subsequent imports of machinery and raw materials by the MNC are recorded as imports on the host country's current account (debit).
- A single FDI project can have opposite effects on the two main accounts of the balance of payments.
- Always track the direction of the flow from the perspective of the country in question.
Common Mistakes
- Confusing the direction of the flow: thinking the MNC's export of machinery is an export for the developing country (it is an import).
- Forgetting that the purchase of a firm is a financial account transaction, not a current account transaction.
- Assuming FDI only improves the balance of payments overall, without considering the separate effects on each account.
Things to Be Careful About
- The question asks about the developing country's balance of payments, not the MNC's home country.
- The two transactions are separate and affect different accounts — do not net them off.
- The phrase "most likely consequence" signals that there could be other effects (e.g., future export earnings from the factory), but the immediate, direct effect is what is asked.
The table gives information about the population of three countries in a given year.
| birth rate per 1000 | death rate per 1000 | infant mortality rate per 1000 | % of population under 16 | |
|---|---|---|---|---|
| Singapore | 12 | 4 | 5 | 18 |
| Hong Kong | 15 | 6 | 8 | 20 |
| China | 20 | 9 | 28 | 38 |
Which conclusion can be drawn about the countries in the table in that year?
Options
A China had the highest percentage of children who died in infancy.
B People in Hong Kong lived the longest.
C Singapore had the largest number of people aged over 16.
D The population of Singapore was expected to fall in the next five years.
Reasoning
The infant mortality rate is the number of deaths of infants under one year old per 1000 live births. China has an infant mortality rate of 28 per 1000, which is higher than Singapore's 5 and Hong Kong's 8. Therefore, China had the highest percentage of children who died in infancy.
Option B is not supported because death rate alone does not indicate life expectancy; it is influenced by age structure. Option C cannot be concluded because the table gives percentages, not absolute numbers. Option D cannot be concluded because birth rate exceeds death rate in Singapore (12 > 4), so population is expected to grow, not fall.
Answer
A
A
Background Concept
Demographic indicators such as birth rate, death rate, and infant mortality rate are used to compare population characteristics across countries. The infant mortality rate specifically measures the number of infant deaths (under one year) per 1000 live births, providing insight into healthcare quality and child survival.
Understanding the Question
The table provides four indicators for three countries. The question asks which conclusion can be drawn from the data. Each option makes a claim that must be directly supported or refuted by the given numbers.
Approach
Evaluate each option against the data. For A, compare infant mortality rates. For B, consider whether death rate alone determines longevity. For C, note that percentages do not give absolute numbers. For D, compare birth and death rates to infer population growth.
Step-by-Step Reasoning
- Option A: Infant mortality rate is highest in China (28) compared to Singapore (5) and Hong Kong (8). So China had the highest percentage of children dying in infancy. This is directly supported.
- Option B: Death rate is lowest in Singapore (4), but life expectancy depends on many factors, not just crude death rate. The death rate is affected by age structure; a younger population may have a lower death rate even if life expectancy is lower. So we cannot conclude that people in Hong Kong lived the longest.
- Option C: The table gives percentage of population under 16, not absolute numbers. Without total population figures, we cannot compare the number of people over 16.
- Option D: Singapore's birth rate (12) is higher than death rate (4), so natural increase is positive. The population is expected to grow, not fall. Even if net migration is unknown, the conclusion is not supported.
Key Takeaways
- Understand what each demographic rate measures.
- Distinguish between rates and absolute numbers.
- Be cautious about inferring life expectancy from crude death rate.
Common Mistakes
- Assuming that a lower death rate always means longer life expectancy.
- Confusing percentages with absolute numbers.
- Ignoring that birth and death rates alone do not determine population change if migration is significant.
Things to Be Careful About
- Infant mortality rate is per 1000 live births, not per 1000 population.
- The conclusion must be directly drawn from the data, not from external knowledge.
During a certain period, a country with a constant population expands its output per head. It also experiences a significant increase in river and atmospheric pollution.
In the absence of any other changes, which measure would show a decrease in living standards?
Options
A Gross Domestic Product per head
B Gross National Product per head
C Human Development Index
D Measure of Economic Welfare
Reasoning
Output per head is rising, so both GDP per head and GNP per head would increase, not decrease. The Human Development Index (HDI) includes education and life expectancy, which are not directly affected by pollution; it would also likely increase. The Measure of Economic Welfare (MEW) adjusts for negative externalities such as pollution, so it could decrease despite rising output.
Answer
D
D
Background Concept
Living standards are not captured solely by monetary measures like GDP per head. Alternative indicators such as the Measure of Economic Welfare (MEW) adjust for factors that affect well-being but are not included in national income accounts, such as environmental degradation, unpaid work, and leisure. The Human Development Index (HDI) combines income, health, and education but does not directly account for pollution or sustainability.
Understanding the Question
The question describes a country where output per head is rising but pollution is also increasing significantly. With no other changes, we are asked which measure of living standards would show a decrease. The key is to recognise that pollution is a negative externality that reduces welfare but is not subtracted from GDP or GNP. The HDI focuses on health, education, and income — pollution could affect health in the long run, but the question states no other changes, so short-run health effects are not considered. The MEW explicitly deducts the costs of pollution and other social costs, so it is the only measure likely to fall.
Approach
Identify the features of each option:
- A: GDP per head increases with output per head, so it would not decrease.
- B: GNP per head also increases with output per head (same as GDP in this case, no foreign income difference mentioned).
- C: HDI would rise because income per head increases, and health/education are unchanged (no other changes).
- D: MEW adjusts for negative externalities, so the pollution cost would reduce the measure, possibly making it fall despite rising output.
Thus, D is correct.
Step-by-Step Reasoning
- Output per head is rising → GDP per head and GNP per head increase (both are monetary measures of output).
- GNP per head is the same as GDP per head adjusted for net income from abroad; no such change is mentioned, so it also increases.
- HDI components: income per head (rising), life expectancy (unchanged), education (unchanged). The index would rise.
- MEW starts from GDP, then adjusts for factors like pollution, urbanisation, and other social costs. Significant pollution increases would be subtracted, so MEW could fall even though GDP rises. The question asks which measure would show a decrease — MEW is the only one that includes the negative effect of pollution.
Therefore, the correct answer is D.
Key Takeaways
- GDP per head is a poor measure of living standards because it ignores externalities, distribution, and non-market activities.
- MEW and similar measures (Genuine Progress Indicator) attempt to incorporate environmental and social costs.
- HDI captures a broader set of dimensions but still does not reflect environmental quality.
- When evaluating living standards, consider what is included and excluded from each measure.
Common Mistakes
- Choosing HDI: students may think HDI includes environment, but it does not; only health, education, and income.
- Thinking GDP per head is the best measure of welfare; it only measures output, not well-being.
- Overlooking the specific wording: “in the absence of any other changes” means we cannot assume pollution affects health or education in the short run.
Things to Be Careful About
- Distinguish between GDP and GNP; they differ only by net foreign income, which is not relevant here.
- Note that the question says “constant population”, so per head and total measures move together.
- MEW is not a standard composite indicator like HDI; it is a specific adjustment to GDP. Recognise its purpose.
Your score so far
Answer a question to start scoring
Your marks add up here as you work through the paper.