Economics 9708/42 — February/March 2024
Cambridge A-Level · A Level Data Response and Essays · worked solutions for every part, with the mark scheme
Topics Government Policies to Correct Market Failure · Efficiency and Market Failure · Equity, Poverty and Redistribution · Externalities, Social Costs and Benefits · Wage Determination and Labour Market Intervention · Money and Banking · +3 more
French electricity prices
In 2022 the French government ordered a large electricity company, partly owned by the state, to sell more electricity at lower prices than its rivals. The company said this would have a negative impact on its profits and result in a decrease in the value of the company’s shares owned by the private sector.
Competitors in electricity supply in France are allowed to buy power from this company at a 40% discount due to its monopoly position. The government instructed the company to increase the amount they must sell to competitors at the discounted market price.
The government also cut taxes on electricity to try to keep the increase in prices for households and small businesses to 4%, rather than the expected 35%, without any government action.
As well as producing electricity in France, the company owns nuclear power stations and gas-fired power stations in the UK and supplies 11% of the UK’s electricity.
A global shortage of natural gas supplies caused a crisis, pushing up electricity prices. Much electricity is produced in gas-fired power plants. The situation was worsened by faults in the electricity-producing nuclear power plants in both the UK and France.
In January 2022 alone, a further five nuclear power plants in France were forced to close. That meant that 18 of the 56 plants had closed; a worrying proportion for a company that derives 70% of its electricity output from nuclear power. The plants were old. Corrosion caused safety fears and the closures restricted supplies.
Previously, the nuclear power plants put France in a strong self-sufficient position of which other European countries can only dream. The UK, for example, has to import expensive gas to produce electricity, where the price rise was expected to be not 35%, as in France, but 56%. However, the cost to the French government of reducing the electricity price affected its ability to finance renewable energy projects as well as build a new generation of nuclear reactors.
The government claimed the benefit was that they rescued millions of households from the prospect of excessive rises in electricity prices.
Source: The Daily Telegraph, 15 January 2022
Identify what caused the rise in the electricity prices and explain whether it can be concluded from the article that the price rise was an example of market failure.
Answer
The rise in electricity prices was caused by a global shortage of natural gas supplies, which pushed up gas prices, and by faults in nuclear power plants in both France and the UK, reducing supply. (2 marks)
Market failure occurs when the price mechanism fails to allocate resources efficiently, leading to allocative inefficiency. In this case, the price rise is a result of supply-side shocks (reduced supply of gas and nuclear power). The price mechanism is responding to scarcity by raising prices, which is its proper function. There is no evidence of externalities, public goods, or information asymmetries causing the price rise. Therefore, it cannot be concluded that the price rise is an example of market failure. (3 marks)
The price rise was caused by a natural gas shortage and nuclear plant faults; it is not an example of market failure because the price mechanism is working correctly in response to supply shocks.
Background Concept
Market failure occurs when the price mechanism (the interaction of demand and supply) fails to allocate resources efficiently, resulting in a net welfare loss to society. Common causes include externalities, public goods, information asymmetries, and monopoly power. A price rise caused by a supply shock is not market failure; it is the market signalling scarcity and allocating resources accordingly. Allocative efficiency requires that price equals marginal social cost, which may still hold after a supply shock if the price reflects the new marginal cost.
Understanding the Question
The question asks to identify the causes of the electricity price rise from the article and then to explain whether this price rise is an example of market failure. The article mentions two main causes: a global shortage of natural gas and faults in nuclear power plants. The second part requires applying the definition of market failure to decide if the price rise itself constitutes market failure. The command words are "identify" and "explain whether", so we need to give a clear yes/no with reasoning.
Approach
First, extract the causes directly from the text: natural gas shortage and nuclear plant closures. Then, define market failure precisely. Finally, argue that because the price rise is a result of supply-side shocks affecting costs, the market is working correctly; there is no evidence of externalities or other failures. Therefore, it is not market failure. The answer should be structured in two parts: causes and then the explanation.
Step-by-Step Reasoning
- Read the article: "A global shortage of natural gas supplies caused a crisis, pushing up electricity prices. Much electricity is produced in gas-fired power plants. The situation was worsened by faults in the electricity-producing nuclear power plants in both the UK and France." This directly gives the two causes.
- Define market failure: A failure of the market to allocate resources efficiently, leading to a net loss of welfare. The key is allocative inefficiency, where price does not equal marginal social cost.
- Apply to the case: The price rise is due to increased costs (higher gas prices, reduced nuclear output). These are supply-side changes. The market is responding to scarcity by increasing price, which is the correct signal. There is no evidence of externalities (e.g., pollution not priced) or other market failures that would cause the price to be wrong. The price rise is a natural market adjustment, not a failure.
- Conclusion: Therefore, the price rise is not an example of market failure.
Key Takeaways
- Supply shocks cause price increases, and this is a normal market function.
- Market failure is about allocative inefficiency, not just any price change.
- Always distinguish between causes of price changes and whether the market is failing.
Common Mistakes
- Confusing a price rise caused by supply shortage with market failure. Many students think any price rise is a failure, but it is not.
- Failing to define market failure properly before applying it.
- Not extracting both causes from the extract.
Things to Be Careful About
- Use the exact evidence from the article.
- Provide a clear definition of market failure.
- Make a clear judgement: "It is not market failure."
Is there any evidence in the article that the French government’s decisions will increase competition or efficiency in the energy market?
Answer
There is some evidence that competition may increase: competitors are allowed to buy electricity at a 40% discount, and the government instructed the company to increase the amount sold at discounted prices, making it easier for rivals to compete. (1 mark)
However, there is no clear evidence of increased efficiency. The government's actions reduced the company's profits, which could limit funds for investment and thus reduce dynamic efficiency. Additionally, the article states that the cost to the government of reducing electricity prices affected its ability to finance renewable energy projects, which could reduce future efficiency. The closure of nuclear plants due to poor maintenance also indicates inefficiency in production. (2 marks)
Conclusion: There is some evidence of potential for increased competition, but no evidence of increased efficiency. (1 mark)
Some evidence of increased competition, but no evidence of increased efficiency.
Background Concept
Competition refers to the presence of multiple firms in a market, which can lead to lower prices and better quality. Efficiency includes productive efficiency (producing at minimum average cost), allocative efficiency (producing where price equals marginal cost), and dynamic efficiency (investment in innovation and cost reduction over time). Government intervention can affect both competition and efficiency.
Understanding the Question
The question asks whether there is evidence in the article that the French government’s decisions will increase competition or efficiency in the energy market. The key actions are: ordering the state-owned company to sell more electricity at lower prices to competitors, and cutting taxes on electricity. We need to examine the article for evidence of effects on competition and efficiency.
Approach
First, look for evidence that competition might increase: the discounted sales to competitors. Then, look for evidence that efficiency might be affected: the impact on profits, renewable energy funding, and the closure of nuclear plants. Conclude that competition may increase, but efficiency is not clearly improved and may even decrease.
Step-by-Step Reasoning
- Competition: The article says "Competitors in electricity supply in France are allowed to buy power from this company at a 40% discount due to its monopoly position. The government instructed the company to increase the amount they must sell to competitors at the discounted market price." This makes it cheaper for rivals to source electricity, potentially increasing competition.
- Efficiency: The article notes that the company said the lower prices would reduce profits, which could reduce investment in new technology (dynamic efficiency). Also, "the cost to the French government of reducing the electricity price affected its ability to finance renewable energy projects as well as build a new generation of nuclear reactors." This reduces future efficiency. The closure of nuclear plants due to corrosion suggests poor maintenance and inefficiency.
- Conclusion: There is evidence of increased competition, but no evidence of increased efficiency; if anything, efficiency may be harmed.
Key Takeaways
- Competition can be increased by ensuring rivals have access to inputs.
- Efficiency is separate from competition; increased competition does not automatically increase efficiency.
- Dynamic efficiency depends on investment, which can be harmed by profit-reducing regulation.
Common Mistakes
- Assuming that lower prices automatically mean more efficiency; they may just be a transfer.
- Not distinguishing between competition and efficiency.
- Failing to extract specific evidence from the article.
Things to Be Careful About
- Use the article's evidence explicitly.
- Be clear about the conclusion: competition has some evidence, efficiency has none.
- The mark scheme allows for the possibility of a fall in efficiency, so mention that.
Answer
Economic equality refers to the equal distribution of income, wealth, or opportunities among individuals in a society. It is a quantitative concept that can be measured, e.g., using the Gini coefficient or Lorenz curve. (1 mark)
Equity, on the other hand, is a normative concept of fairness or justice. It concerns whether the distribution of resources is considered fair, even if it is not equal. For example, a progressive tax system may be considered equitable even though it results in unequal after-tax incomes. (1 mark)
The key distinction is that equality is about sameness, while equity is about fairness. (1 mark)
Equality is the equal distribution of income/wealth; equity is fairness/justice in distribution.
Background Concept
In economics, equality and equity are often confused. Equality is an objective, measurable concept: it refers to the state of being equal, especially in economic outcomes like income and wealth. Equity is a subjective, normative concept: it refers to what is considered fair or just. A distribution can be equal but not equitable (e.g., everyone gets the same amount of food, but one person needs more due to health), or equitable but not equal (e.g., need-based welfare payments).
Understanding the Question
The question asks to distinguish between equality and equity. This is a straightforward definitional question worth 3 marks. The command word is "distinguish", so we need to highlight the differences clearly.
Approach
Define each term separately, then explicitly contrast them. Provide examples to illustrate the difference.
Step-by-Step Reasoning
- Equality: Equal distribution of income, wealth, or opportunities. Can be measured with the Gini coefficient. Example: everyone gets the same government grant.
- Equity: Fairness in distribution, often based on need or contribution. It is subjective. Example: giving more benefits to the poor is equitable.
- Distinction: equality is about sameness; equity is about fairness. They are not the same.
Key Takeaways
- Equality is positive (measurable), equity is normative (value judgement).
- Policies that aim for equality may not achieve equity, and vice versa.
Common Mistakes
- Using the terms interchangeably.
- Not providing a clear distinction.
- Giving only one definition.
Things to Be Careful About
- Provide definitions and then a clear contrast.
- Use examples to solidify the distinction.
Consider whether the actions of the French government on electricity prices might be thought to increase either equality or equity for consumers and producers.
Answer
Equality:
- The tax cut and price controls rescue all consumers from a 35% price rise, but since both rich and poor benefit equally, it does not necessarily improve consumer equality. (1 mark)
- For producers, small firms get cheaper electricity at the expense of the large company, suggesting an increase in equality between producers. (2 marks)
- However, the tax cut may benefit the large company more than smaller rivals, so the effect on producer equality is uncertain. (2 marks)
Equity:
- A tax cut might increase consumer equity by protecting them from excessive price rises, which could be seen as fair. (1 mark)
- However, there is no evidence that the price changes are linked to fairness for producers. Therefore, producer equity is likely unaffected. (1 mark)
Conclusion: The actions may increase equality between producers but not between consumers. Equity is improved for consumers but not for producers. The net effect on overall equality and equity is unclear. (1 mark)
The actions may increase equality between producers but not conclusively for consumers; equity may be improved for consumers but not for producers. Overall, the evidence is mixed.
Background Concept
Equality and equity are distinct concepts. Equality is about equal distribution; equity is about fairness. Government policies such as price controls and tax cuts can affect both. Price controls set a maximum price below equilibrium, benefiting consumers but potentially harming producers. Tax cuts reduce the price paid by consumers, but their incidence depends on elasticities. The impact on equality and equity can be analysed by considering how different groups (rich vs poor consumers, large vs small firms) are affected.
Understanding the Question
The question asks whether the French government's actions (ordering the company to sell more electricity at discounted prices to competitors, and cutting taxes on electricity) increase equality or equity for consumers and producers. The command word is "consider", which implies evaluation. We need to analyse both sides and reach a conclusion. The article provides clues: the price rise was capped at 4% for households and small businesses, competitors get cheaper electricity, but the large company's profits are hurt, and renewable energy funding is affected.
Approach
First, define equality and equity. Then analyse the effects on consumers: the tax cut and price cap benefit all consumers equally, which does not reduce inequality but may be equitable. For producers: small firms gain cheaper inputs, possibly reducing inequality between producers, but the tax cut might benefit the large company more. The conclusion should be that the effects are mixed and uncertain.
Step-by-Step Reasoning
- Consumer equality: The price cap benefits all households equally (rich and poor get the same percentage reduction). This does not reduce the gap between rich and poor, so equality is not improved. However, it prevents a disproportionate burden on the poor? Actually, the poor spend a larger share of income on electricity, so capping the price might help the poor relatively more, but the article says both rich and poor benefit, so equality is not necessarily increased. The mark scheme says "as both rich and poor consumer benefit it is not conclusive that consumer equality is improved."
- Producer equality: Small firms get cheaper electricity from the large company, which reduces the cost advantage of the large company, potentially making competition more equal. This suggests an increase in equality between producers. However, the tax cut on electricity might benefit the large company more because it consumes more electricity, so the net effect is uncertain.
- Consumer equity: Protecting consumers from a 35% price rise is likely seen as fair, especially since the rise was due to external shocks. This increases consumer equity.
- Producer equity: The large company is forced to sell at a discount, which may be seen as unfair to its shareholders (especially private sector owners). There is no evidence that the price changes are linked to fairness for producers. So producer equity is not increased.
- Conclusion: The net effect is ambiguous. The actions may increase equality between producers but not between consumers, and may increase equity for consumers but not for producers. Overall, the evidence does not support a clear increase in overall equality or equity.
Key Takeaways
- Government policies can have different effects on equality and equity for different groups.
- Price controls and tax cuts are redistributive tools.
- The impact on equality depends on whether the benefit is proportional or progressive.
- Always consider both consumers and producers separately.
Common Mistakes
- Assuming that any benefit to consumers automatically increases equality.
- Ignoring the effect on producers.
- Failing to distinguish between equality and equity.
- Not drawing a conclusion based on the evidence.
Things to Be Careful About
- Use the article's evidence: the price cap, the discount to competitors, the effect on renewable energy funding.
- The mark scheme gives specific points for equality between producers (2 marks) and for the uncertainty from the tax cut (2 marks). Address these.
- Conclude clearly, even if the conclusion is that the effects are uncertain.
With the help of a diagram, assess the effectiveness of a government’s intervention in the price mechanism to address the causes of climate change.
Introduction
Climate change is a classic example of negative externalities, where the social costs of production or consumption (e.g., carbon emissions) exceed the private costs, leading to market failure. The government can intervene in the price mechanism to internalise these externalities through policies such as taxes, subsidies, and tradable permits. This essay will assess the effectiveness of such interventions by first explaining the market failure and how price mechanism policies can correct it, before evaluating their limitations and considering alternative approaches.
Analysis: How intervention in the price mechanism can address climate change
The negative externality arises because emitters do not bear the full social cost of their actions. In a free market, the output of goods causing emissions is higher and price lower than the socially optimal level, generating a deadweight welfare loss.
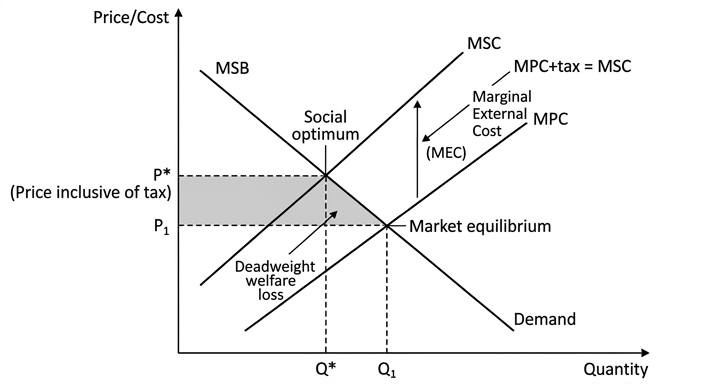
The diagram shows the market for a good whose production causes carbon emissions. The private marginal cost (MPC) is below the social marginal cost (MSC) by the amount of the external cost. The market equilibrium is at Q1 where MPC = MSB (assuming no external benefits), while the socially optimal output is Q* where MSC = MSB. The triangle abc represents the deadweight welfare loss.
A government can impose a per-unit tax equal to the external cost (distance between MSC and MPC at Q*). This shifts the private cost curve upward, aligning it with MSC, so the new equilibrium moves to Q*. The tax internalises the externality and eliminates the deadweight loss. Similarly, a cap-and-trade system issues a fixed number of permits, creating a market price for emissions that rises to the marginal external cost, achieving the same outcome. Subsidies for clean alternatives also operate through the price mechanism by reducing their relative price.
Evaluation: Limitations and alternatives
However, the effectiveness of price mechanism intervention is limited by several factors. First, measuring the exact external cost of climate change is extremely difficult, as it involves long-term, global impacts. An incorrectly set tax will not achieve the socially optimal output. Second, taxes increase firms' costs, which may reduce their competitiveness and cause job losses, especially in carbon-intensive industries. Third, the price elasticity of demand for polluting goods determines how much quantity responds; if demand is inelastic, a large tax is needed to achieve a small reduction.
Moreover, there are alternatives to using the price mechanism. Direct regulation, such as banning coal-fired power stations or setting emission standards, can achieve a more precise outcome but may be less efficient and more costly to enforce. A combination of policies is often necessary.
Conclusion
The price mechanism can be an effective tool for addressing the causes of climate change, as it harnesses market incentives and minimises the cost of abatement. However, its effectiveness is constrained by the difficulty of estimating external costs and the potential for negative side effects. On balance, using price-based instruments like carbon taxes or cap-and-trade, combined with regulation and investment in green technology, offers the most promising approach, but no single intervention will be fully effective without international cooperation and complementary policies.
Government intervention through the price mechanism can partially address the causes of climate change by internalising negative externalities, but its effectiveness is limited by measurement difficulties, political resistance, and the need for a comprehensive package of policies.
Background Concept
Climate change is a global negative externality. A negative externality occurs when the production or consumption of a good imposes costs on third parties that are not reflected in the market price. For example, burning fossil fuels releases carbon dioxide, which contributes to global warming and harms ecosystems, human health, and future generations. In a free market, firms only consider their private costs (labour, materials, capital) and ignore these external costs. As a result, the market equilibrium produces more of the good than is socially optimal at a price that is too low, creating a deadweight welfare loss.
The standard tool to analyse this is the externality diagram: a market diagram with private marginal cost (MPC) and social marginal cost (MSC) curves. The vertical distance between them represents the marginal external cost (MEC). The demand curve equals marginal social benefit (MSB) if there are no external benefits. The socially efficient output is where MSC = MSB; the market output is where MPC = MSB. The deadweight loss is the area between the two outputs under the difference between MSC and MSB.
Government intervention aims to close this gap. Policies that work through the price mechanism try to change relative prices so that private decision-makers face the true social cost. The most common are a Pigouvian tax (equal to MEC), tradable permits (which set a cap and let the market determine the price), and subsidies for clean alternatives.
Understanding the Question
The question asks: "With the help of a diagram, assess the effectiveness of a government’s intervention in the price mechanism to address the causes of climate change."
Key aspects:
- You must include a diagram and explain it fully (the mark scheme caps at Level 2 without a diagram).
- "Assess" means you need to present both sides: the case that price mechanism interventions can work and the case that they are limited. Then reach a justified conclusion.
- The focus is on addressing the causes of climate change, i.e., reducing greenhouse gas emissions, not on adapting to its effects.
- The price mechanism refers to the use of market-based incentives (taxes, permits, subsidies) rather than direct regulation or public provision.
This is a 20-mark undivided essay, so it is levels-marked. The top band requires detailed knowledge and understanding, a chain of reasoning that is developed and detailed, accurate use of analytical tools (diagram fully explained), and a justified conclusion with developed evaluative comments.
Approach
- Start with an introduction: define the market failure (negative externality) and state the purpose of the essay.
- Analysis section: explain the externality, draw and describe the diagram showing the market failure. Then show how a tax (or permit) can shift the private cost curve to achieve the social optimum. Also mention cap-and-trade and subsidies as price mechanism tools.
- Evaluation section: discuss the strengths (flexibility, cost-effectiveness, revenue generation) and limitations (measurement difficulty, political feasibility, impact on competitiveness and employment, demand inelasticity). Compare with alternatives like bans and standards.
- Conclude with a balanced judgement: price mechanism is effective but not perfect; a mix of policies works best.
Remember to use the diagram: it must be referenced in the text and explained. The diagram is essential for AO1/AO2 marks.
Step-by-Step Reasoning
- Define the externality: Start by noting that climate change results from negative externalities in production or consumption. The social cost of carbon includes damages from rising sea levels, extreme weather, etc.
- Draw the diagram: Imagine a market for electricity generated by coal. The MPC curve slopes upward (increasing marginal cost). The MSC curve lies above it by the amount of the marginal external cost (say $50 per tonne of CO2). The demand curve (MSB) is downward sloping. The free market output Q1 is where MPC = MSB; the social optimum Q* is where MSC = MSB. The deadweight loss is the triangle between Q* and Q1 above MSB and below MSC.
- Show the tax: A government imposes a tax of $50 per unit. The new private cost curve is MPC + tax = MSC. The equilibrium moves to Q* at a higher price. The deadweight loss disappears. The government collects tax revenue equal to the rectangle of the tax times Q*.
- Explain cap-and-trade: Instead of a tax, a government can issue permits that cap total emissions at Q*. Firms trade permits, and the permit price settles at the marginal external cost, achieving the same result.
- Evaluate strengths: Price mechanism interventions are flexible (firms can choose how to reduce emissions at lowest cost), they generate revenue (which can be used to cut other taxes or invest in green technology), and they provide continuous incentives for innovation.
- Evaluate weaknesses: The exact external cost is uncertain – estimates of the social cost of carbon range widely. A poorly set tax may be too low or too high. Also, political pressure can water down taxes. Inelastic demand means a very high tax is needed to reduce consumption much. Taxes can harm the competitiveness of domestic firms and lead to job losses. Moreover, climate change is a global problem; unilateral taxes may cause carbon leakage (production moves abroad).
- Contrast with alternatives: Direct regulation (e.g., banning coal plants) is more certain in outcome but less efficient and more costly. Regulation can also be slow to adapt. Often, a combination of a carbon price and targeted regulations, plus investment in renewables, is more effective than any single policy.
- Form a conclusion: The price mechanism is an effective tool for addressing climate change because it aligns incentives with social costs. However, its effectiveness is contingent on accurate measurement, proper implementation, and complementary policies. It is not a panacea but a core part of a broader strategy.
Key Takeaways
- Climate change is a negative externality causing market failure.
- Price mechanism interventions (taxes, permits, subsidies) internalise the externality by altering relative prices.
- A Pigouvian tax equal to the marginal external cost can restore the social optimum, as shown in the diagram.
- Evaluation must consider measurement difficulties, inelastic demand, political feasibility, and international coordination.
- A justified conclusion should weigh the pros and cons and suggest the best approach.
Common Mistakes
- One-sided answer: Many candidates only explain how the price mechanism can work and ignore its limitations. This scores zero for evaluation.
- No diagram or unexplained diagram: The question explicitly requires a diagram. Drawing curves without labels or not explaining what the diagram shows costs marks. The band descriptor says the diagram must be fully explained.
- Confusing MPC and MSC: Ensure you label curves correctly and explain the vertical distance as the external cost.
- Ignoring command word: "Assess" requires a judgement, not just description. The conclusion must be stated clearly.
- Generic answer: Talking about government intervention in general without focusing on the price mechanism misses the point.
- Use of irrelevant diagrams: A standard demand and supply shift is not sufficient; it must be the externality diagram.
Things to Be Careful About
- Label all axes, curves, and relevant points (MPC, MSC, MSB, Q1, Q*, P1, P*, deadweight loss triangle).
- Explain the diagram in the text: Do not just draw it and move on. Walk the reader through the market failure and the correction.
- Use economic terminology: external cost, internalise, social optimum, deadweight loss.
- Be clear about the chain of reasoning: Why does a tax reduce output? Because it raises the private cost, reducing quantity supplied at each price, shifting supply left.
- In evaluation, provide specific examples: Carbon taxes in Sweden, EU Emissions Trading System.
- Address the global dimension: Unilateral intervention may be less effective due to free-riding.
- Don't forget to include alternatives: Even if you advocate for price mechanism, mentioning direct regulation shows depth.
- The conclusion must be justified: State clearly whether price mechanism is effective and under what conditions.
By following these guidelines, a candidate can achieve the top band for both analysis and evaluation.
The introduction of a trade union into a perfectly competitive labour market will always lead to higher wage levels and a higher level of unemployment.
With the help of a diagram, evaluate this statement.
Introduction
A perfectly competitive labour market is characterised by many firms demanding labour and many workers supplying labour, with no single agent able to influence the wage. The equilibrium wage and employment level are determined by the intersection of the market demand for labour (the marginal revenue product of labour, MRPL) and the market supply of labour. A trade union is an organisation of workers that aims to improve wages and working conditions for its members, often through collective bargaining. This essay evaluates the claim that introducing a trade union into such a market will always raise wages and increase unemployment.
Analysis: How a trade union can raise wages and cause unemployment
In a perfectly competitive labour market, the introduction of a trade union that successfully organises all workers transforms the labour supply side into a monopoly. The union can restrict the supply of labour, for example by imposing a minimum wage above the competitive equilibrium or by limiting the number of workers willing to work at lower wages. This is shown in the diagram below.
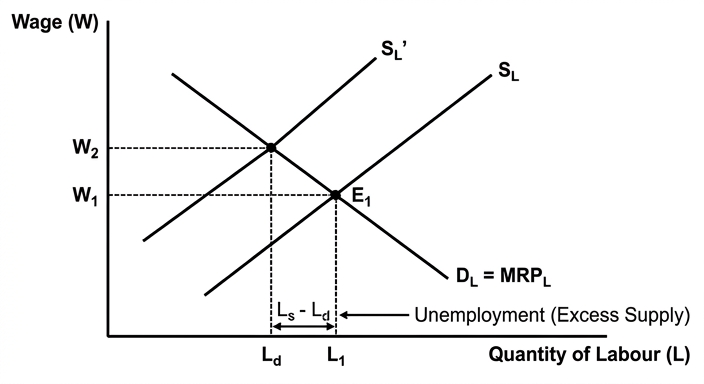
The initial equilibrium is at wage W1 with employment L1. The union sets a wage target W2 above W1. At this higher wage, the quantity of labour demanded falls to Ld (from L1), while the quantity supplied rises to Ls. The excess supply (Ls - Ld) represents unemployment. Thus, in this standard analysis, the union raises the wage and creates unemployment.
The extent of the unemployment depends on the elasticities of demand and supply. If demand for labour is elastic, the fall in employment is larger; if inelastic, the fall is smaller. Similarly, if supply is elastic, the increase in the number of workers seeking jobs at the higher wage is larger, worsening unemployment.
Counter-arguments: Why the statement may not always hold
However, the union may also affect the demand side of the market. Through activities such as providing training, improving worker morale, and reducing labour turnover, the union can increase labour productivity. This shifts the marginal revenue product curve (demand for labour) to the right. If the demand shift is sufficiently large, employment could rise even at the higher wage. In this case, the union raises wages without causing unemployment, or may even increase employment.
Moreover, the union might not always succeed in raising wages. If the union is weak or faces strong employer resistance, it may achieve only modest wage increases or none at all. The union might also prioritise non-wage benefits such as safer working conditions, leaving wages unchanged.
The impact on unemployment also depends on the ease of substituting capital for labour. If higher wages make labour more expensive relative to capital, firms may substitute machines for workers, reducing employment further. But if substitution is difficult (low elasticity of substitution), the employment effect is smaller.
Evaluation
The claim that a trade union will always raise wages and increase unemployment is an oversimplification. The actual outcomes depend on several factors: the bargaining power of the union, the elasticity of demand for labour, the ability of the union to enhance productivity, and the degree of capital-labour substitution. In many realistic scenarios, unions do raise wages above the competitive level, and this often leads to some unemployment, particularly in the short run. However, if unions also contribute to productivity growth, the negative employment effects can be mitigated or even reversed. The word "always" is therefore too absolute; the relationship is contingent on specific market conditions and union behaviour.
Conclusion
In conclusion, while the introduction of a trade union into a perfectly competitive labour market typically leads to higher wages, it does not always do so, and the effect on unemployment is not necessarily an increase. A union that enhances productivity can raise wages without job losses. Therefore, the statement is not universally valid; it holds only under certain assumptions, particularly when the union merely restricts supply without affecting demand. A more accurate statement would be that trade unions tend to raise wages but may cause unemployment, depending on the circumstances.
The statement is not universally valid; while unions often raise wages, the effect on unemployment is ambiguous and depends on productivity effects, elasticities, and bargaining power.
Background Concept
A perfectly competitive labour market is a theoretical construct where there are many firms demanding labour and many workers supplying labour, none of whom can individually influence the market wage. Firms are wage takers. The demand for labour is derived from the marginal revenue product of labour (MRPL), which is the additional revenue generated by employing one more unit of labour. In a perfectly competitive product market, MRPL = marginal physical product × price of output. The demand curve for labour is the MRPL curve, which slopes downward due to diminishing marginal returns. The supply of labour to the market is upward sloping, reflecting that higher wages attract more workers (or induce existing workers to supply more hours). The equilibrium wage and employment are determined at the intersection of demand and supply.
A trade union is an organisation that represents workers in collective bargaining with employers. Its primary objectives are to improve wages, working conditions, and job security for its members. In a perfectly competitive labour market, if a union successfully organises all workers, it can act as a monopoly supplier of labour. It can restrict the supply of labour (e.g., by setting a minimum wage above the equilibrium, or by limiting entry to the occupation) to raise wages. This creates an excess supply of labour (unemployment) at the higher wage.
Understanding the Question
The question presents a statement: "The introduction of a trade union into a perfectly competitive labour market will always lead to higher wage levels and a higher level of unemployment." The task is to evaluate this statement with the help of a diagram. The command word "evaluate" requires a balanced analysis of both sides of the argument and a justified conclusion. The word "always" makes the statement an absolute claim, which is likely to be false or only conditionally true. The question is worth 20 marks, with 14 marks for AO1+AO2 (knowledge, understanding, analysis) and 6 marks for AO3 (evaluation). A diagram is required; without an accurate diagram, the maximum mark is Level 2 (6-10 marks) for AO1+AO2.
Approach
The essay should be structured as follows:
- Introduction: Define the key terms (perfectly competitive labour market, trade union) and outline the scope of the evaluation.
- Analysis supporting the statement: Explain how a union can raise wages and cause unemployment using the standard monopoly union model. Include a diagram showing the initial equilibrium and the effect of a union-imposed wage above equilibrium.
- Analysis challenging the statement: Present counter-arguments, including:
- The union may increase productivity, shifting demand for labour rightwards, potentially offsetting unemployment.
- The union may not always succeed in raising wages (weak bargaining power, non-wage objectives).
- The impact on unemployment depends on elasticities of demand and supply, and the ease of capital-labour substitution.
- Evaluation: Weigh the arguments, considering the conditions under which each outcome is more likely. Discuss the role of elasticities, productivity effects, and the strength of the union.
- Conclusion: Provide a justified judgement on the validity of the statement, addressing the word "always".
Step-by-Step Reasoning
Start by describing the perfectly competitive labour market. Draw the initial diagram: wage on y-axis, employment on x-axis. Demand curve (DL = MRPL) downward sloping, supply curve (SL) upward sloping. Equilibrium at E1 (W1, L1).
Now introduce the union. Assume the union successfully bargains for a wage W2 above W1. At W2, quantity demanded falls to Ld (movement along demand curve), quantity supplied rises to Ls (movement along supply curve, or if union restricts supply, the supply curve shifts left). The excess supply (Ls - Ld) is unemployment. This supports the statement.
However, the union may also engage in activities that raise productivity, such as training programs, improving worker morale, and reducing turnover. These increase the MRPL, shifting the demand curve to the right. If the demand shift is large enough, employment could increase even at the higher wage. For example, if demand shifts to DL', the new equilibrium could be at a higher wage and higher employment. This challenges the statement.
Furthermore, the union may not always achieve a wage increase. If the union is weak or faces strong opposition, it may settle for a wage close to the competitive level. The union might also prioritise non-wage benefits, leaving wages unchanged.
The effect on unemployment also depends on the elasticity of demand for labour. If demand is elastic (e.g., because labour is easily substitutable), a given wage increase leads to a large fall in employment. If demand is inelastic (e.g., because labour is essential and hard to replace), the employment fall is smaller. Similarly, the elasticity of supply affects the size of the excess supply.
Capital-labour substitution: Higher wages make labour more expensive relative to capital, encouraging firms to substitute capital for labour. This reduces employment further. However, if the production process requires a fixed proportion of labour to capital, substitution is limited.
Evaluation: The statement is too absolute. While the standard model predicts higher wages and unemployment, real-world unions often have productivity-enhancing effects that mitigate job losses. The net effect on employment is ambiguous and depends on the relative strengths of the supply restriction and demand shift, as well as elasticities. Therefore, the statement is not always true.
Conclusion: The introduction of a trade union does not always lead to higher wages and higher unemployment. It can raise wages without causing unemployment if productivity increases sufficiently. The word "always" is incorrect; a more accurate statement would be that unions tend to raise wages but may cause unemployment, depending on circumstances.
Key Takeaways
- The perfectly competitive labour market model provides a benchmark for analysing wage and employment determination.
- Trade unions can affect both the supply side (by restricting supply) and the demand side (by enhancing productivity).
- The impact of unions on wages and employment is not deterministic; it depends on elasticities, bargaining power, and productivity effects.
- Evaluating absolute statements requires considering counter-examples and conditional factors.
- Diagrams are essential tools for illustrating labour market analysis.
Common Mistakes
- Providing a one-sided answer that only discusses the supply restriction and ignores productivity effects. This would lose marks for evaluation.
- Failing to include a diagram, or including a diagram that is not accurately labelled or explained. The mark scheme explicitly caps at Level 2 if no accurate diagram.
- Not addressing the word "always" in the conclusion. The evaluation must consider the absolute nature of the claim.
- Concluding without justification, e.g., simply stating "it depends" without explaining on what it depends.
- Confusing the market for labour with the firm's labour demand. In a perfectly competitive labour market, the firm faces a perfectly elastic supply of labour at the market wage, but the market supply is upward sloping.
- Using incorrect terminology, such as confusing MRPL with demand for labour.
Things to Be Careful About
- Ensure the diagram has correctly labelled axes (Wage, Employment) and curves (DL, SL). Show the initial equilibrium and the effect of the union clearly.
- Explain the diagram in the text; do not just refer to it.
- Distinguish between the short run and long run. In the long run, capital-labour substitution is more feasible.
- Consider both the market level and the firm level. The union affects the market supply, but each firm still faces a horizontal supply curve at the union wage.
- Use economic terminology precisely: "excess supply" not "unemployment" until the context is clear.
- In the evaluation, weigh the arguments and reach a clear verdict. Avoid fence-sitting.
- Address the specific statement: "always lead to higher wage levels and a higher level of unemployment." The conclusion should explicitly state whether this is always, sometimes, or never true.
With the help of a diagram, assess the effectiveness of government policies which might be used to reduce cost-push inflation.
Introduction
Cost-push inflation arises from an increase in the costs of production, such as rising wages, raw material prices, or indirect taxes, which shifts the short-run aggregate supply (SRAS) curve leftwards, raising the price level and reducing real output. The government has several policy options to reduce such inflation, including supply-side policies, fiscal measures, monetary policy, exchange rate policy, and incomes policies. This essay assesses their effectiveness, distinguishing between short-run and long-run impacts.
Analysis of supply-side policies
Supply-side policies aim to increase the productive capacity of the economy, shifting both SRAS and LRAS to the right. Examples include investment in infrastructure, education and training, deregulation, and tax reforms to incentivise work and investment. By increasing productivity and reducing unit costs, these policies can lower the price level and increase output.
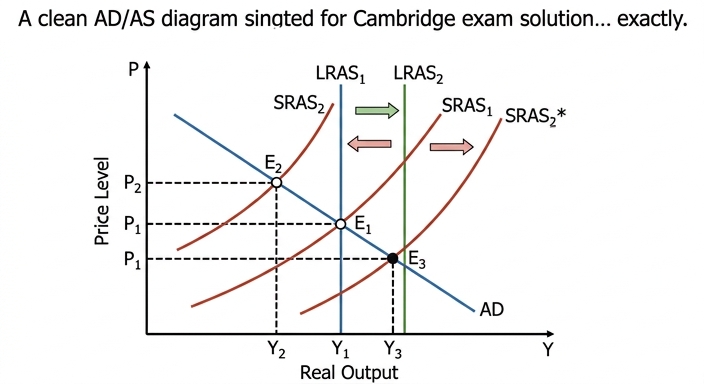
The diagram shows an initial equilibrium at E1, with price level P1 and real output Y1, following a leftward shift of SRAS from SRAS1 to SRAS2 due to cost-push factors. A successful supply-side policy shifts SRAS back to SRAS1 (or further right), reducing the price level to P1 and raising output to Y1. In the long run, LRAS also shifts right, allowing non-inflationary growth.
However, such policies take time to implement and yield results. They require significant government expenditure, which may increase the budget deficit and crowd out private investment. Moreover, the benefits may be unevenly distributed and may not address immediate inflationary pressures.
Fiscal policy measures
The government can use fiscal policy to reduce production costs directly. For example, reducing indirect taxes or providing subsidies to firms lowers their costs, shifting SRAS right. This can be effective in the short run, quickly reducing the price level. However, it has drawbacks: lower tax revenue or higher subsidy spending worsens the budget deficit, increasing government borrowing and potentially raising interest rates, which could crowd out private investment. Additionally, subsidies may encourage inefficiency and may not be sustainable in the long run.
Monetary policy
Monetary policy is primarily designed to combat demand-pull inflation. Raising interest rates to reduce aggregate demand would worsen the recessionary gap caused by cost-push inflation, leading to higher unemployment and lower output without addressing the underlying cost increases. Therefore, it is largely ineffective for cost-push inflation and may even be counterproductive.
Exchange rate policy
An appreciation of the exchange rate reduces the cost of imported raw materials and components, thereby lowering production costs. This can shift SRAS right. However, appreciation harms export competitiveness, reducing net exports and aggregate demand, potentially causing a recession. The net effect may be ambiguous.
Incomes policy
Direct controls on wages and prices, such as a statutory incomes policy, can limit cost increases. However, these controls are difficult to enforce, create distortions in labour and product markets, and may lead to industrial unrest. They are typically temporary and do not address the root causes of cost pressures.
Evaluation
The effectiveness of policies depends on the time horizon. In the short run, fiscal measures (subsidies, tax cuts) and exchange rate appreciation can provide quick relief, but they carry significant fiscal costs and negative side effects. Incomes policies may offer a short-term fix but are unsustainable. In the long run, supply-side policies are more effective because they address the underlying productivity constraints and can achieve non-inflationary growth. However, they require patience and upfront investment, and their impact is uncertain.
A key evaluative point is the potential for government failure: poorly designed supply-side policies may waste resources, and fiscal measures may lead to unsustainable deficits. Moreover, the combination of policies must be carefully managed to avoid conflicting objectives (e.g., subsidies increasing demand while attempting to reduce inflation).
Conclusion
In assessing the overall effectiveness, no single policy is fully effective on its own. Supply-side policies offer the most sustainable solution but are slow to act. In the short run, targeted fiscal measures can alleviate cost pressures, but they must be used cautiously to avoid fiscal imbalances. The most effective approach is a coordinated strategy that prioritises long-term supply-side reforms while using temporary fiscal measures to manage immediate inflation, with careful monitoring of government finances and potential side effects. The effectiveness ultimately depends on the government's credibility, the specific causes of cost-push inflation, and the state of the economy.
The most effective long-term policy is supply-side investment, but short-term fiscal measures can provide temporary relief; a balanced approach with careful fiscal management is needed, though effectiveness depends on the specific context and implementation.
Background Concept
Cost-push inflation occurs when the costs of production rise, causing the short-run aggregate supply (SRAS) curve to shift leftwards. This raises the price level (inflation) and reduces real output (a recessionary gap). The AD/AS model is the standard framework for analysing this. Government policies to reduce cost-push inflation can be broadly classified into those that aim to shift SRAS back to the right (supply-side policies, fiscal measures to reduce costs, exchange rate appreciation) and those that attempt to control costs directly (incomes policies). Monetary policy is generally ineffective because it targets aggregate demand, not supply. The effectiveness of each policy is judged by its ability to lower the price level without causing significant negative side effects, such as higher unemployment, larger budget deficits, or distortions. The distinction between short-run and long-run impacts is crucial.
Understanding the Question
The question asks you to 'assess the effectiveness of government policies which might be used to reduce cost-push inflation'. The command word 'assess' requires a two-sided evaluation and a justified conclusion. The phrase 'with the help of a diagram' means you must include at least one accurately labelled and fully explained diagram. The response must show knowledge of different policies, analyse how they work, and then evaluate their relative merits, considering trade-offs, time lags, and potential government failure. The top band requires a detailed and well-organised answer that fully develops explanations and uses analytical tools (the diagram) correctly. The conclusion must be justified and address the specific question.
Approach
Start by defining cost-push inflation and setting up the AD/AS diagram to illustrate the problem. Then, analyse each policy in turn: supply-side policies (long-run focus), fiscal policies (subsidies/tax cuts), exchange rate policy, incomes policy, and briefly explain why monetary policy is unsuitable. For each, explain the mechanism (how it shifts SRAS or reduces costs) and the potential drawbacks. After presenting both sides, evaluate the policies by comparing short-run vs long-run effectiveness, fiscal costs, and the risk of government failure. Finally, provide a justified conclusion that weighs the options and recommends a balanced approach. The diagram should be integrated into the analysis of supply-side policies, showing the initial shift left and the subsequent rightward shift from the policy.
Step-by-Step Reasoning
-
Define cost-push inflation: An increase in production costs (e.g., higher oil prices, wage increases, higher indirect taxes) that shifts SRAS left. This increases the price level and reduces real GDP. Draw the initial AD/AS diagram with AD, LRAS, SRAS1, equilibrium at E1 (P1, Y1). Then shift SRAS to SRAS2, showing new equilibrium E2 (higher P, lower Y). This is the problem the policies aim to solve.
-
Supply-side policies: These aim to increase productivity and reduce unit costs. Examples: infrastructure spending, education and training, deregulation, tax cuts for investment. They shift both SRAS and LRAS to the right. In the diagram, show SRAS2 shifting back to SRAS1 (or further right) and LRAS shifting right. The new equilibrium has a lower price level and higher output. However, these policies take time (years) to implement and have high opportunity cost. They may also increase government borrowing, which can crowd out private investment. Evaluation: very effective in the long run, but not for immediate inflation.
-
Fiscal policy: The government can reduce indirect taxes (e.g., VAT) or provide subsidies to firms. This reduces their costs, shifting SRAS right immediately. This can quickly lower the price level. However, it reduces tax revenue or increases spending, worsening the budget deficit. The government may need to borrow more, raising interest rates and crowding out private investment. Additionally, subsidies may create inefficiency and are difficult to remove. Evaluation: effective in the short run but fiscally costly and unsustainable.
-
Exchange rate policy: An appreciation of the currency reduces the price of imported raw materials and components, shifting SRAS right. This can be effective if the country imports many inputs. However, appreciation makes exports more expensive, reducing net exports and AD, potentially causing a recession. The net effect on output may be negative. Evaluation: limited effectiveness due to negative impact on trade.
-
Incomes policy: Direct controls on wages and prices (e.g., wage freezes, price caps) can limit cost increases. However, they are difficult to enforce, create black markets, and may lead to industrial unrest. They do not address the underlying causes and are usually temporary. Evaluation: poor long-term effectiveness, useful only as a short-term measure.
-
Monetary policy: Raising interest rates reduces AD, which could lower demand-pull inflation but does not address supply-side cost pressures. In fact, it would worsen the recessionary gap, increasing unemployment. Therefore, it is ineffective for cost-push inflation and may even be counterproductive. (Briefly mention, but focus on the others.)
-
Evaluation: Compare the policies on criteria: speed of impact, sustainability, side effects, and ability to address root causes. Supply-side policies are slow but sustainable; fiscal measures are fast but costly and temporary; exchange rate policy has ambiguous effects; incomes policy is disruptive. The best approach is likely a combination: use temporary fiscal measures to manage immediate inflation while implementing supply-side reforms for the long term. However, this requires careful coordination and fiscal discipline. Consider potential government failure: policies may be poorly designed or implemented, leading to unintended consequences.
-
Conclusion: State that the most effective overall strategy is to focus on supply-side policies for long-term stability, supplemented by targeted short-term fiscal measures if inflation is severe. The effectiveness depends on the specific causes of inflation, the government's credibility, and the state of the economy. A justified conclusion should weigh the trade-offs and give a clear judgement.
Key Takeaways
- Cost-push inflation requires supply-side solutions, not demand management.
- The AD/AS diagram is essential for illustrating both the problem and the effect of policies.
- Policies have trade-offs between short-run effectiveness and long-run sustainability.
- Evaluation must consider fiscal costs, time lags, side effects, and risk of government failure.
- A justified conclusion is necessary; it should not be a simple summary but a reasoned judgement.
Common Mistakes
- One-sided answer: Only discussing benefits of policies without considering drawbacks. This loses all evaluation marks.
- No diagram or poorly explained diagram: The mark scheme caps at L2 if no accurate diagram. The diagram must be fully explained in the text.
- Incorrect diagram: Shifting AD instead of AS for cost-push inflation. Or showing a demand-side policy correctly for cost-push.
- Generic answer: Discussing inflation in general rather than specifically cost-push.
- No conclusion or vague conclusion: The top band requires a justified conclusion that addresses the question.
- Ignoring evaluation criteria: Not comparing policies on meaningful criteria like time horizon, fiscal cost, or side effects.
- Listing policies without analysis: Simply naming policies without developing the chain of reasoning.
Things to be Careful About
- Ensure the diagram is accurate: label axes (Price Level, Real Output), curves (AD, SRAS, LRAS), equilibrium points, and shifts. Explain the direction of shifts and the resulting changes in price level and output.
- Use correct economic terminology: 'cost-push inflation', 'aggregate supply', 'subsidy', 'budget deficit', 'crowding out', 'government failure'.
- Distinguish between short-run and long-run: supply-side policies affect LRAS; fiscal measures affect SRAS.
- When evaluating, use specific criteria: time lags, fiscal cost, sustainability, impact on other objectives (e.g., unemployment, growth).
- The conclusion must be justified: state which policy is most effective and why, and under what conditions.
- Avoid writing a one-sided essay; both sides must be developed.
- Do not rely solely on monetary policy; it is not effective for cost-push inflation.
- Ensure the solution is well-organised with clear paragraphs and logical flow.
Globalisation will help to achieve economic growth in high-income economies and this will automatically improve living standards.
Evaluate this statement.
Introduction
Globalisation refers to the increasing integration of economies through trade, capital flows, labour migration and technology transfer. High-income economies are characterised by high GDP per capita, advanced technology and a large services sector. The statement claims that globalisation will cause economic growth in such economies and that this growth will automatically raise living standards. This essay evaluates both links.
The case that globalisation promotes growth and improves living standards
Globalisation expands markets for high-income economies. Through free trade, firms in high-income countries can export to a wider customer base, raising aggregate demand and output. The inflow of cheaper imports from lower-income economies reduces input costs for domestic firms, lowering prices and increasing real incomes. Technology transfer and foreign direct investment (FDI) bring new production methods, raising productivity and potential output. These forces shift the long-run aggregate supply curve to the right, generating sustained economic growth.
Higher real GDP per capita increases tax revenue without raising tax rates. Governments can then spend more on public goods such as health, education and infrastructure, which directly improve living standards. Higher incomes also allow households to purchase more goods and services, raising material living standards. For example, the post-1980 globalisation period saw many high-income economies experience rising GDP per capita alongside improvements in life expectancy and literacy.
The case against: growth does not automatically improve living standards
First, economic growth is a quantitative measure of output, not a qualitative measure of well-being. If growth is achieved by working longer hours, depleting natural resources, or increasing pollution, living standards may fall even as GDP rises. Globalisation often increases long-distance transport, creating negative externalities such as carbon emissions, which harm health and the environment.
Second, the benefits of growth may be distributed unequally. Globalisation can lead to job losses in import-competing sectors, raising unemployment and reducing living standards for displaced workers. The gains from growth may accrue mainly to capital owners, widening inequality and leaving many households no better off.
Third, growth driven by globalisation may be volatile. High-income economies that rely on global supply chains are vulnerable to external shocks, such as a recession in a major trading partner or a pandemic, which can cause sharp falls in output and employment.
Evaluation
The strength of the link between globalisation, growth and living standards depends on several factors. The type of growth matters: if growth is inclusive and sustainable, it is more likely to raise living standards. The distribution of income and the quality of government spending also determine how much growth translates into well-being. The word 'automatically' is too strong; the relationship is contingent, not guaranteed.
Conclusion
Globalisation can contribute to economic growth in high-income economies, but the improvement in living standards is not automatic. It depends on how the growth is achieved, how its benefits are distributed, and whether negative externalities are addressed. The statement is therefore an over-simplification; a more accurate claim is that globalisation creates opportunities for growth that can improve living standards if accompanied by appropriate policies.
Globalisation can promote economic growth in high-income economies, but the improvement in living standards is not automatic; it depends on the quality of growth, distribution of benefits, and management of externalities. The statement is an over-simplification.
Background Concept
Globalisation is the process of increasing integration of economies through trade, investment, labour migration, and technology transfer. Economic growth is an increase in the productive capacity of an economy, typically measured by real GDP per capita. Living standards are a broader concept, encompassing material well-being (income, consumption) and non-material aspects such as health, education, environmental quality, and inequality. The relationship between growth and living standards is not straightforward: growth can raise incomes but may also bring pollution, inequality, and social disruption.
Understanding the Question
The question presents a statement that contains two causal claims: (1) globalisation will cause economic growth in high-income economies, and (2) this growth will automatically improve living standards. The command word is 'Evaluate', which requires a two-sided analysis and a justified conclusion. The word 'automatically' is an absolute claim that must be challenged. The question is from Paper 4, 20 marks, levels-based, with AO1+AO2 out of 14 and AO3 out of 6. The top band requires detailed knowledge, developed analysis, and a justified conclusion that addresses the specific requirements.
Approach
The essay will first define key terms and then develop the case for the statement: how globalisation can drive growth and how growth can improve living standards. Then it will present the counter-case: growth may not improve living standards due to externalities, inequality, volatility, and the qualitative nature of well-being. The evaluation will weigh these arguments, focusing on the conditions under which the link holds. The conclusion will reject the claim that improvement is automatic, offering a nuanced judgement.
Step-by-Step Reasoning
Step 1: Define globalisation, economic growth, and living standards. Globalisation involves increased trade, capital flows, labour migration, and technology transfer. Economic growth is an increase in real GDP per capita. Living standards include both material and non-material aspects.
Step 2: Explain how globalisation can cause economic growth in high-income economies. High-income economies benefit from access to larger markets (increasing AD), cheaper imports (reducing costs and increasing real incomes), and technology transfer (boosting productivity). These factors shift the LRAS curve right, increasing potential output.
Step 3: Explain how economic growth can improve living standards. Higher GDP per capita means higher average incomes, enabling more consumption. Higher tax revenues allow better public services (health, education, infrastructure). This can raise both material and non-material living standards.
Step 4: Present the counter-arguments. Growth may be accompanied by negative externalities (pollution, congestion) that reduce well-being. The benefits may be unequally distributed, leaving many worse off. Growth may be volatile, causing instability. Also, growth may be unsustainable, depleting resources for future generations.
Step 5: Evaluate the strength of the link. The link is not automatic; it depends on the type of growth (inclusive, sustainable), the distribution of income, the quality of government spending, and the management of externalities. The word 'automatically' is too strong.
Step 6: Form a conclusion. The statement is an over-simplification. Globalisation can create opportunities for growth, but whether living standards improve depends on policy choices and the nature of the growth.
Key Takeaways
- Globalisation can promote growth through trade, capital flows, and technology transfer.
- Economic growth does not automatically raise living standards; the quality and distribution of growth matter.
- Living standards are multi-dimensional and include non-material aspects.
- The word 'automatically' is an absolute that must be challenged in evaluation.
- A good evaluation uses a criterion (e.g., distribution, sustainability) to weigh arguments and reach a justified conclusion.
Common Mistakes
- Writing a one-sided answer that only supports the statement, losing all evaluation marks.
- Failing to define key terms (globalisation, economic growth, living standards).
- Confusing economic growth with an increase in living standards.
- Not addressing the word 'automatically' in the conclusion.
- Providing a vague conclusion that simply says 'it depends' without explaining what it depends on.
- Using no real-world examples or evidence.
Things to Be Careful About
- Ensure the answer is balanced: both sides must be developed.
- The conclusion must be justified, not just a summary.
- Use economic terminology correctly (e.g., real GDP per capita, negative externalities, inequality).
- Do not assume that growth always improves living standards; the question explicitly challenges this.
- Keep the focus on high-income economies, not developing countries.
- Avoid over-generalising; the answer should be specific to the statement.