Economics 9708/32 — February/March 2024
Cambridge A-Level · A Level Multiple Choice · answer key with instant marking and worked solutions
Topics Effectiveness of Macroeconomic Policies · Growth and Survival of Firms · Government Policies to Correct Market Failure · Macroeconomic Objectives and Policy Conflicts · Externalities, Social Costs and Benefits · Performance of Firms in Different Market Structures · +12 more
Tap an option under each question to check it — your score builds as you go.
A person buys two pairs of socks.
What does the purchase of the second pair of socks lead to?
Options
A a decrease in marginal productivity
B a decrease in marginal utility
C an increase in marginal productivity
D an increase in marginal utility
Reasoning
Marginal utility is the additional satisfaction gained from consuming one more unit of a good. The law of diminishing marginal utility states that as a person consumes more units of a good within a given period, the marginal utility from each successive unit decreases. For the first pair of socks, the consumer derives a certain amount of marginal utility. The second pair provides additional satisfaction, but less than the first pair. Therefore, the purchase of the second pair leads to a decrease in marginal utility compared to the first pair. Option B is correct.
Answer
B
B
Background Concept
Utility theory explains consumer behaviour in terms of the satisfaction (utility) derived from consuming goods and services. Marginal utility refers to the extra utility from consuming one additional unit of a good. The law of diminishing marginal utility is a fundamental principle: for most goods, as consumption increases, the additional satisfaction from each extra unit eventually falls. This is because the consumer's wants become progressively satisfied. It is a short-run concept; tastes and preferences are constant. This law underpins the downward-sloping demand curve: because marginal utility declines, consumers are only willing to buy additional units at lower prices.
Understanding the Question
This question presents a simple scenario: a person buys two pairs of socks. It asks what the purchase of the second pair leads to. The four options involve changes in marginal utility or marginal productivity. The correct concept is marginal utility, not marginal productivity (which applies to production, not consumption). The law of diminishing marginal utility tells us that the second pair yields less additional satisfaction than the first, so marginal utility decreases. Option B correctly captures this. The distractors involve marginal productivity (irrelevant) or an increase in marginal utility (contradicts the law for additional units consumed in a short period).
Approach
Recall the definition of marginal utility and the law of diminishing marginal utility. Identify that the question is about consumption (purchasing socks), not production, so marginal productivity is irrelevant. Since two pairs are bought, the marginal utility of the second pair is lower than that of the first, so the second purchase leads to a decrease in marginal utility (compared to the previous one). The answer is B.
Step-by-Step Reasoning
- Define marginal utility: the satisfaction gained from consuming one extra unit of a good.
- State the law of diminishing marginal utility: as more units are consumed in a given time period, the marginal utility eventually declines.
- Apply: The first pair gives some positive marginal utility. The second pair gives additional utility, but because the consumer already has one pair, the extra satisfaction is less than that from the first. Thus, marginal utility decreases.
- Eliminate other options: Options A and C mention marginal productivity, which is a concept from production theory (output from additional units of an input). This is not relevant to consumer behaviour; sock buying does not involve production. Option D says increase in marginal utility – this would violate the law of diminishing marginal utility; it only occurs for the first few units if there is increasing marginal utility (rare, e.g., addictive substances) but generally for normal goods, the law holds. The default assumption is diminishing marginal utility.
- Therefore, the correct option is B: a decrease in marginal utility.
Key Takeaways
- Understand the difference between marginal utility (consumption) and marginal productivity (production).
- The law of diminishing marginal utility is foundational: it explains why demand curves slope down.
- For simple questions like this, recall the core principle directly.
Common Mistakes
- Confusing marginal utility with marginal productivity: some students might think of 'productivity' because socks are a product, but the consumer is not producing; they are consuming.
- Thinking that the second unit always gives greater satisfaction (if the good is highly desirable) – but the law states diminishing marginal utility for additional units in a short period; the first pair already satisfies need, so second is less.
- Not reading the options carefully: two options involve 'marginal productivity' which is a distractor; students who don't understand the terms might guess.
Things to Be Careful About
- Always distinguish between production and consumption contexts.
- Remember that the law of diminishing marginal utility applies per unit of time; if the person buys two pairs but wears them on different days, the marginal utility might not diminish, but the question implies immediate consumption in a short period, as typical in utility theory.
- The question asks what the purchase 'leads to', meaning the effect on marginal utility as a result of that purchase compared to the situation before. So the second purchase causes marginal utility to be lower than the first.
What does an indifference curve show?
Options
A the amount of two products achievable with given income and prices
B the different combinations of two goods that give a consumer equal utility
C the income available to buy the two goods
D the rate at which marginal utility changes as consumption changes
Reasoning
An indifference curve represents all combinations of two goods that provide a consumer with the same level of utility (satisfaction). Options A and C describe the budget line, which shows the combinations attainable given income and prices. Option D describes the concept of diminishing marginal utility, not an indifference curve. Therefore, the correct answer is B.
Answer
B
B
Background Concept
An indifference curve is a fundamental tool in consumer theory, used to analyse preferences without requiring cardinal measurement of utility. It shows the various bundles of two goods (say, X and Y) that yield the same total utility to the consumer. The consumer is indifferent between any two points on the same curve. Indifference curves are typically downward sloping, convex to the origin (due to diminishing marginal rate of substitution), and cannot intersect.
Understanding the Question
This is a straightforward definition question testing whether you know what an indifference curve shows. The four options deliberately confuse the indifference curve with the budget line (Options A and C) and with the concept of marginal utility (Option D). You need to identify the correct description from the standard definition.
Approach
Recall the precise definition: an indifference curve is a locus of points representing different combinations of two goods that give the consumer equal satisfaction (utility). Compare each option to this definition.
Step-by-Step Reasoning
- Option A: "the amount of two products achievable with given income and prices" – This describes the budget line (or budget constraint), which shows the maximum affordable combinations. The indifference curve is about preferences, not affordability. So A is incorrect.
- Option B: "the different combinations of two goods that give a consumer equal utility" – This matches the definition exactly. The key words are "equal utility" (or equal satisfaction). This is correct.
- Option C: "the income available to buy the two goods" – This is a component of the budget line, not the indifference curve. The indifference curve does not depend on income; it is a representation of preferences. Incorrect.
- Option D: "the rate at which marginal utility changes as consumption changes" – This describes the diminishing marginal utility concept, which is related to the slope of the indifference curve (the marginal rate of substitution) but is not the definition of the curve itself. Incorrect.
Therefore, the correct answer is B.
Key Takeaways
- An indifference curve is about preferences (utility), not affordability.
- The budget line shows affordability given income and prices.
- The slope of the indifference curve (MRS) is related to marginal utility, but the curve itself is defined by constant total utility.
Common Mistakes
- Confusing the indifference curve with the budget line – many students pick A or C because they think of the diagram they often draw (indifference curve + budget line). Remember the budget line is the straight line; the indifference curve is the curved one.
- Thinking that the indifference curve shows the rate of change of utility – that is the marginal utility concept, not the indifference curve.
Things to Be Careful About
- Read the question carefully: it asks what the indifference curve "shows", not what it is used for. The definition is precise.
- In multiple-choice questions, ensure you eliminate the distractors based on the exact wording.
- The indifference curve is a fundamental building block; be clear on the distinction between preferences and constraints.
The table shows the total amount consumers are willing to pay for different quantities of good X and the total external benefits that arise from the consumption of X.
| quantity of good X (000 units) | consumers' willingness to pay ($000) | total external benefits ($000) |
|---|---|---|
| 1 | 100 | 20 |
| 2 | 180 | 38 |
| 3 | 240 | 54 |
| 4 | 280 | 68 |
| 5 | 300 | 80 |
What is the value of the marginal social benefit when 5000 units are consumed?
Options
A $12 000
B $32 000
C $80 000
D $380 000
Working
Marginal private benefit (MPB) = change in total willingness to pay from 4000 to 5000 units = $300 000 - $280 000 = $20 000.
Marginal external benefit (MEB) = change in total external benefits from 4000 to 5000 units = $80 000 - $68 000 = $12 000.
Marginal social benefit (MSB) = MPB + MEB = $20 000 + $12 000 = $32 000.
Answer
B
B
Background Concept
Marginal social benefit (MSB) is the additional benefit to society from consuming one more unit of a good. It is the sum of the marginal private benefit (MPB) – the benefit to the consumer – and the marginal external benefit (MEB) – the benefit to third parties not involved in the transaction. In the presence of positive externalities, MSB > MPB, and the market under-consumes the good because consumers only consider their private benefit.
Understanding the Question
The table provides total willingness to pay (total private benefit) and total external benefits at different quantities. We are asked for the marginal social benefit when 5000 units are consumed. This means we need the additional social benefit from the 5000th unit, i.e., from 4000 to 5000 units. The data is given in thousands of units and thousands of dollars, so we must be careful with units.
Approach
Compute the marginal private benefit as the change in total willingness to pay from 4000 to 5000 units. Compute the marginal external benefit as the change in total external benefits over the same interval. Sum them to get MSB.
Step-by-Step Reasoning
- Identify the relevant interval: from 4000 to 5000 units (quantity 4 to 5 in the table).
- Total willingness to pay at 4000 units: $280 000 (since 280 $000). At 5000 units: $300 000. Change = $20 000. This is MPB.
- Total external benefits at 4000 units: $68 000. At 5000 units: $80 000. Change = $12 000. This is MEB.
- MSB = MPB + MEB = $20 000 + $12 000 = $32 000.
- Match to options: B is $32 000.
Key Takeaways
- Marginal social benefit is the sum of marginal private and marginal external benefits.
- When given total values, marginal values are found by the change in total.
- Positive externalities lead to MSB > MPB, justifying government intervention to increase consumption.
Common Mistakes
- Confusing total and marginal values: using total external benefits at 5000 units ($80 000) as the marginal external benefit.
- Forgetting to add the private benefit: only computing the external benefit.
- Misreading the units: not converting from $000 to actual dollars, but the options are in actual dollars, so careful.
Things to Be Careful About
- Always compute marginal as the change from the previous quantity.
- Ensure units are consistent: the table uses $000, but the options are in $, so convert appropriately.
- Double-check arithmetic: 300-280=20, 80-68=12, sum=32.
The statement and the table provide information about a production function.
The production function represents the amount of ......1...... obtainable from each combination of ......2...... and can be used to give information about ......3...... .
Which words correctly complete gaps 1, 2 and 3?
Options
| 1 | 2 | 3 | |
|---|---|---|---|
| A | demand | labour | returns to scale |
| B | demand | labour | normal profit |
| C | output | inputs | returns to scale |
| D | output | inputs | supernormal profit |
Answer
A production function shows the maximum output obtainable from each combination of inputs and can be used to give information about returns to scale.
Therefore the correct option is C.
C
Background Concept
A production function is a fundamental concept in microeconomics that describes the technological relationship between the quantity of inputs used in production and the quantity of output produced. It is typically expressed as Q = f(L, K, ...), where Q is output, L is labour, K is capital, and other inputs may be included. The production function shows the maximum output that can be produced from any given combination of inputs, given the current state of technology.
Returns to scale refer to how output changes when all inputs are increased proportionally. If output increases by a larger proportion than the increase in inputs, there are increasing returns to scale; if output increases by the same proportion, constant returns to scale; and if output increases by a smaller proportion, decreasing returns to scale. This is a long-run concept because all inputs are variable.
Understanding the Question
This is a multiple-choice question that asks you to fill in three gaps in a statement about a production function. The statement reads: "The production function represents the amount of ......1...... obtainable from each combination of ......2...... and can be used to give information about ......3...... ."
You are given four options (A, B, C, D) with different words for gaps 1, 2, and 3. The task is to select the option that correctly completes all three gaps.
Approach
To answer this question, you need to recall the precise definition of a production function. The key is to distinguish between:
- Output (what is produced) vs. demand (what consumers want to buy)
- Inputs (factors of production used) vs. labour (one specific input)
- Returns to scale (a property of the production function) vs. normal profit or supernormal profit (profit concepts)
Once you know the definition, you can eliminate the incorrect options.
Step-by-Step Reasoning
-
Gap 1: The production function represents the amount of ______ obtainable from each combination of inputs. A production function is about output, not demand. Demand is a separate concept related to consumer behaviour. Therefore, options A and B (which say "demand") are incorrect.
-
Gap 2: The production function shows output obtainable from each combination of ______. The correct term is inputs (all factors of production: labour, capital, land, enterprise). Labour is just one input, so option C ("inputs") is correct, while options A and B ("labour") are too narrow.
-
Gap 3: The production function can be used to give information about ______. A production function can show returns to scale (how output changes when all inputs are scaled up). Normal profit and supernormal profit are profit concepts, not directly derived from the production function. Therefore, option C ("returns to scale") is correct, and options B and D are incorrect.
Thus, the only option that correctly fills all three gaps is C: output, inputs, returns to scale.
Key Takeaways
- A production function is a technical relationship between inputs and output, not between demand and output.
- It considers all inputs, not just labour.
- Returns to scale is a key property of a production function, describing how output responds to proportional changes in all inputs.
- Profit concepts (normal, supernormal) are not directly derived from the production function; they involve revenue and cost.
Common Mistakes
- Confusing "output" with "demand". Demand is a consumer-side concept; output is a producer-side concept.
- Thinking the production function only relates to labour, forgetting that it includes all inputs.
- Associating the production function with profit rather than returns to scale.
Things to Be Careful About
- Read each gap carefully and consider the economic definition of a production function.
- Eliminate options that contain any incorrect word for any gap.
- Remember that a production function is about the physical relationship between inputs and output, not about market outcomes like demand or profit.
Two firms selling the same type of product find it more efficient to merge.
Which combination describes how the merged firm's average costs of production and demand curve are expected to change?
Options
| average costs | demand curve | |
|---|---|---|
| A | fall | more elastic |
| B | fall | more inelastic |
| C | rise | more elastic |
| D | rise | more inelastic |
Reasoning
When two firms selling the same product merge, they can exploit economies of scale by combining production, reducing average costs. At the same time, the merger reduces competition, giving the merged firm greater market power, which makes its demand curve less responsive to price changes—i.e., more inelastic. Hence, average costs fall and the demand curve becomes more inelastic.
Answer
B
B
Background Concept
A merger between two firms in the same industry can have two main effects. First, by combining operations, the merged firm may achieve economies of scale—lower long-run average costs due to factors such as specialisation, bulk buying, and spreading fixed costs over a larger output. Second, the merger reduces the number of competitors in the market, increasing the merged firm's market power. Greater market power means the firm faces a less elastic (more inelastic) demand curve because consumers have fewer close substitutes to switch to if the firm raises its price.
Understanding the Question
The question asks which combination of changes in average costs and demand elasticity is expected after a merger of two firms selling the same type of product. The options pair a cost change (fall or rise) with a demand elasticity change (more elastic or more inelastic). The correct answer must reflect both the supply-side effect (costs) and the demand-side effect (market power).
Approach
First, consider the effect on average costs. A merger between similar firms typically allows for rationalisation and economies of scale, so average costs are likely to fall. Second, consider the effect on demand elasticity. With fewer competitors, the merged firm's demand curve becomes less elastic (more inelastic) because consumers have fewer alternatives. The correct answer is the option that pairs these two outcomes: falling average costs and more inelastic demand.
Step-by-Step Reasoning
- Cost effect: The two firms previously produced separately. By merging, they can combine production facilities, avoid duplication, and purchase inputs in larger quantities. This leads to economies of scale, so average cost of production falls.
- Demand effect: Before the merger, each firm faced a relatively elastic demand because consumers could easily switch to the other firm's product. After the merger, there is only one firm selling that product (or at least fewer competitors), so the merged firm's demand curve becomes less elastic (more inelastic). Consumers cannot easily switch to a close substitute, so the firm has more pricing power.
- Combination: The only option that matches both a fall in average costs and a more inelastic demand curve is option B.
Key Takeaways
- Mergers can simultaneously affect both costs and market power.
- Economies of scale lead to lower average costs.
- Reduced competition leads to a more inelastic demand curve for the merging firm.
- In multiple-choice questions, reason through each effect separately before selecting the combination.
Common Mistakes
- Confusing the effect on elasticity: Some students think that a larger firm faces more elastic demand because it is more dominant, but the opposite is true—dominance reduces substitutes and makes demand less elastic.
- Thinking that mergers always raise costs due to inefficiency (diseconomies of scale). While possible, the question says “find it more efficient to merge,” implying cost savings.
- Selecting option A (fall, more elastic) by mistakenly thinking that a larger firm has more competition, or that lower costs make demand more elastic.
Things to Be Careful About
- Read the question carefully: it says “more efficient to merge,” which signals that lower costs are expected.
- Distinguish between the firm’s demand curve and the market demand curve. The merger reduces the number of firms, so the firm’s demand curve becomes less elastic.
- Remember that elasticity is about responsiveness to price changes; market power implies less responsiveness.
The diagram shows the costs and revenues of a firm operating in an imperfect market.
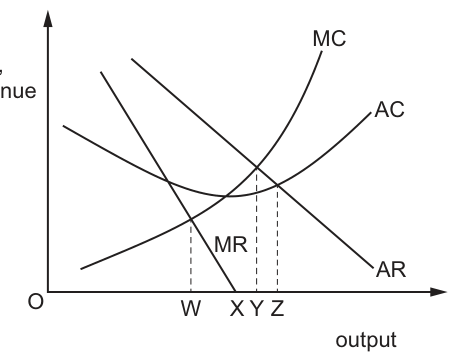
The firm is currently producing at the profit maximising level of output. It wishes to produce at the sales maximising level of output.
What would be the change in its output?
Options
A OW to OX
B OW to OY
C OW to OZ
D OY to OZ
Reasoning
Profit maximisation occurs where marginal cost (MC) equals marginal revenue (MR). On the diagram, the MC and MR curves intersect at output level W, so the current profit-maximising output is OW.
Sales maximisation occurs where total revenue is maximised, which is the output level where marginal revenue (MR) equals zero. On the diagram, the MR curve crosses the horizontal axis at output level Z, so the sales-maximising output is OZ.
The change in output is therefore from OW to OZ.
Answer
C
C
Background Concept
Firms may pursue different objectives depending on their market power and priorities. The traditional neoclassical objective is profit maximisation, achieved at the output where marginal cost (MC, the extra cost of producing one more unit) equals marginal revenue (MR, the extra revenue from selling one more unit). At this point, the firm cannot raise profit by adjusting output, as any additional unit would cost more to produce than the revenue it brings in.
An alternative common objective for firms in imperfect markets is sales maximisation, where the firm aims to maximise its total revenue (total sales income). Total revenue rises as long as MR is positive, peaks when MR equals zero, and falls when MR turns negative (as selling extra units reduces overall revenue). Thus, the sales-maximising output is the level where MR = 0.
Firms in imperfect markets (monopoly, monopolistic competition, oligopoly) face downward-sloping average revenue (AR) and marginal revenue (MR) curves, because they have some price-setting power and must lower the price of all units to sell more output.
Understanding the Question
The question provides a cost and revenue diagram for an imperfect market firm, with four labelled output levels (W, X, Y, Z) linked to different equilibrium points. The firm is currently at the profit-maximising output, and we need to find the change in output if it switches to the sales-maximising output. The four options give pairs of output levels to select from. This 1-mark multiple-choice question tests knowledge of firm objectives and the ability to link theoretical conditions to diagrammatic points.
Approach
We solve this by applying two core rules in sequence:
- Use the MC = MR rule to identify the profit-maximising output on the diagram.
- Use the MR = 0 rule to identify the sales-maximising output on the diagram.
- Select the option that matches the change between these two output levels.
Step-by-Step Reasoning
- Profit-maximising output: The universal condition for profit maximisation is MC = MR. On the diagram, the upward-sloping MC curve intersects the downward-sloping MR curve at the vertical dashed line for output W. This confirms the current profit-maximising output is OW.
- Sales-maximising output: Total revenue is maximised where MR = 0, as this is the final unit where the firm still earns positive revenue from selling an extra unit. The diagram confirms output Z corresponds to the point where the MR curve crosses the horizontal output axis (MR = 0), so this is the sales-maximising output.
- Match to options: The output changes from OW to OZ, which is option C.
It is important to rule out other labelled outputs: Output Y is where AC = AR, the normal profit point where total revenue equals total cost (economic profit is zero), not the sales maximum. Output X is where MC = AR, the allocatively efficient output where price equals marginal cost, a social welfare concept unrelated to the firm's sales objective.
Key Takeaways
- The two core output conditions for firms are: profit maximisation at MC = MR, and sales maximisation at MR = 0 (maximum total revenue).
- For imperfect market firms, downward-sloping MR and AR curves mean MR falls to zero at a positive output level, which is the sales maximum.
- Always match the firm's objective to its correct diagrammatic condition, and avoid confusing sales maximisation with other concepts like normal profit or allocative efficiency.
Common Mistakes
- Confusing sales maximisation with normal profit: Many students incorrectly pick output Y (where AC = AR, normal profit) as the sales maximum. Sales maximisation is about maximising total revenue, not breaking even, so it occurs at MR = 0, not where AC = AR.
- Confusing sales maximisation with allocative efficiency: Output X (MC = AR) is the allocatively efficient output, a common distractor for students who mix up firm objectives with social welfare benchmarks.
- Misapplying the profit maximisation rule: Some students incorrectly use MC = AC (productive efficiency) or MC = AR as the profit maximisation condition, rather than the correct MC = MR rule.
- Misreading the MR curve: Failing to trace the MR curve to the point where it crosses the horizontal axis (MR = 0) and selecting the wrong output level.
Things to Be Careful About
- Always use the correct condition for each firm objective: profit max = MC = MR, sales max = MR = 0.
- When reading the diagram, trace the intersection of the relevant curves to the horizontal axis to confirm the output level.
- The standard 9708 definition of sales maximisation is the output where total revenue is highest (MR = 0), even if this would lead to losses in the short run; the question explicitly states the firm wishes to produce at the sales-maximising level, so we use this definition.
- For imperfect market firms, AR and MR are downward-sloping, so MR will always fall to zero at some positive output level, unlike perfect competition where MR is constant and equal to price.
In which market structure is dynamic efficiency least likely to occur?
Options
A oligopoly
B monopolistic competition
C monopoly
D perfectly competitive
Answer
Dynamic efficiency refers to the ability and incentive of firms to innovate, invest in research and development, and improve production processes over time. It is driven by the prospect of earning supernormal profits in the future, which can be reinvested.
In a perfectly competitive market, firms are price takers and earn only normal profit in the long run. They lack the supernormal profits needed to fund significant R&D and face no incentive to innovate because any innovation is quickly copied by rivals, eroding any temporary advantage. Therefore, dynamic efficiency is least likely to occur in perfect competition.
Answer
D
D
Background Concept
Dynamic efficiency is a concept in industrial economics that focuses on a firm's ability and incentive to improve its products and production processes over time through innovation, research and development (R&D), and investment. It contrasts with static efficiency (allocative and productive efficiency), which concerns the optimal use of resources at a given point in time. Dynamic efficiency is crucial for long-run economic growth and rising living standards.
The key drivers of dynamic efficiency are:
- The ability to innovate: This requires access to funds (often from supernormal profits) to finance R&D and investment in new technology.
- The incentive to innovate: Firms must believe they can capture the benefits of their innovation, at least temporarily, to justify the cost and risk.
Understanding the Question
This multiple-choice question asks you to identify the market structure where dynamic efficiency is least likely to occur. The four options are the classic market structures: oligopoly, monopolistic competition, monopoly, and perfect competition. The question tests your understanding of how market structure affects a firm's behaviour regarding innovation and long-term investment.
Approach
To answer this, you need to evaluate each market structure against the two key drivers of dynamic efficiency: ability and incentive to innovate. The structure that scores lowest on both is the correct answer.
- Monopoly: High ability (supernormal profits) and high incentive (can protect innovation through barriers to entry). Very likely to be dynamically efficient.
- Oligopoly: High ability (often supernormal profits) and high incentive (fierce non-price competition, fear of being left behind). Very likely to be dynamically efficient.
- Monopolistic competition: Moderate ability (some supernormal profit in the short run, but only normal profit in the long run) and moderate incentive (product differentiation is key, but innovation is easily copied). Some dynamic efficiency possible, but limited.
- Perfect competition: Low ability (only normal profit in the long run) and low incentive (any innovation is instantly copied by free entry, so no temporary advantage). Least likely to be dynamically efficient.
Step-by-Step Reasoning
- Define dynamic efficiency: It is the ability and incentive of firms to innovate and improve over time.
- Analyse perfect competition (Option D):
- Ability: In the long run, firms in perfect competition earn only normal profit (zero supernormal profit). They have no surplus funds to invest in R&D.
- Incentive: Even if a firm innovates, the assumption of perfect information and free entry means other firms will immediately copy the innovation. The innovating firm cannot earn any supernormal profit from its innovation, so there is no reward for the cost and risk. Therefore, the incentive is zero.
- Conclusion: Perfect competition provides neither the ability nor the incentive for dynamic efficiency. It is the least likely structure.
- Analyse monopoly (Option C):
- Ability: Monopolies earn supernormal profits in the long run due to barriers to entry. These profits can be used to fund R&D.
- Incentive: A monopoly can protect its innovation through patents or other barriers, allowing it to earn even higher profits. There is a strong incentive to innovate to maintain or strengthen its market position.
- Conclusion: Monopoly is highly conducive to dynamic efficiency.
- Analyse oligopoly (Option A):
- Ability: Oligopolies often earn supernormal profits, providing funds for R&D.
- Incentive: Oligopolistic firms engage in non-price competition, including product innovation and process improvement, to gain a competitive edge. The fear of rivals innovating first (the 'prisoner's dilemma' dynamic) provides a strong incentive.
- Conclusion: Oligopoly is also highly conducive to dynamic efficiency.
- Analyse monopolistic competition (Option B):
- Ability: Firms earn supernormal profit in the short run, but free entry erodes this to normal profit in the long run. The ability to fund R&D is limited compared to monopoly or oligopoly.
- Incentive: Product differentiation is central, so there is some incentive to innovate. However, innovations are relatively easy to copy (low barriers to imitation), limiting the reward. Some dynamic efficiency is possible, but it is less than in monopoly or oligopoly.
- Conclusion: Monopolistic competition has some potential for dynamic efficiency, but it is not the least likely.
Key Takeaways
- Dynamic efficiency is about innovation and long-run improvement, driven by the ability to fund R&D and the incentive to capture its benefits.
- Market structures with high barriers to entry and the potential for sustained supernormal profits (monopoly, oligopoly) are most conducive to dynamic efficiency.
- Perfect competition, with its zero long-run profits and easy imitation, provides the weakest environment for dynamic efficiency.
- This question illustrates a key trade-off: static efficiency (allocative and productive) is highest in perfect competition, but dynamic efficiency is lowest there.
Common Mistakes
- Confusing static and dynamic efficiency: A student might think perfect competition is 'most efficient' in general and incorrectly choose another option. The question specifically asks about dynamic efficiency.
- Overlooking the 'least likely' phrasing: The question asks for the structure where it is least likely, not most. A student might correctly identify that monopoly is dynamically efficient but then choose it as the answer.
- Assuming monopolistic competition is the worst: While monopolistic competition has limited dynamic efficiency, perfect competition is even worse because it lacks both the ability and the incentive.
Things to Be Careful About
- Read the question carefully: 'least likely' is the key qualifier.
- Remember that 'efficiency' has multiple dimensions. This question tests a specific one.
- The logic relies on the theoretical assumptions of each market structure (e.g., perfect information, free entry, homogeneous products in perfect competition). In the real world, some perfectly competitive industries do innovate, but the theoretical model predicts they will not.
Which type of employment contract is most likely to overcome the principal agent problem?
Options
A increasing monthly salaries of waiters in a restaurant to decrease their dependence on tips from customers
B linking workers' pay with the profits of the firm to motivate them to raise the profitability of the firm
C making full fee payment in advance to a lawyer to motivate him to prepare a legal case well
D offering permanent contracts to give workers job security
Answer
The principal-agent problem arises when the agent (e.g., employee) has objectives that differ from those of the principal (e.g., owner of the firm) and the principal cannot perfectly monitor the agent's actions. To overcome this, the contract should align the agent's incentives with the principal's objectives.
- Option B links workers' pay directly to the firm's profitability, giving workers a financial incentive to act in the owners' interests by raising profitability. This directly aligns the agent's reward with the principal's goal, making it the most effective solution.
- Option A: Increasing monthly salaries reduces dependence on tips but does not tie pay to the firm's performance; waiters still have no incentive to increase restaurant profitability.
- Option C: Full fee payment in advance removes the lawyer's incentive to perform well since payment is guaranteed regardless of effort.
- Option D: Permanent contracts provide job security but do not link pay or job retention to the firm's success; the agent may still shirk.
Therefore, B is the correct answer.
B
Background Concept
The principal-agent problem is a core concept in the economics of firm behaviour. It occurs when one party (the principal) hires another party (the agent) to perform a task, but the agent has different objectives and more information about their own actions. The principal cannot costlessly observe the agent's effort. This leads to moral hazard: the agent may shirk or pursue their own interests at the expense of the principal. The solution is to design a contract that aligns the agent's incentives with the principal's goals, often through performance-related pay, profit-sharing, or commissions.
Understanding the Question
The question asks which type of employment contract is most likely to overcome the principal-agent problem. It presents four scenarios, each representing a different incentive structure. The key is to evaluate which contract ties the agent's reward directly to the principal's objective (profitability, case preparation, etc.). The correct answer is the one that gives the agent a clear financial reason to act in the principal's interest.
Approach
For each option, consider:
- What is the principal's objective?
- What is the agent's incentive?
- Does the contract align the two?
Option B explicitly links the agent's pay to the firm's profit, which is exactly the principal's goal. Options A, C, and D sever the link between effort and reward, making them poor solutions.
Step-by-Step Reasoning
- Option A: Waiters receive a higher fixed salary, so they are less dependent on tips. Tips are a form of performance-related pay (good service leads to higher tips). By reducing the importance of tips, the contract weakens the incentive to work hard. The principal (restaurant owner) wants high customer satisfaction and repeat business, but the waiter now has less reason to provide good service. This worsens the principal-agent problem.
- Option B: Workers' pay is linked to the firm's profits. This means if the firm earns more, workers earn more. Workers have a direct financial incentive to increase profitability, which aligns with the owners' objective. This is a classic solution to the principal-agent problem: profit-sharing or performance-related pay.
- Option C: The lawyer is paid in full upfront. Once the payment is received, the lawyer has no financial incentive to prepare the case well. The lawyer may still do a good job out of professional ethics, but the contract does not align incentives. In fact, it creates a moral hazard: the lawyer can shirk without losing income. This is likely to worsen the problem.
- Option D: Permanent contracts give job security, which reduces the threat of dismissal. Without a link to performance, the worker may have less incentive to work hard. While job security can increase loyalty, it does not directly tie effort to the firm's success. The principal-agent problem remains.
Thus, only Option B provides a mechanism to align the agent's self-interest with the principal's goal.
Key Takeaways
The principal-agent problem is addressed by designing contracts that link the agent's reward to outcomes the principal cares about. Profit-sharing, bonuses, commissions, and stock options are common real-world examples. The question tests the ability to apply this principle to different contractual arrangements.
Common Mistakes
- Choosing Option A: thinking that higher salaries alone motivate workers, but ignoring that the link to performance is weakened.
- Choosing Option C: assuming that upfront payment ensures effort, but it actually removes the incentive to perform.
- Choosing Option D: confusing job security with motivation; security does not align interests.
Common error: focusing on the 'goodness' of the contract in general rather than its effect on the principal-agent problem specifically.
Things to Be Careful About
- The question asks for the contract most likely to overcome the problem. Even if some contracts have other benefits, only B directly addresses the misalignment of incentives.
- Understand that the principal-agent problem is about conflicting objectives, not just about effort. The contract must make the agent's objective coincide with the principal's.
- Read each option carefully: 'linking workers' pay with the profits of the firm' is the key phrase.
Company R manufactures steel. Company S produces ships. Company T operates oil tankers. Company V operates cruise liners.
Which statement is correct?
Options
A If R takes over S, this is an example of forwards vertical integration.
B If S takes over V, this is an example of backwards vertical integration.
C If T takes over S, this is an example of diversification.
D If V takes over S, this is an example of horizontal integration.
Reasoning
A steel manufacturer (R) is a supplier to a shipbuilder (S). If the steel manufacturer takes over the shipbuilder, it is integrating forward into the next stage of the production chain. This is forwards vertical integration. Thus option A is correct.
Option B: If S (shipbuilder) takes over V (cruise liner operator), S is integrating forward (towards the customer), not backwards. So B is incorrect.
Option C: If T (oil tanker operator) takes over S (shipbuilder), T is integrating backward into its supplier. This is backwards vertical integration, not diversification. So C is incorrect.
Option D: If V (cruise liner operator) takes over S (shipbuilder), that is also backwards vertical integration, not horizontal integration (which would require two firms in the same industry). So D is incorrect.
Answer
A
A
Background Concept
When firms grow through mergers or takeovers, the type of integration indicates the relationship between the firms' activities in the production chain or market.
- Vertical integration occurs when a firm takes over another firm that is either a supplier (backwards vertical integration) or a customer (forwards vertical integration). It links different stages of the same production process.
- Horizontal integration occurs when a firm takes over another firm in the same industry and at the same stage of production (e.g., two car manufacturers merging).
- Conglomerate integration (diversification) occurs when a firm takes over another firm in an entirely different industry, unrelated to its core business.
Understanding the Question
The question presents four companies in a production chain: R (steel manufacturer) → S (shipbuilder) → T (oil tanker operator) and V (cruise liner operator). The steel is an input to shipbuilding, and ships are used by both T and V. The question asks which statement about the type of integration is correct. It tests the ability to correctly identify the direction of integration (forwards vs backwards) and to distinguish between vertical, horizontal, and conglomerate integration.
Approach
For each option, determine the relationship between the two firms: which is upstream (supplier) and which is downstream (customer). Then classify the merger:
- If the acquirer is upstream and the target is downstream → forwards vertical integration.
- If the acquirer is downstream and the target is upstream → backwards vertical integration.
- If the two firms are in the same industry and same stage → horizontal integration.
- If the two firms are in unrelated industries → conglomerate integration (diversification).
Apply this to each option and check the description given.
Step-by-Step Reasoning
-
Supply chain order: R (steel) → S (ships) → T and V (ship operators).
- R is upstream of S.
- S is upstream of both T and V.
-
Option A: R takes over S. R is upstream of S, so R is moving forward towards its customer. This is forwards vertical integration. The statement is correct.
-
Option B: S takes over V. S is upstream of V, so S is moving forward towards its customer. This is forwards vertical integration, not backwards. The statement says 'backwards vertical integration', so it is incorrect.
-
Option C: T takes over S. T is downstream of S (uses ships), so T is moving backward to its supplier. This is backwards vertical integration, not diversification. The statement says 'diversification', which is incorrect because the industries are related (shipbuilding and ship operation).
-
Option D: V takes over S. V is downstream of S, so again this is backwards vertical integration. The statement says 'horizontal integration', which would require both firms to be in the same industry (e.g., two cruise liner operators). Since V is a cruise operator and S is a shipbuilder, they are in different industries, so it is not horizontal. The statement is incorrect.
Therefore, only option A is correct.
Key Takeaways
- Understand the direction of the supply chain to determine forwards vs backwards vertical integration.
- Vertical integration involves different stages of the same production chain.
- Horizontal integration involves firms at the same stage in the same industry.
- Conglomerate integration (diversification) involves firms in unrelated industries.
Common Mistakes
- Confusing forwards and backwards: remember that 'forwards' means moving towards the final customer (downstream), 'backwards' means moving towards the raw material supplier (upstream).
- Thinking that any merger between a supplier and a customer is 'diversification' – but if they are part of the same production chain, it is vertical integration, not diversification.
- Misidentifying horizontal integration: two firms in different industries cannot be horizontal, even if they produce similar products (e.g., a shipbuilder and a cruise operator are not in the same industry; one builds ships, the other operates them).
Things to Be Careful About
- Always identify the correct direction of the supply chain from the given description.
- Read the exact wording of each option: 'forwards vertical integration', 'backwards vertical integration', 'diversification', 'horizontal integration'. Match the description to the actual relationship.
- For a question like this, a simple diagram of the supply chain can help visualise the direction.
There are two firms in an industry. Firm X faces a choice. It can either act independently or work with its rival. If it acts independently its profit could be $900 a week but it could be only $400 a week depending on what its rival does. If it works with its rival the joint profit of the two firms together would be $1400, $700 each. It has no knowledge of what the rival's policy will be.
Which concept describes this situation?
Options
A contestable market
B kinked demand curve
C principal agent problem
D prisoner's dilemma
Answer
The situation described is a classic prisoner's dilemma: two firms have a choice between acting independently (defecting) or cooperating. The profit outcomes depend on the rival's decision, and each firm lacks information about the other's choice. This strategic interdependence and the incentive to defect even though cooperation would yield a higher joint profit is the essence of the prisoner's dilemma. Therefore, the correct answer is D.
D
Background Concept
The prisoner's dilemma is a fundamental concept in game theory, often used to analyse strategic behaviour in oligopoly markets. It illustrates a situation where two rational individuals (or firms) acting in their own self-interest do not produce the best collective outcome. In the standard two-player prisoner's dilemma, each player has two options: cooperate (e.g., collude or work together) or defect (e.g., cheat or act independently). The payoffs are arranged such that:
- If both cooperate, they receive a moderate reward (mutual cooperation).
- If both defect, they receive a low punishment (mutual defection).
- If one cooperates and the other defects, the defector gets the highest reward (temptation) and the cooperator gets the lowest (sucker's payoff).
Because each player fears being the sucker, and each has a dominant strategy to defect, the outcome is that both defect, even though mutual cooperation would have made them better off. This demonstrates the conflict between individual and collective rationality.
Understanding the Question
The question presents a scenario: two firms, Firm X and an unnamed rival. Firm X can either act independently (defect) or work with the rival (cooperate). The profits are given:
- If X acts independently, its profit could be $900 (if the rival cooperates?) or $400 (if the rival also defects?). The wording says: "If it acts independently its profit could be $900 a week but it could be only $400 a week depending on what its rival does." So the independent action yields $900 when the rival cooperates, and $400 when the rival also defects.
- If X works with the rival, joint profit is $1400, $700 each. So cooperation yields $700 each if both cooperate.
X has no knowledge of the rival's policy. This is a classic prisoner's dilemma payoff structure: defecting yields a higher payoff if the other cooperates ($900 > $700) but a lower payoff if the other defects ($400 < $700). The dominant strategy is to defect, leading to $400 each, which is worse than the $700 each from cooperation. The question asks which concept describes this situation.
Approach
We need to identify the concept from the four options. The correct concept is the one that directly matches the strategic interdependence, the payoff structure, and the dilemma. The prisoner's dilemma is the only option that precisely describes this scenario. The other options are incorrect:
- Contestable market: a market with low barriers to entry and exit, where firms behave competitively even if few firms exist. No element of strategic interdependence or payoff matrix.
- Kinked demand curve: a model explaining price rigidity in oligopoly, based on the assumption that rivals will match price cuts but not price increases. It does not involve a choice between cooperation and defection with a payoff matrix.
- Principal-agent problem: a conflict of interest between a principal (e.g., owner) and an agent (e.g., manager) due to differing objectives and asymmetric information. Not relevant to two firms facing each other.
Step-by-Step Reasoning
-
Identify the key features of the scenario:
- Two firms.
- Each has two possible actions: act independently (defect) or work with rival (cooperate).
- The profit outcome for each depends on the action of the other.
- The payoff structure: if both cooperate, each gets $700; if both defect, each gets $400; if one cooperates and the other defects, the defector gets $900 and the cooperator gets $400 (or some variation).
- Firm X has no knowledge of the rival's policy, meaning uncertainty.
-
Match these features to the prisoner's dilemma:
- The prisoner's dilemma is defined by a payoff matrix where each player has a dominant strategy to defect, leading to a worse outcome than if both cooperated.
- Here, the dominant strategy for each is to act independently: if the rival cooperates, independent action yields $900 > $700; if the rival defects, independent action yields $400 = $400 (but note: if both defect, independent action yields $400, which is the same as cooperating would yield? Actually, if X cooperates and rival defects, X gets $400; if X defects and rival defects, X gets $400. So independent action is at least as good as cooperating regardless of the rival's action. Actually, if rival cooperates, independent gives $900 > $700; if rival defects, independent gives $400 = cooperating? The cooperating payoff when rival defects is not given directly, but we can infer from joint profit: if X works with rival but rival acts independently, then joint profit is not $1400; the scenario says "If it works with its rival the joint profit of the two firms together would be $1400, $700 each." This implies that cooperation is only profitable if both cooperate. If one works with rival and the other acts independently, the joint profit is not $1400; the payoffs are not fully specified. But the essence is that independent action can be more profitable if the other cooperates, and less profitable if the other also defects. This is the classic prisoner's dilemma.
-
Rule out other options:
- Contestable market: No mention of barriers to entry, hit-and-run entry, or competitive pressure.
- Kinked demand curve: No mention of price changes, price rigidity, or demand curve shape.
- Principal-agent problem: No mention of owners vs managers, asymmetric information, or differing objectives.
-
Therefore, the correct answer is D: prisoner's dilemma.
Key Takeaways
- The prisoner's dilemma is a key concept in oligopoly theory, explaining why firms may not collude even when it is mutually beneficial.
- It is characterised by a payoff matrix with a dominant strategy to defect, leading to a suboptimal outcome.
- Recognising the structure of strategic interdependence is crucial for identifying the prisoner's dilemma.
Common Mistakes
- Confusing the prisoner's dilemma with the kinked demand curve: both are oligopoly models, but the kinked demand curve focuses on price rigidity, not on cooperation vs defection.
- Thinking that the principal-agent problem involves two firms: it is internal to a firm.
- Assuming that any situation with two firms and uncertainty is a contestable market: contestability is about entry threats, not strategic interaction.
Things to Be Careful About
- Pay attention to the payoff structure: the prisoner's dilemma requires that defecting is a dominant strategy and that mutual cooperation is better than mutual defection.
- The question does not provide a full payoff matrix, but the description is sufficient to identify the concept.
- In multiple-choice questions, eliminate clearly wrong options first to narrow down choices.
A government wishes to use market forces to remove a negative externality in the consumption of a good.
Which policy is likely to be the most effective?
Options
A It should provide information about the undesirable side-effects of the good.
B It should give producers a subsidy, to allow consumers to purchase the product more cheaply.
C It should impose an indirect tax on consumers, to reduce consumption to the socially efficient level.
D It should not interfere at all, to allow the free market to generate maximum efficiency.
Reasoning
A negative externality in consumption means that the social cost of consumption exceeds the private cost, leading to overconsumption at the free-market equilibrium. The government wants to use market forces to correct this. An indirect tax on consumers (option C) raises the private cost of consumption, shifting the supply curve (or the price paid by consumers) upward, reducing quantity demanded to the socially efficient level where MSB = MSC. This directly uses the price mechanism to internalise the externality.
Option A (providing information) may help but relies on consumers changing behaviour voluntarily, which is often insufficient to fully correct the externality. Option B (subsidy) would lower the price and increase consumption, worsening the problem. Option D (no interference) leaves the market failure uncorrected.
Answer
C
C
Background Concept
A negative externality of consumption occurs when the consumption of a good or service imposes costs on third parties that are not reflected in the market price. For example, smoking creates health costs for non-smokers (passive smoking) and strains public healthcare systems. The private benefit (MPB) to the consumer is less than the social benefit (MSB) because the consumer ignores these external costs. In a free market, the equilibrium quantity (where MPB = MPC) exceeds the socially efficient quantity (where MSB = MSC), resulting in a deadweight welfare loss.
To correct this, the government can use policies that internalise the externality — making consumers or producers face the full social cost. Using market forces means adjusting prices or incentives so that the market itself moves towards the efficient outcome, rather than using direct regulation or bans.
Understanding the Question
The question asks which policy is "likely to be the most effective" in using market forces to remove a negative externality in consumption. The key phrase is "use market forces" — the policy should work through the price mechanism, not through direct control or information campaigns. The government wants to reduce consumption to the socially efficient level.
Approach
Evaluate each option against the criterion of whether it uses market forces to align private costs with social costs. Option C (indirect tax) directly raises the price consumers pay, reducing quantity demanded along the demand curve — a classic market-based solution. Option A (information) is a nudge, not a market force. Option B (subsidy) moves the price in the wrong direction. Option D (no interference) does nothing.
Step-by-Step Reasoning
- Identify the market failure: Negative externality of consumption → overconsumption → deadweight loss.
- Goal: Reduce consumption to the socially efficient level using market forces.
- Evaluate each option:
- A: Providing information may increase consumer awareness and reduce demand somewhat, but it does not change the price mechanism directly. Many consumers may ignore the information, so it is unlikely to fully correct the externality. Not the most effective.
- B: A subsidy to producers lowers the price, encouraging more consumption — the opposite of what is needed. This would worsen the externality.
- C: An indirect tax (e.g., a specific tax per unit) increases the price consumers pay, reducing quantity demanded. If set equal to the marginal external cost (MEC), it internalises the externality, shifting the market equilibrium towards the socially efficient quantity. This directly uses the price mechanism — a market force.
- D: No interference leaves the market failure uncorrected; the free market produces maximum private surplus but not maximum social welfare.
- Conclusion: Option C is the most effective because it directly uses the price mechanism to align private and social costs.
Key Takeaways
- Negative externalities of consumption lead to overconsumption; the remedy is to raise the private cost to match the social cost.
- An indirect tax (Pigouvian tax) is the classic market-based solution because it works through the price mechanism.
- Information provision and subsidies are less effective or counterproductive for this specific problem.
- "Using market forces" means adjusting prices or incentives, not direct regulation or voluntary measures.
Common Mistakes
- Choosing A (information) because it seems like a gentle nudge — but the question asks for the "most effective" use of market forces, and information does not directly change prices.
- Choosing B (subsidy) without realising it would increase consumption, worsening the externality.
- Choosing D (no interference) because of a belief in free markets — but the question explicitly states there is a negative externality, so the free market is inefficient.
Things to Be Careful About
- Distinguish between externalities of consumption and production — the policy response differs (tax on consumption vs. tax on production).
- An indirect tax on consumers (option C) is effectively the same as a tax on producers in terms of market outcome — the incidence depends on elasticities, but the quantity reduction is the same.
- The question specifies "use market forces" — this excludes direct regulation (e.g., bans) which might also be effective but are not market-based.
A government decides to replace a private company with its own company to collect household waste.
Why could such action be justified?
Options
A Waste collection is a public good.
B Costs of waste collection are bound to be lower if paid out of local taxes.
C Private companies are always less efficient than government companies.
D Private companies might put profits before customer needs.
Answer
Waste collection is not a public good because it is rivalrous and excludable. Option A is therefore incorrect.
Option B is an unsupported assertion; costs are not necessarily lower under public provision.
Option C is a false generalisation; private companies can be more efficient due to profit incentives.
Option D is correct: a private company may prioritise profit over service quality or environmental standards, and government provision can ensure that customer needs (e.g. universal, reliable collection) are met.
D
Background Concept
Nationalisation occurs when a government takes over the provision of a good or service previously supplied by the private sector. The economic justification typically rests on market failure: private firms may under-provide goods with positive externalities, exploit monopoly power, or neglect non-profit objectives such as equity, quality, or environmental protection. However, government failure is also possible, so the case must be assessed case by case.
Understanding the Question
The question asks why replacing a private waste collection company with a government-owned one could be justified. The four options present different rationales. The correct answer must be a valid economic reason, not a false statement or an irrelevant one.
Approach
Evaluate each option in turn:
- Check whether waste collection is a public good (non-rivalrous and non-excludable).
- Assess the claim about costs under public provision.
- Consider the generalisation about private versus public efficiency.
- Identify the most plausible justification: that private firms may prioritise profit over customer welfare.
Step-by-Step Reasoning
Option A: A public good is both non-rivalrous (one person's consumption does not reduce availability for others) and non-excludable (it is impossible to prevent anyone from consuming it). Waste collection is rivalrous (a truck collecting one household's waste cannot simultaneously collect another's) and excludable (a company can refuse service to non-payers). It is therefore not a public good. Option A is incorrect.
Option B: There is no inherent reason why costs are lower when paid out of local taxes. Public provision may face bureaucratic inefficiencies, while private firms may have stronger cost-control incentives. The statement is an unsupported assertion. Option B is incorrect.
Option C: This is a false generalisation. Private companies often have stronger profit motives and competitive pressures that can drive efficiency. Government companies may be less efficient due to lack of competition or softer budget constraints. The statement is not universally true. Option C is incorrect.
Option D: This is a valid concern. A private company's primary objective is profit maximisation. It may cut corners on service quality, environmental standards, or coverage to reduce costs and increase profits. Government provision can be justified to ensure that customer needs (e.g. universal, reliable, environmentally sound collection) are prioritised over profit. This is a recognised rationale for nationalisation. Option D is correct.
Key Takeaways
- Nationalisation is justified when private provision leads to market failure, such as neglect of non-profit objectives.
- Public goods have specific characteristics (non-rivalry, non-excludability); waste collection does not meet them.
- Efficiency comparisons between public and private provision are context-dependent and cannot be generalised.
Common Mistakes
- Confusing a merit good (which has positive externalities) with a public good. Waste collection has positive externalities (clean streets, reduced disease) but is not a public good.
- Assuming that public provision is always cheaper or more efficient. This is not supported by economic theory or evidence.
- Accepting sweeping generalisations about private versus public efficiency without considering specific market conditions.
Things to Be Careful About
- Read each option carefully; some may contain plausible-sounding but false statements.
- Remember the precise definition of a public good: both non-rivalrous AND non-excludable.
- Recognise that the justification for government intervention must be based on a specific market failure, not on unsupported claims.
What is a failure of government microeconomic intervention?
Options
A An indirect tax equal to external costs is imposed on cigarettes and the demand falls.
B Limits are placed on a trade union's restrictions that increase labour mobility.
C Price controls on bread are removed which allow a free market to operate.
D Tariffs are imposed on imported goods which cause the Gini coefficient to increase.
Answer
Government failure occurs when government intervention leads to a net welfare loss, making the outcome worse than the original market failure. Option D describes a tariff imposed on imports. While a tariff may protect domestic industries, it raises prices for consumers and can worsen income inequality, as measured by an increase in the Gini coefficient. This unintended worsening of equity is a clear example of government failure.
Option A is a textbook Pigouvian tax that corrects a negative externality — this is a success, not a failure. Option B reduces union power and increases labour mobility, which improves market efficiency. Option C removes a price control and allows the free market to allocate resources, which is deregulation, not a failure.
Answer
D
D
Background Concept
Government failure occurs when government intervention in a market results in a net welfare loss — that is, the costs of the intervention exceed the benefits, or the intervention creates new inefficiencies or inequities that are worse than the original market failure. Common causes include: unintended consequences, information problems, regulatory capture, administrative costs, and the distortion of incentives. The Gini coefficient is a measure of income or wealth inequality, ranging from 0 (perfect equality) to 1 (perfect inequality). An increase in the Gini coefficient indicates rising inequality.
Understanding the Question
This is a multiple-choice question asking which of four scenarios represents a failure of government microeconomic intervention. Each option describes a government policy and its outcome. The task is to identify the one where the outcome is a net welfare loss — i.e., the intervention makes things worse, not better. The correct answer is the option where the policy's unintended consequence (increased inequality) constitutes a failure.
Approach
For each option, evaluate whether the described outcome is a success (correcting a market failure) or a failure (creating a new problem or making the original one worse). The key is to recognise that government failure is not about any intervention, but about intervention that backfires. Option D is the only one where the outcome is clearly negative and unintended relative to the policy's likely aim.
Step-by-Step Reasoning
- Option A: An indirect tax equal to external costs is a Pigouvian tax — a textbook solution to a negative externality. If demand falls, that is the intended effect: reducing consumption of a harmful good. This is a success, not a failure.
- Option B: Limiting trade union restrictions that increase labour mobility improves the functioning of the labour market. This is deregulation aimed at reducing market imperfections, not a failure.
- Option C: Removing price controls and allowing a free market to operate is deregulation. If the market then allocates resources efficiently, this is a correction of a previous government failure (the price control itself). Not a failure.
- Option D: A tariff on imports is a protectionist policy. While it may protect domestic industries, it raises prices for consumers and can worsen income inequality (as shown by an increase in the Gini coefficient). This unintended consequence — making the distribution of income more unequal — is a classic example of government failure: the intervention creates a new problem (inequity) that may outweigh any intended benefits.
Key Takeaways
- Government failure is not simply any intervention; it is intervention that makes things worse on balance.
- The Gini coefficient is a key measure of inequality used in evaluating equity outcomes of policy.
- A policy can succeed in one objective (e.g., protecting an industry) while failing in another (e.g., equity), and the net effect may be a failure.
Common Mistakes
- Confusing any intervention with government failure. Options A, B, and C are all examples of successful intervention or deregulation.
- Not recognising that a tariff's effect on inequality is a form of government failure.
- Thinking that any policy that changes market outcomes is a failure — the question asks for a failure, not just any intervention.
Things to Be Careful About
- Read each option carefully: the outcome described must be a negative consequence of the intervention, not just a change.
- Remember that government failure is about net welfare loss — the policy may have some benefits, but if the costs (including unintended consequences) outweigh them, it is a failure.
- The Gini coefficient is a specific indicator; an increase means rising inequality, which is generally considered a negative outcome for equity.
What would shift the marginal revenue product curve for workers producing electric vehicles to the right?
Options
A a decrease in the price of petrol vehicles
B a decrease in the productivity of electric vehicles workers
C an increase in the price of electric vehicles
D an increase in the wage rate of electric vehicles workers
Answer
The marginal revenue product (MRP) of labour is given by MRP = MPP × P, where MPP is the marginal physical product of labour and P is the price of the output. A rightward shift of the MRP curve means that at every wage rate, the firm demands more labour. This can be caused by an increase in the price of the output (P) or an increase in the productivity of labour (MPP).
Option C — an increase in the price of electric vehicles — raises the value of each worker's output, shifting the MRP curve to the right.
Option A is incorrect: a decrease in the price of petrol vehicles is a change in the price of a substitute good, which may affect the demand for electric vehicles but does not directly change the MRP of electric vehicle workers. Option B is incorrect: a decrease in productivity reduces MPP, shifting the MRP curve to the left. Option D is incorrect: an increase in the wage rate is a movement along the existing MRP curve, not a shift of the curve itself.
Answer
C
C
Background Concept
The marginal revenue product (MRP) of labour is the additional revenue a firm earns by employing one more unit of labour. It is calculated as:
MRP = MPP × P
where MPP (marginal physical product) is the extra output produced by the additional worker, and P is the price at which that output is sold. The MRP curve for a firm in a perfectly competitive product market is the firm's demand curve for labour. A rightward shift of the MRP curve means that at any given wage rate, the firm is willing to hire more workers. This occurs when either MPP increases (workers become more productive) or P increases (the output sells for a higher price).
Understanding the Question
The question asks which event would shift the MRP curve for workers producing electric vehicles to the right. The key is to distinguish between factors that shift the curve (changes in productivity or output price) and factors that cause a movement along the curve (changes in the wage rate). The four options test this distinction.
Approach
Apply the MRP formula to each option:
- If the change increases either MPP or P, the MRP curve shifts right.
- If the change decreases MPP or P, the MRP curve shifts left.
- If the change is a change in the wage rate, it causes a movement along the curve, not a shift.
Step-by-Step Reasoning
-
Option A: a decrease in the price of petrol vehicles. Petrol vehicles are a substitute for electric vehicles. A fall in their price may reduce demand for electric vehicles, potentially lowering the price of electric vehicles. However, this is an indirect effect and not a direct determinant of MRP. The MRP curve for electric vehicle workers depends on the price of electric vehicles, not the price of substitutes. Therefore, this option does not directly shift the MRP curve.
-
Option B: a decrease in the productivity of electric vehicle workers. This reduces MPP. Since MRP = MPP × P, a lower MPP reduces MRP at every output level, shifting the MRP curve to the left. This is the opposite of what the question asks.
-
Option C: an increase in the price of electric vehicles. This raises P. With MPP unchanged, MRP increases at every level of employment. The MRP curve shifts to the right. This is the correct answer.
-
Option D: an increase in the wage rate of electric vehicle workers. The wage rate is the price of labour, not a determinant of MRP. A higher wage rate means the firm moves up along its existing MRP curve, hiring fewer workers. This is a movement along the curve, not a shift.
Key Takeaways
- The MRP curve is the labour demand curve for a firm in a competitive product market.
- MRP shifts right when output price rises or labour productivity rises.
- MRP shifts left when output price falls or labour productivity falls.
- A change in the wage rate causes a movement along the MRP curve, not a shift.
Common Mistakes
- Confusing a movement along the curve with a shift of the curve. A change in the wage rate (option D) is a movement along, not a shift.
- Thinking that a change in the price of a substitute good directly shifts the MRP curve. It may affect the demand for the product, but the MRP curve is determined by the product's own price and the worker's productivity.
- Forgetting that MRP = MPP × P, so both productivity and output price are shifters.
Things to Be Careful About
- Always distinguish between factors that change the value of a worker's output (shifters) and factors that change the cost of hiring (movement along).
- In multiple-choice questions, read each option carefully and apply the formula directly rather than relying on intuition about market conditions.
The diagram shows a perfectly competitive firm's average product of labour (APL) and marginal product of labour (MPL) curves.
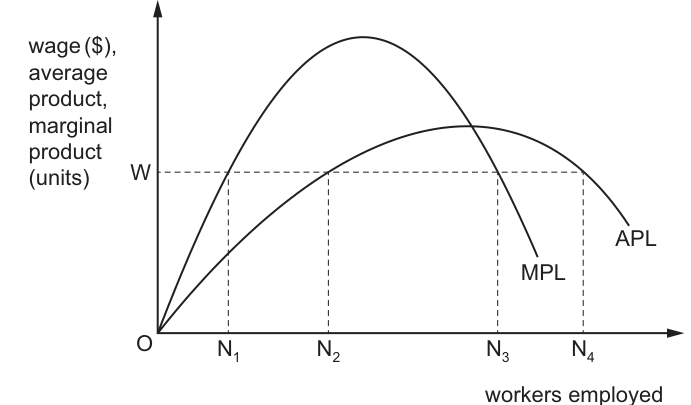
How many workers will the firm employ at a wage of W?
Options
A ON1
B ON2
C ON3
D ON4
Working
A perfectly competitive firm maximises profit by employing labour up to the point where the marginal revenue product (MRP) equals the wage rate. The diagram shows the horizontal wage line W intersecting the marginal product of labour (MPL) curve at employment level N3. At this point, the revenue generated by the last worker equals the wage cost. Employing beyond N3 would mean the MPL (and thus MRP) falls below the wage, reducing profit. Therefore, the firm will employ ON3 workers.
Answer
C
C
Background Concept
The demand for labour is a derived demand, meaning it depends on the demand for the final product. In the short run, a firm's demand for labour is determined by the marginal revenue product (MRP) of labour. MRP is the additional revenue a firm earns from employing one more unit of labour. It is calculated as the marginal product of labour (MPL) multiplied by the marginal revenue (MR) from selling the additional output. For a perfectly competitive firm, MR equals the price (P), so MRP = MPL × P.
Firms maximise profit by employing labour until the point where MRP equals the wage rate (the marginal cost of labour). If MRP > wage, employing another worker adds more to revenue than to cost, increasing profit. If MRP < wage, the worker costs more than they contribute to revenue, so profit falls. The firm therefore employs where MRP = wage.
The diagram also shows the average product of labour (APL), which is total output divided by the number of workers. The MPL curve intersects the APL curve at the maximum point of APL. When MPL > APL, APL is rising; when MPL < APL, APL is falling.
Understanding the Question
The question asks how many workers a perfectly competitive firm will employ when the wage is W. The diagram displays the APL and MPL curves, with a horizontal dashed line at wage W. The intersection of this wage line with the MPL curve occurs at employment level N3. The question tests whether you can apply the MRP theory to identify the profit-maximizing level of employment from the diagram.
Approach
The key is to remember the profit-maximizing condition for labour employment: MRP = wage. Since the diagram shows the MPL curve and the wage line, and assuming the diagram is drawn in value terms (or the product price is $1), the firm employs where MPL = W. Locate this intersection on the horizontal axis to find the employment level.
Step-by-Step Reasoning
-
Identify the profit-maximizing rule: The firm employs labour until the marginal revenue product equals the wage. In this diagram, the wage is given as W.
-
Locate the relevant curve: The MPL curve represents the additional output from an extra worker. Assuming the diagram is drawn in value terms (or Price = $1), the MPL curve also represents the MRP curve. The firm compares this to the wage cost.
-
Find the intersection: The horizontal line at wage W intersects the MPL curve at point N3 on the horizontal axis. This means at N3 workers, the MPL (value of output) equals the wage.
-
Verify the logic:
- At employment levels below N3 (such as N1 and N2), the MPL lies above the wage line W. This means each additional worker contributes more to revenue than they cost in wages, so the firm should continue hiring.
- At N3, MPL = W. This is the optimal point because the last worker hired adds exactly as much to revenue as to cost.
- Beyond N3 (towards N4), the MPL curve falls below the wage line. Employing any additional worker would mean paying them W while they only contribute MPL (in value terms), which is less than W. This would reduce total profit.
-
Eliminate other options:
- ON1 (Option A): This is not where MPL = W. Employing only N1 workers would mean the firm is forgoing the profit from workers 2 through N3, since for each of those workers MPL > W.
- ON2 (Option B): This is where MPL is at its maximum. While this is the point of maximum physical productivity, it is not the profit-maximizing point unless the wage happens to be at that level. Here the wage is W, which is lower than the peak MPL, so the firm should employ beyond N2.
- ON4 (Option D): This is where the APL curve intersects the wage line. At N4, the MPL is below the wage. Employing the worker at N4 would mean paying them W but they only contribute MPL (in value terms) which is less than W. This would reduce total profit.
-
Conclusion: The firm employs N3 workers where MPL = W.
Key Takeaways
- The short-run demand for labour is derived from the marginal revenue product (MRP).
- The profit-maximizing employment level is where MRP = wage.
- In the diagram, this corresponds to the intersection of the wage line and the MPL curve.
- The firm will never employ a worker where MPL < wage, as this reduces profit.
- The APL curve is not directly used for the employment decision, though it helps identify the maximum average product point.
Common Mistakes
- Confusing APL with MPL: Some students mistakenly look for where the wage equals the average product (APL). This is incorrect because the employment decision is based on the marginal contribution of the last worker, not the average.
- Choosing the maximum MPL point: Students may pick N2 because it is the peak of the MPL curve. However, the firm continues to employ workers as long as MPL > wage, which extends beyond the peak until MPL falls to the level of the wage.
- Ignoring the profit-maximizing rule: Failing to apply the MRP = wage condition and instead guessing based on the shape of the curves.
- Misreading the diagram: Not carefully tracing the horizontal wage line to see which curve it intersects and at which point on the horizontal axis.
Things to Be Careful About
- Ensure you identify the MPL curve correctly (the one that rises faster and falls steeper, intersecting APL at its peak).
- The wage line is horizontal because in a perfectly competitive labour market, the firm is a wage taker.
- The employment level is read from the horizontal axis at the point where the wage line meets the MPL curve.
- Remember that the firm equates the wage to the marginal revenue product, not the average product.
Which change is likely to result in a decrease in the demand for money?
Options
A a decrease in the use of credit cards by consumers
B a switch from monthly to weekly payments of wages
C a decrease in interest rates
D an increase in the perceived risks involved in holding government bonds
Reasoning
The demand for money is the desire to hold liquid cash rather than interest-bearing assets. A switch from monthly to weekly wage payments means workers receive smaller amounts more frequently. Since they do not need to hold as large a cash balance between paydays to cover their regular spending, the average amount of money held for transactions falls. This reduces the demand for money.
Answer
B
B
Background Concept
The demand for money refers to the desire of individuals and firms to hold a portion of their wealth in the form of cash or easily accessible bank deposits (liquidity) rather than in interest-bearing assets like bonds or savings accounts. Keynesian liquidity preference theory identifies three motives for holding money:
- Transactions motive – money held to make everyday purchases. The amount depends on the value of transactions and the frequency of income receipts.
- Precautionary motive – money held for unexpected expenses.
- Speculative motive – money held to take advantage of future changes in interest rates or asset prices.
This question tests the transactions motive. The key insight is that the average cash balance a person needs to hold between paydays depends on how often they are paid and how regularly they spend.
Understanding the Question
The question asks which of four changes is likely to decrease the demand for money. Each option describes a different scenario. We need to identify the one that reduces the amount of cash people want to hold at any given time.
- Option A: a decrease in the use of credit cards – this would likely increase the need for cash, not decrease it.
- Option B: a switch from monthly to weekly payments of wages – this changes the frequency of income receipts.
- Option C: a decrease in interest rates – this affects the opportunity cost of holding money.
- Option D: an increase in the perceived risks of holding government bonds – this affects the speculative motive.
Approach
For each option, consider how it affects the three motives for holding money. The correct answer will be the one that unambiguously reduces the amount of cash people want to hold. Focus on the transactions motive for Option B, as it directly relates to the frequency of income receipts.
Step-by-Step Reasoning
Option A: a decrease in the use of credit cards by consumers
- Credit cards allow consumers to delay payment, reducing the need to hold cash for transactions.
- If credit card use decreases, consumers must rely more on cash or debit cards, increasing the transactions demand for money.
- This would increase the demand for money, not decrease it. So A is incorrect.
Option B: a switch from monthly to weekly payments of wages
- Consider a worker paid $1200 per month. They receive the full amount on payday and spend roughly $40 per day. Their average cash balance over the month is about $600 (assuming steady spending).
- If instead they are paid $300 per week, they receive smaller amounts more frequently. Their spending pattern is similar, but they never need to hold more than a week's worth of spending. The average cash balance falls to about $150.
- The total amount of money demanded for transactions decreases because the same volume of spending is spread across more frequent, smaller pay packets.
- This decreases the demand for money. So B is correct.
Option C: a decrease in interest rates
- Interest rates represent the opportunity cost of holding money (the interest forgone by not holding bonds or savings accounts).
- When interest rates fall, the opportunity cost of holding money decreases, so people are more willing to hold cash. This increases the speculative demand for money.
- This would increase the demand for money, not decrease it. So C is incorrect.
Option D: an increase in the perceived risks involved in holding government bonds
- If bonds become riskier, people may prefer to hold money instead, as it is safer (no default risk). This increases the precautionary or speculative demand for money.
- This would increase the demand for money, not decrease it. So D is incorrect.
Therefore, only Option B results in a decrease in the demand for money.
Key Takeaways
- The demand for money is influenced by the frequency of income receipts: more frequent payments reduce the average cash balance needed for transactions.
- The transactions motive is the most directly affected by changes in payment patterns.
- Interest rates affect the opportunity cost of holding money; lower rates increase demand, higher rates decrease it.
- Perceived risk of alternative assets increases the demand for money as a safe haven.
Common Mistakes
- Confusing the demand for money with the supply of money. The question is about people's desire to hold cash, not about the amount of money in the economy.
- Thinking that more frequent payments mean more money is demanded overall. The total amount of money received is the same; only the average balance held changes.
- Misapplying the speculative motive: a decrease in interest rates makes holding money more attractive, not less.
Things to Be Careful About
- Read each option carefully and consider the direction of the effect (increase or decrease).
- Remember that the demand for money is a stock concept (how much cash people want to hold at a point in time), not a flow (how much they spend).
- For the transactions motive, the key variable is the average cash balance, which depends on both the value of transactions and the frequency of receipts.
Which combination of factors is most likely to lead to a decrease in structural unemployment?
Options
A a fall in inflation and an increase in lending for low income households
B a fall in real wages and an increase in subsidies for technological improvements
C an increase in tariffs and lower taxes for new businesses
D the introduction of a national minimum wage and better working conditions
Answer
Structural unemployment arises from a mismatch between the skills and location of workers and the available job vacancies. Policies that directly address this mismatch include protecting domestic industries (tariffs) and encouraging new business creation (lower taxes). Option C combines both: an increase in tariffs can protect jobs in import‑competing sectors, reducing structural unemployment in the short run, while lower taxes for new businesses stimulate the creation of new jobs, which can absorb structurally unemployed workers. The other options either do not address the mismatch or could worsen it. Therefore, C is the correct answer.
C
Background Concept
Structural unemployment is a type of disequilibrium unemployment caused by a persistent mismatch between the skills or location of the labour force and the requirements of available job vacancies. It arises when the structure of the economy changes – for example, due to technological progress, shifts in consumer demand, or the decline of traditional industries. Workers who lose their jobs in shrinking sectors may not have the skills needed in expanding sectors, or they may be geographically distant from growing areas. Unlike cyclical unemployment, structural unemployment does not respond to increases in aggregate demand; it requires supply‑side policies that improve the matching process or create new job opportunities.
Understanding the Question
This multiple‑choice question asks which combination of two factors is most likely to decrease structural unemployment. It tests your understanding of the nature of structural unemployment and your ability to evaluate the likely effects of different policy measures on the labour market. The correct answer is C, which pairs an increase in tariffs (a protectionist trade policy) with lower taxes for new businesses. Both elements can, in different ways, help reduce the mismatch between workers and jobs.
Approach
Start by recalling the defining features of structural unemployment. Then evaluate each option in turn, considering both short‑run and long‑run effects. Focus on whether the policy directly addresses the mismatch of skills or location. Eliminate options that mainly affect aggregate demand or that could worsen the mismatch. Finally, identify the option where both factors work together to reduce structural unemployment.
Step‑by‑Step Reasoning
Option A: a fall in inflation and an increase in lending for low income households
- A fall in inflation is a macroeconomic objective that does not specifically target the skills or location mismatch. It may affect the general business environment but does not directly create jobs in declining sectors or retrain workers.
- Increased lending to low income households can boost consumption and aggregate demand, which might reduce cyclical unemployment but not structural unemployment. Structural unemployment persists even when demand is sufficient because the workers are not in the right place or do not have the right skills.
- Therefore, this combination is unlikely to reduce structural unemployment.
Option B: a fall in real wages and an increase in subsidies for technological improvements
- A fall in real wages makes labour cheaper, which could increase the quantity of labour demanded. However, it does not address the mismatch: if workers lack the skills required for available jobs, lower wages will not make them employable in those jobs. In fact, lower wages might reduce the incentive for workers to retrain.
- Subsidies for technological improvements encourage firms to adopt new technology, which often replaces labour. This can increase structural unemployment by making existing skills obsolete. For example, automation in manufacturing can displace workers who then need to be retrained for new roles.
- This combination is more likely to increase or at least not decrease structural unemployment.
Option C: an increase in tariffs and lower taxes for new businesses
- An increase in tariffs raises the price of imported goods, making domestically produced goods more competitive. This can protect jobs in import‑competing industries, reducing structural unemployment in the short run. However, tariffs are a temporary measure and can lead to retaliation and inefficiency; they do not address the underlying need for structural change.
- Lower taxes for new businesses reduce the cost of starting a firm and encourage entrepreneurship. This can stimulate the creation of new firms and jobs in growing sectors, providing opportunities for workers who have lost jobs in declining industries. This directly helps to close the mismatch by creating new job opportunities.
- The combination of protecting existing jobs and creating new ones is the most likely to reduce structural unemployment. While tariffs alone are not a sustainable solution, in this specific combination they contribute to a short‑term decrease, and the lower taxes for new businesses provide a longer‑term solution.
Option D: the introduction of a national minimum wage and better working conditions
- A national minimum wage increases the cost of labour for employers. For low‑skilled workers, this can reduce the quantity of labour demanded, potentially increasing structural unemployment if those workers are priced out of the market. It may also encourage firms to substitute capital for labour.
- Better working conditions, while beneficial for workers, also raise labour costs and can have a similar effect of reducing demand for labour, particularly for low‑skilled positions.
- This combination is likely to increase structural unemployment, especially among the low‑skilled, who are often the ones facing the greatest mismatch.
Therefore, option C is the correct answer.
Key Takeaways
- Structural unemployment is caused by a mismatch between workers and jobs, not by insufficient aggregate demand.
- Policies that reduce structural unemployment must address the mismatch directly, e.g., by improving training, mobility, or creating new job opportunities.
- Demand‑side policies (e.g., boosting aggregate demand) are ineffective against structural unemployment.
- Tariffs can protect jobs in the short run, but they are not a long‑term solution; combining them with pro‑business policies can produce a more effective outcome.
Common Mistakes
- Confusing structural unemployment with cyclical or frictional unemployment. Many students think that increasing aggregate demand (e.g., through lending) can reduce structural unemployment, but it does not address the mismatch.
- Thinking that lower wages always reduce unemployment; if the mismatch remains, lower wages may not help structurally unemployed workers find jobs in growing sectors.
- Overlooking the dual effect of tariffs: they can protect jobs but also may lead to retaliation and inefficiency. However, in the context of this question, the combination with lower taxes is the most effective.
- Assuming that a minimum wage always reduces unemployment; it can actually increase structural unemployment by pricing low‑skilled workers out of the market.
Things to Be Careful About
- Read each option carefully: it is a combination of two factors. Both must be considered.
- Understand that structural unemployment is persistent and requires supply‑side policies.
- In this multiple‑choice question, the answer is C, but be aware that tariffs alone are not a sustainable long‑term solution; however, combined with lower taxes for new businesses, they can reduce structural unemployment in the short term.
- Remember that the question asks for the combination "most likely" to decrease structural unemployment, so the best among the given options, even if none is perfect.
Why might country X have a higher natural rate of unemployment than country Y?
Options
A There is a higher level of trade unionisation in X.
B There is more training and education in X.
C There are greater incentives to find work in X.
D There is a higher level of job vacancy information in X.
Answer
The natural rate of unemployment is the rate of unemployment that exists when the labour market is in equilibrium, with no cyclical unemployment. It is determined by structural and frictional factors. A higher level of trade unionisation (option A) tends to increase wage rigidities and push wages above the market-clearing level, causing higher equilibrium unemployment and thus a higher natural rate. Options B, C, and D would all reduce the natural rate: more training and education improves occupational mobility and reduces structural unemployment; greater incentives to find work reduce frictional unemployment; better job vacancy information reduces search time and frictional unemployment. Therefore, only option A correctly explains why X might have a higher natural rate.
Answer
A
A
Background Concept
The natural rate of unemployment is the rate of unemployment that persists in the long run when the economy is at potential output. It comprises frictional unemployment (workers between jobs) and structural unemployment (mismatch of skills or location). The natural rate is influenced by institutional factors such as the power of trade unions, the generosity of unemployment benefits, the effectiveness of job-matching services, and the level of training and education. Trade unions can increase the natural rate by bargaining for wages above the market-clearing level, reducing the quantity of labour demanded and creating a surplus (unemployment). Conversely, factors that improve the functioning of the labour market, such as better information or incentives to work, tend to reduce the natural rate.
Understanding the Question
The question asks: "Why might country X have a higher natural rate of unemployment than country Y?" It presents four possible reasons, each as a multiple-choice option. The student must identify which factor would cause a higher natural rate. The correct answer is A: a higher level of trade unionisation. The other options describe factors that would lower the natural rate, not raise it.
Approach
Evaluate each option in turn, using economic theory about the determinants of the natural rate of unemployment. For each, determine whether it would increase or decrease the natural rate. The only option that increases the natural rate is the correct one.
Step-by-Step Reasoning
Option A: Higher level of trade unionisation. Trade unions can negotiate for higher wages than the market-clearing wage. This makes labour more expensive, so firms demand fewer workers, leading to a surplus of labour (unemployment). This structural unemployment becomes part of the natural rate. Therefore, higher trade unionisation raises the natural rate.
Option B: More training and education. Training and education improve the skills of workers, making them more adaptable and reducing structural unemployment. Occupational mobility increases, so workers can move to sectors where labour is needed. This lowers the natural rate.
Option C: Greater incentives to find work. Incentives such as lower unemployment benefits or stricter job-search requirements encourage workers to accept jobs more quickly, reducing frictional unemployment. This lowers the natural rate.
Option D: Higher level of job vacancy information. Better information about job vacancies helps workers find suitable jobs faster, reducing the duration of unemployment and thus frictional unemployment. This also lowers the natural rate.
Therefore, only option A is a reason why country X might have a higher natural rate of unemployment than country Y.
Key Takeaways
- The natural rate of unemployment is determined by structural and frictional factors, not by cyclical demand.
- Trade unions can increase the natural rate by raising wages above equilibrium.
- Policies that improve labour market flexibility (training, information, incentives) reduce the natural rate.
- In multiple-choice questions, it is necessary to evaluate each option against the definition of the concept being tested.
Common Mistakes
- Confusing the natural rate with cyclical unemployment. Cyclical unemployment is caused by insufficient aggregate demand, not by structural factors.
- Thinking that more training and education cause unemployment (they actually reduce structural unemployment).
- Believing that greater incentives to find work increase unemployment (they reduce frictional unemployment because workers search more actively).
- Assuming that better job vacancy information leads to more unemployment (it reduces search time, lowering frictional unemployment).
Things to Be Careful About
- The natural rate is not zero; it includes unavoidable frictional and structural unemployment.
- Trade unions can have other effects, but in the context of the natural rate, their wage-setting power is the key mechanism.
- Read each option carefully and consider the direction of the effect on the natural rate.
- Understand that the question asks for a reason why the natural rate is higher, not lower. Options B, C, and D all describe factors that would lower it.
Over the period of a year, nominal national income increased by 2%, inflation was 3% and population increased by 1%.
Which statement is correct?
Options
A Real income decreased by 2% per head.
B Real income increased by 1% per head.
C Real income increased by 4% per head.
D There was no change in real income per head.
Working
Nominal national income increased by 2%.
Inflation was 3%, so real national income increased by 2% - 3% = -1% (a decrease of 1%).
Population increased by 1%.
Real income per head = Real national income / Population.
Percentage change in real income per head ≈ percentage change in real income - percentage change in population = -1% - 1% = -2%.
Therefore real income per head decreased by 2%.
Answer
A
A
Background Concept
Real national income is nominal national income adjusted for inflation. It measures the actual purchasing power of the income earned in an economy. Real income per head (or per capita) further adjusts for population changes, giving an indication of the average real income per person. When nominal income increases but prices rise faster, real income may fall. Similarly, if population grows faster than real income, real income per head falls.
Understanding the Question
The question provides three percentage changes over a year: nominal national income +2%, inflation +3%, population +1%. We are asked to determine the correct statement about real income per head. Option A claims real income decreased by 2% per head; B increased by 1%; C increased by 4%; D no change. We need to compute the change in real income per head.
Approach
First, adjust nominal income for inflation to get the percentage change in real national income: approximately % change real = % change nominal - % change in prices (inflation). Then adjust for population: percentage change in real income per head ≈ % change real income - % change population. Apply the approximations.
Step-by-Step Reasoning
- Real income change: nominal +2% minus inflation 3% = -1%. So real national income fell by 1%.
- Real income per head: real income divided by population. Percentage change: since both are percentages, we subtract the population growth: -1% - 1% = -2%.
- Check other options: B says +1% – wrong; C +4% – wrong; D no change – wrong.
- Thus A is correct.
Key Takeaways
- To convert nominal to real, subtract the inflation rate.
- To convert per head (per capita), subtract the population growth rate from the real growth rate.
- Approximations using percentage changes work for small changes; exact formula involves division but the approximation is sufficient here.
Common Mistakes
- Forgetting to adjust for both inflation and population – adjusting only one yields the wrong answer.
- Adding percentages instead of subtracting (e.g., real income per head = 2% - 3% + 1% = 0%, leading to D).
- Confusing real income change with real income per head – they are different.
Things to Be Careful About
- Pay attention to the order of subtraction: real = nominal - inflation; real per head = real - population growth.
- Ensure all percentage changes are in the same units (all %). Negative signs matter.
What is likely to be the most effective policy to reduce inflation caused by a rapid rise in import prices?
Options
A a decrease in the domestic rate of interest
B a decrease in the rate of income tax
C an increase in trade tariffs on imports
D a revaluation of the exchange rate
Answer
The inflation is caused by a rapid rise in import prices (cost-push inflation). To reduce it, policy should directly lower the cost of imports. Options A and B are expansionary monetary and fiscal policies that would increase aggregate demand, worsening inflation. Option C, increasing tariffs, would raise the price of imported goods, intensifying the cost-push pressure. Option D, a revaluation of the exchange rate, makes the domestic currency stronger, reducing the domestic currency price of imports and thus directly reducing the cost-push inflation. Therefore, D is the most effective policy.
D
Background Concept
Inflation can be caused by demand-pull (excess aggregate demand) or cost-push (rising costs of production, including import prices). When import prices rise rapidly, the cost of imported raw materials and finished goods increases, leading to higher overall price levels (cost-push inflation). Policies to reduce such inflation should aim to either reduce the cost of imports or reduce aggregate demand to offset the price rise. Exchange rate policy affects the price of imports: a revaluation (strengthening of the domestic currency) makes imports cheaper in domestic currency, thereby reducing cost-push pressures. Conversely, a depreciation would worsen imported inflation.
Understanding the Question
The question asks: "What is likely to be the most effective policy to reduce inflation caused by a rapid rise in import prices?" It is a multiple-choice question with four options. The key is to recognise that the inflation is cost-push, not demand-pull. Therefore, policies that increase aggregate demand (A and B) would be counterproductive, as they add demand-pull on top of cost-push. A tariff (C) would further raise import prices, making inflation worse. Only a revaluation (D) directly addresses the cause by reducing the cost of imports.
Approach
We evaluate each option in turn, considering its effect on the price level given the specific cause of inflation. For each, we ask: does it reduce the cost of imports or reduce aggregate demand? Options A and B increase aggregate demand, which would raise prices further. Option C increases the cost of imports, worsening cost-push. Option D reduces the cost of imports, directly countering the source of inflation. Hence D is the correct choice.
Step-by-Step Reasoning
-
Identify the cause: inflation is due to a rapid rise in import prices. This is cost-push inflation.
-
Evaluate Option A: a decrease in the domestic rate of interest. Lower interest rates stimulate borrowing and spending, increasing aggregate demand. This would add demand-pull inflationary pressure, making overall inflation worse. Therefore, not effective.
-
Evaluate Option B: a decrease in the rate of income tax. Lower income tax increases disposable income, leading to higher consumption and aggregate demand. Again, this raises demand-pull inflation, not suitable for cost-push inflation. Not effective.
-
Evaluate Option C: an increase in trade tariffs on imports. Tariffs are taxes on imports, raising their price. This directly increases the cost of imported goods, exacerbating cost-push inflation. Therefore, counterproductive.
-
Evaluate Option D: a revaluation of the exchange rate. Revaluation means the domestic currency becomes stronger relative to foreign currencies. This makes imports cheaper in domestic currency terms. For example, if the exchange rate moves from 1 USD = 1.5 SGD to 1 USD = 1.3 SGD, then a good priced at 1 USD would cost 1.3 SGD instead of 1.5 SGD, a reduction. This lowers the cost of imported raw materials and finished goods, reducing cost-push inflation. Hence, this directly addresses the cause.
-
Conclusion: Only Option D reduces the cost of imports, making it the most effective policy.
Key Takeaways
- The appropriate policy depends on the cause of inflation. Cost-push inflation requires policies that reduce costs or reduce aggregate demand, not expand it.
- Exchange rate revaluation is a tool to reduce imported inflation, but it may have side effects such as worsening the trade balance (exports become more expensive). However, the question focuses solely on reducing inflation.
- Tariffs, while often protectionist, raise import prices and worsen cost-push inflation. They are not suitable for reducing inflation.
Common Mistakes
- Confusing cost-push and demand-pull inflation: A student might think that any inflation can be reduced by contractionary policy, but here the cause is cost-push, so expansionary policies (A and B) are clearly wrong.
- Thinking that tariffs protect domestic industry but ignoring their inflationary effect on imports.
- Assuming that revaluation is always bad because it hurts exports, but the question is specifically about reducing inflation, making revaluation beneficial in this context.
Things to Be Careful About
- The question says "most effective", implying a comparison. Ensure that the reasoning shows why the other options are not effective or less effective.
- Note that revaluation may also reduce demand-pull if it lowers import prices and thus reduces the cost of living, but the primary effect is on cost-push.
- Do not confuse revaluation with depreciation: revaluation is an increase in the external value of the currency, reducing import prices.
Which macroeconomic policy objective will not apply to a government in a closed economy?
Options
A achieving a low and steady rate of inflation
B achieving a more equal income distribution
C achieving a surplus on the balance of payments
D achieving a sustainable rate of economic growth
Reasoning
In a closed economy, there is no international trade, so the balance of payments does not exist. Therefore, the objective of achieving a surplus on the balance of payments is not applicable.
Answer
C
C
Background Concept
A closed economy is one that does not engage in international trade or financial flows with other countries. All production and consumption occur within its borders. In contrast, an open economy trades goods, services, and assets with the rest of the world. Macroeconomic policy objectives typically include low inflation, full employment, sustainable economic growth, a stable balance of payments, and a more equal distribution of income. The balance of payments objective is concerned with the current account (trade in goods and services) and the financial account (capital flows). In a closed economy, there are no international transactions, so the balance of payments is always zero by definition.
Understanding the Question
The question asks: "Which macroeconomic policy objective will not apply to a government in a closed economy?" The command word is "will not apply," meaning we need to identify the objective that is irrelevant or impossible to pursue in a closed economy. The options are:
- A: achieving a low and steady rate of inflation
- B: achieving a more equal income distribution
- C: achieving a surplus on the balance of payments
- D: achieving a sustainable rate of economic growth
We need to recall that a closed economy has no international trade, so any objective related to international transactions is irrelevant. The balance of payments is the record of a country's transactions with the rest of the world; without such transactions, there is no balance of payments to manage.
Approach
- Define a closed economy.
- Evaluate each option in turn:
- Inflation: can be influenced by domestic monetary and fiscal policy.
- Income distribution: can be addressed through domestic taxation and welfare policies.
- Balance of payments: only exists in an open economy; no external transactions means no surplus or deficit.
- Economic growth: can be pursued through domestic investment, productivity improvements, etc.
- Conclude that option C is the only one that does not apply.
Step-by-Step Reasoning
- Option A: Low inflation. Inflation is a general rise in the price level of goods and services in an economy. A closed economy experiences inflation due to domestic factors (e.g., excess demand, cost-push). The government can control inflation through monetary policy (interest rates, money supply) and fiscal policy (taxation, spending). This objective is fully applicable.
- Option B: More equal income distribution. Income distribution depends on how the market rewards factors of production and how the government redistributes through taxes and transfers. A closed economy still has inequality, and policies like progressive taxation, social benefits, and public services can address it. This objective applies.
- Option C: Surplus on the balance of payments. The balance of payments records all economic transactions between residents of a country and the rest of the world. In a closed economy, there are no such transactions; the balance of payments is always zero. Therefore, there is no such thing as a surplus or deficit. The government cannot aim for a surplus because there is no international trade. This objective does not apply.
- Option D: Sustainable economic growth. Growth in real GDP can be achieved through increased productive capacity, investment, and technological progress, all of which can occur domestically. A closed economy can still grow; it just cannot benefit from trade or foreign investment. This objective applies.
Thus, the correct answer is C.
Key Takeaways
- A closed economy has no international trade or financial flows, so the balance of payments is always zero and not a policy objective.
- Macroeconomic objectives like inflation, growth, and income distribution are universal and apply regardless of openness.
- Understanding the distinction between closed and open economies is crucial for analysing policy options.
Common Mistakes
- Thinking that inflation cannot be controlled in a closed economy – it can, through domestic policies.
- Assuming that economic growth requires international trade – growth can still occur through internal factors.
- Confusing the balance of payments with the government budget deficit – they are different concepts.
Things to Be Careful About
- The term "closed economy" implies no trade, so any objective related to trade or external balance is irrelevant.
- The question asks for the objective that does NOT apply, so focus on the one that is not feasible.
- Ensure you understand the definition of each objective to avoid misapplication.
A government increases its budget deficit to spend money on infrastructure development. It finances this by printing money.
How is this policy likely to affect the government's main macroeconomic policy objectives?
Options
| higher economic growth | lower unemployment | lower inflation | |
|---|---|---|---|
| A | less likely | less likely | more likely |
| B | less likely | more likely | less likely |
| C | more likely | more likely | less likely |
| D | more likely | more likely | more likely |
Reasoning
A government increasing its budget deficit to spend on infrastructure is an expansionary fiscal policy. This increases aggregate demand (AD), which in the short run leads to higher economic growth and lower unemployment. However, financing the deficit by printing money increases the money supply. According to the quantity theory of money (MV = PT), an increase in the money supply, if not matched by an increase in output, leads to a rise in the price level, i.e., higher inflation. Therefore, the policy makes higher growth and lower unemployment more likely, but lower inflation less likely. Option C matches this.
Answer
C
C
Background Concept
Expansionary fiscal policy involves increasing government spending or cutting taxes to stimulate aggregate demand. In this case, the government spends on infrastructure, which directly increases AD through the government spending component. The multiplier effect amplifies the initial spending, leading to even larger increases in national income and output. Higher output typically reduces unemployment, as firms hire more workers to meet the increased demand.
However, the method of financing the deficit matters. Printing money expands the money supply. The quantity theory of money (MV = PT) suggests that if the velocity of money (V) is stable and real output (T) cannot increase in the short run (or increases only slowly), an increase in the money supply (M) will lead to a proportional increase in the price level (P). This means inflation rises. Even if the economy has spare capacity, the printing of money can create demand-pull inflation as the extra money chases the same goods.
Understanding the Question
The question presents a specific policy mix: a deficit-financed infrastructure spending program, where the deficit is funded by printing money. The government's main macroeconomic objectives are typically: higher economic growth, lower unemployment, and lower inflation. The question asks how this policy is likely to affect the likelihood of achieving each objective. It is a multiple-choice question with four options combining "more likely" or "less likely" for each objective.
Approach
To answer, we must analyse the effects of the policy on each objective separately:
- Economic growth: Deficit spending on infrastructure increases AD, which in the short run raises the level of output and growth. So growth is more likely.
- Unemployment: Higher output usually means lower cyclical unemployment. So unemployment is more likely to be lower (i.e., achieving lower unemployment is more likely).
- Inflation: Printing money expands the money supply. If the economy is near full capacity, this will fuel demand-pull inflation. Even if there is slack, the extra money eventually puts upward pressure on prices. So lower inflation is less likely.
Thus, the correct combination is more likely for growth, more likely for lower unemployment, and less likely for lower inflation. That is option C.
Step-by-Step Reasoning
- The government increases spending on infrastructure. This is a direct increase in government expenditure (G), a component of AD (AD = C + I + G + X - M).
- The increase in G raises AD. In the short run, the economy may have spare capacity, so the increase in AD leads to higher real GDP (economic growth) and lower unemployment as firms increase production.
- The multiplier effect means that the initial increase in spending leads to further rounds of consumption, boosting AD further.
- The government finances the deficit by printing money. This increases the money supply (M).
- According to the quantity theory of money, MV = PT. If V and T are relatively fixed in the short run, an increase in M leads to an increase in P (the price level). This is inflation.
- Even if real output (T) increases due to the fiscal expansion, the increase in M may still exceed the increase in T, causing some inflation.
- Therefore, the policy makes it more likely to achieve higher growth and lower unemployment, but less likely to achieve lower inflation.
Key Takeaways
- Expansionary fiscal policy can boost growth and reduce unemployment in the short run.
- Financing deficits by printing money creates inflationary pressure.
- The government's macroeconomic objectives often conflict; in this case, the pursuit of growth and employment comes at the cost of higher inflation.
- The quantity theory of money is a useful tool for understanding the link between money supply growth and inflation.
Common Mistakes
- Choosing option D (all three more likely) because they forget that printing money causes inflation.
- Thinking that deficit spending automatically reduces inflation (e.g., by increasing supply), but infrastructure spending takes time to increase productive capacity, and in the short run it is demand-side.
- Confusing the effects of fiscal policy with monetary policy: the deficit spending is fiscal, but the financing method is monetary. Both matter.
Things to Be Careful About
- The question is about the likelihood of achieving the objectives, not a guarantee. The answer is about the direction of the effect.
- The state of the economy matters: if the economy is at full capacity, the inflation effect is stronger; if in deep recession, growth may be stronger and inflation may not immediately rise. But the question does not specify, so the standard short-run textbook analysis applies.
- The quantity theory assumes V is stable; in reality, V can change, but for the purpose of the question, the standard model is sufficient.
The government increases interest rates in order to reduce the rate of inflation.
What will also result from this action?
Options
A a depreciation of the country's currency
B a fall in the level of savings
C a reduction in economic growth
D a reduction in unemployment
Reasoning
Higher interest rates increase the cost of borrowing and the return on saving. This reduces consumption and investment, two components of aggregate demand (AD). A fall in AD reduces the equilibrium level of real national output, which slows the rate of economic growth. Therefore, a reduction in economic growth is a likely result.
Answer
C
C
Background Concept
Monetary policy is the use of interest rates, money supply, or exchange rates by a central bank to influence aggregate demand and achieve macroeconomic objectives. The transmission mechanism describes how a change in the policy interest rate works its way through the economy. A rise in the central bank's base rate is passed on to commercial banks, which raise their lending and deposit rates. Higher borrowing costs reduce consumption (especially of durable goods bought on credit) and investment (as the cost of capital rises and the expected rate of return on projects must now exceed a higher hurdle). Higher deposit rates encourage saving rather than spending. Both channels reduce aggregate demand (C + I). With lower AD, the price level rises more slowly (helping to reduce inflation), but real output also grows more slowly or may even fall — i.e., economic growth is reduced.
Understanding the Question
The question presents a policy action — the government (or central bank) raises interest rates to fight inflation — and asks which of four listed outcomes will also result from this action. The key word is "also": the policy is intended to reduce inflation, but the question wants the side effect that is most likely to occur. Each option must be evaluated against the known effects of higher interest rates.
Approach
Trace the transmission mechanism step by step: higher interest rate -> higher cost of borrowing and higher return on saving -> lower consumption and investment -> lower aggregate demand -> lower real output growth. Then check each option against this chain. Option C (a reduction in economic growth) follows directly. Options A, B, and D are either opposite to the predicted effect or unlikely.
Step-by-Step Reasoning
-
Higher interest rates make borrowing more expensive for households and firms. Mortgages, car loans, and business loans all become costlier. This reduces the quantity of credit demanded.
-
Consumption falls because households with variable-rate mortgages have less disposable income after higher interest payments, and because households postpone purchases of durable goods (cars, furniture, appliances) that are typically financed.
-
Investment falls because firms face a higher cost of capital. A project that was profitable at a 5% interest rate may become unprofitable at 7%. Firms also become more cautious about future demand, so they delay expansion plans.
-
Aggregate demand (AD = C + I + G + X - M) decreases. Government spending (G) and net exports (X - M) are not directly affected by the interest rate change in the first round, though there may be secondary effects via the exchange rate.
-
Lower AD reduces the equilibrium level of real national output (Y). In the short run, with a positively sloped short-run aggregate supply curve, a leftward shift of AD reduces both the price level and real output. The fall in real output means the economy grows more slowly — i.e., economic growth is reduced.
Now evaluate each option:
-
Option A: a depreciation of the country's currency. Higher interest rates typically appreciate the currency, not depreciate it. Foreign investors seeking higher returns buy the currency, increasing demand and raising its value. So A is wrong.
-
Option B: a fall in the level of savings. Higher interest rates increase the return on saving, which should raise the level of savings (the substitution effect dominates for most savers). So B is wrong.
-
Option C: a reduction in economic growth. As reasoned above, lower AD reduces real output growth. This is the correct answer.
-
Option D: a reduction in unemployment. Lower output growth usually increases unemployment (or reduces employment growth), because firms need fewer workers to produce less output. So D is wrong.
Key Takeaways
- The interest rate transmission mechanism is a core concept in macroeconomics: higher rates -> lower AD -> lower output and inflation.
- Contractionary monetary policy (raising rates) reduces inflation but at the cost of lower economic growth and higher unemployment in the short run.
- Higher interest rates tend to appreciate the currency and increase savings, not the opposite.
Common Mistakes
- Confusing the effect on the exchange rate: many students think higher rates weaken the currency, but the opposite is true.
- Thinking that higher interest rates always reduce savings because people have less money to save — the income effect can work this way, but the substitution effect (higher return encourages more saving) usually dominates, and the net effect is ambiguous. The question's options make B clearly wrong because a "fall" is not the expected direction.
- Assuming that lower inflation automatically means higher growth — in the short run, the policy that reduces inflation (higher rates) also reduces growth.
Things to Be Careful About
- Distinguish between the intended effect (lower inflation) and the side effects (lower growth, higher unemployment, currency appreciation).
- Remember that the transmission mechanism works through AD, not AS. A supply-side policy would have different effects.
- In the long run, lower inflation may actually promote growth, but the question asks for the immediate result of the action, not the long-run equilibrium.
The diagram shows the relationship between the income tax rate and tax revenue.
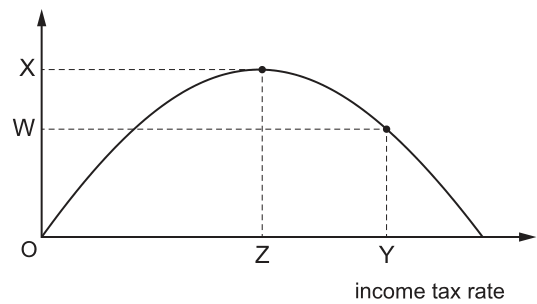
Which statement is correct?
Options
A A tax rate cut from Y to Z will cause tax revenue to decrease.
B At tax rates below Z a tax rate cut will cause tax revenue to increase.
C The greater the rate of tax beyond Z, the smaller will be the tax revenue generated.
D Tax revenue will always increase as the rate of income tax increases.
Reasoning
The diagram is a Laffer curve, showing an inverted U-shaped relationship between the income tax rate (horizontal axis) and tax revenue (vertical axis). The peak of the curve at tax rate Z corresponds to the maximum possible tax revenue (X). For tax rates below Z, the curve is upward-sloping: higher tax rates increase tax revenue. For tax rates above Z, the curve is downward-sloping: higher tax rates reduce tax revenue, as high rates discourage work, investment and encourage tax avoidance, shrinking the tax base.
- Option A: A tax cut from Y to Z moves left along the downward-sloping section of the curve. Revenue at Y is W, and at Z is X (higher than W), so revenue increases. A is incorrect.
- Option B: For tax rates below Z, a tax cut moves left along the upward-sloping section, so revenue falls. B is incorrect.
- Option C: Beyond Z (the revenue-maximising rate), the curve is downward-sloping, so a higher tax rate leads to lower tax revenue. This matches the diagram. C is correct.
- Option D: The curve falls after Z, so tax revenue does not always increase with the tax rate. D is incorrect.
Answer
C
C
Background Concept
The Laffer curve is a theoretical model that illustrates the relationship between the statutory income tax rate set by a government and the total tax revenue the government actually collects. It is based on the idea that tax rates affect not just the amount of tax paid per transaction, but also the behaviour of taxpayers: very high tax rates can discourage people from working, investing or reporting income, and encourage tax avoidance or evasion, which shrinks the overall tax base (the total amount of income subject to tax).
The curve is inverted U-shaped. At very low tax rates (near 0%), tax revenue is low because the rate itself is minimal, even if the tax base is large. As the tax rate rises from 0% up to a certain revenue-maximising rate (labelled Z in the diagram), tax revenue increases: the higher rate more than offsets any small reduction in the tax base from reduced work incentives. At the revenue-maximising rate Z, tax revenue reaches its peak (X in the diagram). If the tax rate is raised above Z, the negative behavioural effects dominate: the tax base shrinks enough that total revenue falls even though the statutory rate is higher. For example, if the tax rate is set at Y (higher than Z), the resulting revenue is W, which is lower than the maximum X.
Understanding the Question
This 1-mark multiple-choice question provides a standard Laffer curve diagram and asks you to identify which of four statements about the tax rate-tax revenue relationship is correct. The diagram labels the revenue-maximising tax rate as Z, with maximum revenue X, and a higher tax rate Y that generates lower revenue W. You need to test each option against the shape of the curve and the positions of the labelled points.
Approach
The most efficient way to answer this is to first recall the key features of the Laffer curve, then test each option one by one against the diagram:
- Confirm the axes: horizontal = income tax rate, vertical = tax revenue.
- Note the peak at Z: this is the rate that generates maximum revenue X.
- For any option involving a change in the tax rate, locate the starting and ending points on the horizontal axis, then compare the corresponding revenue values on the vertical axis.
- Eliminate any option that contradicts the shape of the curve or the labelled points.
Step-by-Step Reasoning
Let us evaluate each option in turn:
-
Option A: "A tax rate cut from Y to Z will cause tax revenue to decrease."
- Y is a tax rate higher than Z (it is to the right of Z on the horizontal axis). A cut from Y to Z is a reduction in the tax rate.
- On the diagram, the revenue at Y is W, and the revenue at Z is X. X is greater than W, so revenue increases, not decreases.
- Option A is incorrect.
-
Option B: "At tax rates below Z a tax rate cut will cause tax revenue to increase."
- Tax rates below Z lie on the upward-sloping left-hand section of the Laffer curve. A tax cut here means moving left along this section, towards a lower tax rate and lower revenue (revenue falls to 0 if the tax rate is cut to 0%).
- Option B claims revenue increases, which is the opposite of what the curve shows. Option B is incorrect.
-
Option C: "The greater the rate of tax beyond Z, the smaller will be the tax revenue generated."
- "Beyond Z" refers to tax rates higher than Z, which lie on the downward-sloping right-hand section of the curve. As the tax rate increases (moves right along the horizontal axis past Z), the curve slopes downward, so tax revenue falls.
- This exactly matches the shape of the curve in the diagram. Option C is correct.
-
Option D: "Tax revenue will always increase as the rate of income tax increases."
- The curve clearly falls after Z, so for tax rates above Z, higher rates lead to lower revenue. Revenue does not always increase with the tax rate.
- Option D is incorrect.
Key Takeaways
The Laffer curve demonstrates that the relationship between tax rates and tax revenue is not linear: there is a revenue-maximising tax rate, and raising taxes above this rate will reduce total revenue. This is a core insight for evaluating the likely effects of changes to income tax rates, and explains why very high tax rates are often avoided by governments even if they wish to raise revenue.
Common Mistakes
- Confusing the direction of the curve: Many students assume higher taxes always raise revenue, ignoring the behavioural effects that shrink the tax base at very high rates. This leads them to incorrectly choose options A or D.
- Misreading the axes: Mixing up the tax rate (x-axis) and tax revenue (y-axis) can lead to misinterpreting the direction of changes when tax rates rise or fall.
- Misidentifying the position of Z: Forgetting that Z is the revenue-maximising point, so any move away from Z (higher or lower rate) reduces revenue, leads to errors with options A and B.
Things to Be Careful About
- Always check which axis represents which variable before interpreting changes: the horizontal axis is the tax rate, the vertical axis is tax revenue.
- When evaluating a change in tax rate, first locate the starting and ending points on the horizontal axis, then compare the corresponding revenue values on the vertical axis to see if revenue rises or falls.
- The Laffer curve is a theoretical model: the exact position of the revenue-maximising rate Z varies between countries depending on factors like taxpayer behaviour, the size of the informal economy, and the availability of tax avoidance schemes. But for the purposes of this diagram-based question, you only need to interpret the curve as drawn.
In which situation is devaluation of the currency most likely to cause inflation?
Options
A Excess capacity is available.
B Import tariffs are reduced.
C Local substitutes of imported raw materials are unavailable.
D The demand for exports is price inelastic.
Reasoning
Devaluation makes imports more expensive. If local substitutes of imported raw materials are unavailable, firms must continue to import the same inputs at higher prices, leading to higher production costs. These higher costs are passed on to consumers as higher prices, causing inflation. In contrast, if excess capacity is available (A), firms could increase output without raising prices, reducing inflationary pressure. Reducing import tariffs (B) would lower import costs, offsetting the price increase from devaluation. If demand for exports is price inelastic (D), the expenditure-switching effect may be smaller, but it does not directly cause inflation; it affects the trade balance. Therefore, the most likely situation to cause inflation is when local substitutes are unavailable.
Answer
C
C
Background Concept
Devaluation (or depreciation) of a currency reduces the price of domestic goods relative to foreign goods. This makes exports cheaper and imports more expensive. The immediate effect on the domestic price level comes from the cost of imported goods. If a country imports raw materials, intermediate goods, or finished products, the higher cost of these imports can lead to cost-push inflation. The extent depends on the degree of pass-through and the ability of firms to substitute domestic inputs for imported ones. In this question, we are asked to identify the situation where devaluation is most likely to cause inflation.
Understanding the Question
The question presents four different scenarios. We need to select the one that makes devaluation most inflationary. The correct answer is C: 'Local substitutes of imported raw materials are unavailable.' This means that firms cannot switch to cheaper domestic inputs, so they are forced to pay higher prices for imported raw materials, which raises their production costs and leads to higher prices for consumers. The other options either reduce inflationary pressure or are irrelevant to the inflation mechanism.
Approach
- Understand the basic mechanism: devaluation increases import prices, which can cause cost-push inflation.
- Evaluate each option:
- A: Excess capacity available – firms can increase output without raising prices, so inflation is less likely.
- B: Import tariffs reduced – this would lower the cost of imports, offsetting the devaluation effect, reducing inflation.
- C: Local substitutes unavailable – firms have no alternative but to pay higher import prices, so cost-push inflation is likely.
- D: Demand for exports is price inelastic – this affects the trade balance, not directly the domestic price level. It does not make inflation more likely.
- Select C as the correct answer.
Step-by-Step Reasoning
- Devaluation and import prices: When a currency is devalued, the domestic price of imported goods rises. For example, if a country imports raw materials like oil, steel, or chemicals, the cost of these inputs increases in domestic currency.
- Impact on production costs: Firms that rely on imported raw materials face higher costs. If they cannot find cheaper domestic substitutes, they must absorb the cost increase or pass it on to consumers.
- Pass-through to prices: In competitive markets, firms will raise prices to maintain profit margins. This leads to a general rise in the price level – inflation.
- Option A: Excess capacity means firms can increase production without increasing costs. They may be able to absorb the higher input costs without raising prices, or they might even lower prices to utilise capacity. Therefore, inflation is less likely.
- Option B: Reducing import tariffs lowers the cost of imports. If tariffs are reduced simultaneously with devaluation, the net effect on import prices may be zero or even negative. Thus, inflation is less likely.
- Option D: Price inelastic demand for exports means that when the export price falls (due to devaluation), the quantity demanded increases by a smaller percentage. This does not directly affect the domestic price level. It affects the trade balance and possibly aggregate demand, but that would be demand-pull inflation, which is not the focus here. The question asks about devaluation causing inflation through the cost channel, not through demand.
- Conclusion: The only scenario that unambiguously makes devaluation inflationary is when local substitutes are unavailable, forcing firms to pay higher import prices and pass them on.
Key Takeaways
- Devaluation can cause inflation via higher import costs (cost-push inflation).
- The availability of domestic substitutes for imported inputs is a key factor determining the inflationary impact.
- Other factors like excess capacity, trade policy, and demand elasticity can mitigate or offset the inflationary effect.
- In multiple-choice questions, always trace the logical chain: devaluation → higher import prices → higher production costs → higher prices.
Common Mistakes
- Choosing D because of the Marshall-Lerner condition: Students might think that if demand for exports is inelastic, the trade balance worsens, leading to more devaluation or inflation. But the question is about the direct inflationary effect of a single devaluation, not a spiral. Option D does not make devaluation itself more inflationary.
- Choosing A thinking that excess capacity means there is room for expansion, but that actually reduces inflationary pressure, not increases it.
- Choosing B as a possible cause of inflation? Actually, reducing tariffs lowers costs, so it's deflationary.
Things to Be Careful About
- Distinguish between cost-push and demand-pull inflation. Devaluation can cause both: cost-push from higher import prices, and demand-pull if net exports increase and the economy is near full capacity. The question is focused on the cost-push channel.
- The phrase 'most likely' implies that only one option clearly increases the likelihood of inflation; the others reduce it or are irrelevant.
- Ensure you understand the mechanism: devaluation increases the price of imported goods, so any factor that forces firms to continue buying those imports (unavailability of substitutes) makes inflation more certain.
A country imports most of the raw materials used as factor inputs.
Which policy is most likely to control cost-push inflation?
Options
A an appreciation of the exchange rate
B an increase in the rate of income tax
C an increase in the rate of interest
D an increase in the rate of sales tax
Reasoning
Cost-push inflation is caused by rising costs of production. Since the country imports most raw materials, an appreciation of the exchange rate lowers the domestic price of these imports, reducing production costs and helping to control cost-push inflation. Other policies (income tax, interest rate, sales tax) primarily affect aggregate demand and are not directly aimed at reducing production costs.
Answer
A
A
Background Concept
Cost-push inflation occurs when the overall price level rises due to increases in the costs of production, such as wages, raw materials, or energy. Unlike demand-pull inflation, which is caused by excessive aggregate demand, cost-push inflation is driven by shifts in aggregate supply. Policies that aim to control cost-push inflation must either reduce production costs or improve productivity. For a country that imports most of its raw materials, the exchange rate is a key determinant of input costs: an appreciation of the domestic currency makes imports cheaper, while a depreciation makes them more expensive.
Understanding the Question
The question asks: "Which policy is most likely to control cost-push inflation?" given that the country imports most raw materials. The options are four policies: exchange rate appreciation, income tax increase, interest rate increase, and sales tax increase. The correct policy must directly address the cost side of the economy rather than aggregate demand. The exchange rate appreciation is the only option that directly reduces the cost of imported inputs.
Approach
We evaluate each policy in turn:
- Appreciation: reduces import costs, lowering production costs, shifting aggregate supply rightwards, reducing inflation.
- Income tax increase: reduces disposable income, dampening aggregate demand; this is more effective against demand-pull inflation, not cost-push.
- Interest rate increase: tightens monetary policy, reducing borrowing and spending, again targeting demand.
- Sales tax increase: raises the price of goods, which could worsen inflation by increasing the cost of living, and does not reduce production costs.
The key is to recognise that cost-push inflation requires a supply-side solution, and appreciation is a supply-side policy (through cheaper imports).
Step-by-Step Reasoning
- Identify the nature of inflation: Cost-push inflation is caused by rising costs of production. The country imports most raw materials, so the cost of these inputs influences domestic production costs.
- Evaluate Option A: Appreciation of the exchange rate – An appreciation means the domestic currency becomes stronger relative to foreign currencies. This reduces the domestic currency price of imports. For example, if the exchange rate appreciates from 1.5 USD/GBP to 1.2 USD/GBP, a $100 raw material costs less in pounds. This directly lowers production costs, reducing the upward pressure on prices. This is a supply-side policy that shifts the aggregate supply curve to the right, helping to control cost-push inflation.
- Evaluate Option B: Increase in income tax – Higher income tax reduces disposable income, leading to lower consumption and aggregate demand. This is a demand-side policy. While it might reduce demand-pull inflation, it does not address rising costs. In fact, it could reduce output and employment without tackling the source of cost-push inflation.
- Evaluate Option C: Increase in the rate of interest – Higher interest rates increase the cost of borrowing, reducing investment and consumption. Again, this is a demand-side policy. It may slow down the economy but does not affect production costs directly. It could even increase costs for firms that borrow to finance inventories.
- Evaluate Option D: Increase in the rate of sales tax – A sales tax (e.g., VAT) increases the price of goods and services. This would raise the cost of living and could lead to higher wage demands, potentially exacerbating inflation. It does not reduce production costs; instead, it adds to the cost burden.
- Conclusion: Only Option A directly reduces the cost of imported raw materials, making it the most effective policy to control cost-push inflation in this context.
Key Takeaways
- Cost-push inflation requires policies that reduce production costs or improve aggregate supply.
- Exchange rate appreciation can lower import costs, acting as a supply-side policy.
- Demand-side policies (tax, interest rate) are not effective against cost-push inflation; they target demand-pull inflation.
- Sales tax increases are counterproductive for controlling inflation.
Common Mistakes
- Confusing cost-push with demand-pull inflation and selecting a demand-side policy (e.g., interest rate increase).
- Thinking that sales tax reduction would help, but the question offers an increase; even a reduction might not address cost-push if it doesn't reduce production costs.
- Overlooking the specific context: the country imports most raw materials, making the exchange rate channel particularly important.
- Assuming that an appreciation is always harmful; but in this context, it is beneficial for controlling inflation.
Things to Be Careful About
- Pay attention to the type of inflation: cost-push vs demand-pull.
- Consider the direct effect of each policy on production costs.
- Remember that exchange rate changes affect both import and export prices; here the focus is on imports.
- Distinguish between policies that affect aggregate demand and those that affect aggregate supply.
- The question asks for the policy "most likely" to control cost-push inflation; appreciation is the most direct, but other policies might have indirect effects; however, they are less effective.
Germany, one of the world's strongest trading nations, achieved a surplus on current account of the balance of payments in 2021–2022.
Which income flow would not have been included in the calculation of Germany's current account?
Options
A Declining sales of German cars for export overseas.
B Falling earnings of foreign exchange from visitors to Germany.
C Increasing transfers of aid to less developed countries.
D Investment in a natural gas pipeline link to its main foreign supplier.
Answer
The current account records trade in goods, trade in services, primary income (investment income and compensation of employees), and secondary income (current transfers).
- A – Declining sales of German cars for export: trade in goods (current account).
- B – Falling earnings from visitors to Germany: trade in services (travel services, current account).
- C – Increasing transfers of aid: secondary income / current transfers (current account).
- D – Investment in a natural gas pipeline link to a foreign supplier: this is a capital/financial account transaction (direct investment abroad), not a current account flow.
Therefore, the income flow that would not be included in the calculation of Germany's current account is D.
D
Background Concept
The balance of payments is a record of all economic transactions between residents of one country and the rest of the world over a period. It is divided into two main accounts:
- Current Account: records flows of goods, services, primary income (investment earnings, compensation of employees), and secondary income (current transfers like aid, remittances).
- Capital and Financial Account: records flows of capital transfers (e.g., debt forgiveness) and transactions in financial assets and liabilities — direct investment, portfolio investment, other investment, and reserve assets.
The key distinction is that the current account captures income flows (earnings from trade, investment income, and transfers), while the financial account captures changes in ownership of assets (buying/selling shares, building factories, lending/borrowing).
Understanding the Question
The question asks which of four listed income flows would not be included in the calculation of Germany's current account. The stem tells us Germany had a current account surplus in 2021–2022. Each option describes a type of international transaction. We must classify each one as either a current account item or a financial/capital account item.
Approach
For each option, identify the nature of the transaction:
- Is it a trade in goods or services? → Current account.
- Is it a transfer payment (aid, remittances)? → Current account (secondary income).
- Is it an investment in a foreign asset (building a pipeline, buying shares, lending)? → Financial account.
Then select the one that falls outside the current account.
Step-by-Step Reasoning
Option A: Declining sales of German cars for export overseas.
- Cars are physical goods. Export of goods is recorded in the current account under "trade in goods" (also called visible trade). This is definitely included in the current account.
Option B: Falling earnings of foreign exchange from visitors to Germany.
- Visitors to Germany consume services (accommodation, transport, food, entertainment). These are exports of services (invisible trade). Recorded in the current account under "trade in services". Included.
Option C: Increasing transfers of aid to less developed countries.
- Aid transfers are current transfers (secondary income). They are unilateral transfers with no quid pro quo. Recorded in the current account. Included.
Option D: Investment in a natural gas pipeline link to its main foreign supplier.
- Building a pipeline in a foreign country is a direct investment abroad. The German entity is acquiring a foreign asset (the pipeline). This is a financial account transaction (direct investment outflow). It is not a current account flow. Even though it may generate future income (which would then appear in the current account as primary income), the initial investment itself is a financial account item.
Therefore, D is the correct answer.
Key Takeaways
- The current account covers trade in goods and services, primary income (investment earnings, compensation), and secondary income (transfers).
- The financial account covers transactions in financial assets and liabilities, including direct investment, portfolio investment, and other investment.
- A common exam trick is to present a financial investment as if it were an income flow. Always check whether the transaction involves a change in ownership of an asset (financial account) or a flow of income/transfer (current account).
Common Mistakes
- Confusing the initial investment (financial account) with the income it later generates (current account). The question asks about the flow included in the current account calculation — the investment itself is not included.
- Thinking that any flow of money abroad is a current account item. Aid and trade are; buying assets is not.
- Misclassifying aid as a financial account item because it is a "transfer". Aid is a current transfer (secondary income), not a capital transfer.
Things to Be Careful About
- The balance of payments classification is standardised internationally. Memorise the three main sub-accounts of the current account: goods, services, primary income, secondary income.
- The financial account includes direct investment (e.g., building a factory, buying a company), portfolio investment (e.g., buying shares or bonds), and other investment (e.g., loans, deposits).
- A current account surplus means exports of goods/services + net income + net transfers > imports + net income outflows + net transfers out. A financial account deficit (net capital outflow) typically finances a current account surplus.
A country maintains its foreign exchange rate against the United States dollar, within a narrow but changing band.
What is this type of exchange rate?
Options
A fixed
B floating
C managed float
D trade-weighted
Answer
A managed float (or dirty float) is an exchange rate system where the currency's value is primarily determined by market forces, but the central bank intervenes to keep it within a target band or to prevent excessive volatility. The description — maintained against the US dollar within a narrow but changing band — matches this system exactly.
Answer
C
C
Background Concept
Exchange rate systems describe how a country's currency is valued relative to other currencies. The three main types are:
- Fixed exchange rate: The central bank pegs the currency at a specific value against another currency (or a basket) and intervenes to maintain that exact rate. The band is essentially zero or extremely narrow, and the rate does not change frequently.
- Floating exchange rate: The currency's value is determined entirely by market forces of supply and demand, with no government intervention. The rate moves freely and continuously.
- Managed float (dirty float): The currency is primarily market-determined, but the central bank occasionally intervenes to influence the rate, often to keep it within a desired range or to smooth out short-term volatility. The band may be adjusted over time.
- Trade-weighted exchange rate: This is not a system but a measure — an index of the currency's value against a basket of trading partners' currencies, weighted by trade shares.
Understanding the Question
The question describes a country that "maintains its foreign exchange rate against the United States dollar, within a narrow but changing band." The key phrase is "narrow but changing band" — the rate is not completely free (so not floating), but the band can be adjusted (so not a permanently fixed rate). This is the hallmark of a managed float: the central bank sets a target range and intervenes to keep the rate inside it, but the range itself can be revised.
Approach
Identify the defining feature of each option and match it to the description. The description has two parts: (1) the rate is maintained within a band (implies intervention), and (2) the band is changing (implies the peg is not permanent). Only one system fits both.
Step-by-Step Reasoning
-
Option A — fixed: A fixed exchange rate is pegged at a single value (or a very narrow band, e.g. +/-1%). The band is not "changing" — the rate is meant to stay fixed. The description says the band is "changing", so this does not match.
-
Option B — floating: A pure floating rate has no band at all; the rate moves freely with market forces. The description says the rate is "maintained" within a band, implying active intervention. This does not match.
-
Option C — managed float: In a managed float (also called a dirty float), the central bank intervenes to keep the exchange rate within a target range. The range can be adjusted over time as economic conditions change. This matches exactly: the rate is maintained within a band, and the band can change.
-
Option D — trade-weighted: A trade-weighted exchange rate is an index, not a system. It measures the currency's value against a basket of currencies. It does not describe how the rate is determined or maintained. This does not match.
Therefore, the correct answer is C.
Key Takeaways
- The three main exchange rate systems are fixed, floating, and managed float. Each has a distinct degree of government intervention.
- A managed float combines market determination with occasional central bank intervention, often within a target band that can be adjusted.
- The phrase "narrow but changing band" is a textbook description of a managed float.
Common Mistakes
- Confusing a managed float with a fixed rate: both involve intervention, but a fixed rate is pegged at a specific value (or a very narrow, unchanging band), while a managed float allows the band to shift.
- Thinking that any intervention means a fixed rate: many systems involve some intervention; the key is whether the rate is pegged or merely guided.
- Selecting "trade-weighted" because it sounds technical: this is a measure, not a system.
Things to Be Careful About
- Read the exact wording: "maintains ... within a narrow but changing band" — the word "changing" is the critical clue that rules out a pure fixed rate.
- Remember that a managed float is also called a dirty float; both terms refer to the same system.
The Lorenz curves in the diagram show different distributions of income and of wealth.
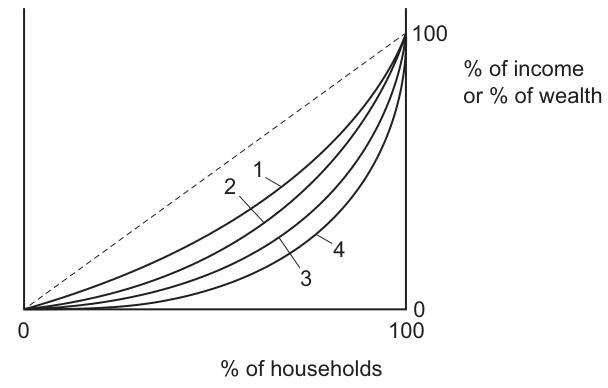
At first, income in a country is more equally distributed than wealth.
In a period, the distribution of income becomes more unequal but the distribution of wealth becomes more equal.
Which movement would show the effects of these changes on the distribution of income and wealth within the country?
Options
| distribution of income | distribution of wealth | |
|---|---|---|
| A | shift from curve 1 to curve 2 | shift from curve 4 to curve 3 |
| B | shift from curve 2 to curve 1 | shift from curve 3 to curve 4 |
| C | shift from curve 3 to curve 4 | shift from curve 2 to curve 1 |
| D | shift from curve 4 to curve 3 | shift from curve 1 to curve 2 |
Working
A Lorenz curve closer to the 45-degree line of equality indicates a more equal distribution of income or wealth; a curve further from the line indicates greater inequality.
- Initially, income is more equally distributed than wealth, so the initial income Lorenz curve must be closer to the line of equality than the initial wealth Lorenz curve. From the diagram, curve 1 is the closest to the line, followed by 2, 3, and 4 (furthest). Valid initial pairs are (income: 1/2, wealth: 3/4).
- The distribution of income becomes more unequal: this means the income Lorenz curve shifts further away from the line of equality (e.g., from 1 to 2, or 2 to 3).
- The distribution of wealth becomes more equal: this means the wealth Lorenz curve shifts closer to the line of equality (e.g., from 4 to 3, or 3 to 2).
- Option A matches: income shifts from 1 to 2 (more unequal), wealth shifts from 4 to 3 (more equal). The initial state (income = 1, wealth = 4) also satisfies the condition that income is initially more equal than wealth.
Answer
A
A
Background Concept
The Lorenz curve is a graphical tool used to represent the distribution of income or wealth within an economy. The horizontal axis plots the cumulative percentage of households (or population) ranked from poorest to richest, and the vertical axis plots the cumulative percentage of total income or wealth held by those households. The 45-degree line of equality represents perfect equality: for example, the bottom 20% of households hold 20% of total income or wealth, the bottom 50% hold 50%, and so on. A Lorenz curve that lies below the line of equality indicates inequality: the further the curve is from the line of equality, the more unequal the distribution. The Gini coefficient, a common measure of inequality, is calculated as the area between the line of equality and the Lorenz curve divided by the total area under the line of equality, so a larger gap means a higher Gini coefficient and greater inequality.
Understanding the Question
The question presents a Lorenz curve diagram with four curves (1 to 4) ranked by their distance from the line of equality: 1 is closest (most equal), 2 next, then 3, and 4 is furthest (most unequal). It states two changes that occur in a period: first, income becomes more unequally distributed; second, wealth becomes more equally distributed. We are asked to identify which option shows the correct shifts for income and wealth Lorenz curves that match these two changes, given that initially income was more equally distributed than wealth. The task tests understanding of how Lorenz curve position relates to inequality, and how shifts in the curve correspond to changes in distribution equality.
Approach
To solve this, we first link the position of a Lorenz curve to the level of inequality: closer to the line = more equal, further = more unequal. We then use the initial condition (income more equal than wealth) to narrow down valid initial positions for the income and wealth curves. Next, we apply the two changes: more unequal income means the income curve moves further from the line; more equal wealth means the wealth curve moves closer to the line. We then check which option matches both the initial condition and the two shifts.
Step-by-Step Reasoning
- First, interpret the Lorenz curve ranking: Curve 1 is the most equal distribution (smallest gap from the line of equality), followed by 2, then 3, and Curve 4 is the most unequal (largest gap).
- Apply the initial condition: income in a country is more equally distributed than wealth. This means the initial Lorenz curve for income must be closer to the line of equality than the initial Lorenz curve for wealth. So the initial income curve must be either 1 or 2, and the initial wealth curve must be either 3 or 4 (since 1 and 2 are both closer than 3 and 4 to the line of equality).
- Apply the first change: the distribution of income becomes more unequal. Greater inequality means the income Lorenz curve shifts further away from the line of equality. So if initial income is 1, it shifts to 2 (or higher); if initial is 2, it shifts to 3 or 4.
- Apply the second change: the distribution of wealth becomes more equal. Greater equality means the wealth Lorenz curve shifts closer to the line of equality. So if initial wealth is 4, it shifts to 3 (or lower); if initial is 3, it shifts to 2 or 1.
- Now evaluate each option against these rules:
- Option A: Income shifts 1 to 2 (further from line, more unequal: correct). Wealth shifts 4 to 3 (closer to line, more equal: correct). Initial state: income = 1, wealth = 4. 1 is closer than 4, so income is initially more equal than wealth: matches the initial condition. This is valid.
- Option B: Income shifts 2 to 1 (closer to line, more equal: contradicts the change to more unequal). Incorrect.
- Option C: Income shifts 3 to 4 (further from line, more unequal, but initial income would be 3, which is further from the line than 2, so initial income would be less equal than a curve at 2. If initial wealth is 2, then 3 is further than 2, so income is less equal than wealth initially, which contradicts the initial condition). Incorrect.
- Option D: Wealth shifts 1 to 2 (further from line, more unequal: contradicts the change to more equal). Incorrect.
- The only valid option is A.
Key Takeaways
- The position of a Lorenz curve relative to the 45-degree line of equality directly indicates the level of distribution equality: closer to the line = more equal, further from the line = more unequal.
- A shift of a Lorenz curve away from the line of equality means distribution has become more unequal; a shift towards the line means it has become more equal.
- When solving Lorenz curve shift questions, always first check the initial condition to eliminate impossible starting positions for the curves.
Common Mistakes
- Confusing the direction of the shift: students often think a curve moving towards the line means more inequality, when it is the opposite. Remember: the line of equality is the benchmark for perfect equality, so moving towards it is moving towards more equality.
- Ignoring the initial condition: some students might just look at the shifts without checking if the initial positions match the given starting point (income more equal than wealth), which would lead them to pick an invalid option like C.
- Mixing up income and wealth: the question asks for the shift of income first, then wealth, so it is easy to swap the two when reading the options. Always check which column corresponds to which distribution.
Things to Be Careful About
- Always rank the Lorenz curves by their distance from the line of equality first: in this diagram, 1 < 2 < 3 < 4 in terms of distance from the line, so 1 is most equal, 4 most unequal.
- When checking the initial condition, confirm that the initial income curve is strictly closer to the line than the initial wealth curve, not equal (none of the curves are on the line, so all are unequal, but the ranking holds).
- For each option, verify both the direction of the shifts and the validity of the initial positions before selecting an answer.
What is likely to happen in a developing country as it becomes more developed?
Options
A A lower percentage of people will go to university.
B Average life expectancy will rise.
C The rate of population growth will increase.
D The tertiary sector will decline in importance.
Reasoning
As a country develops, improvements in healthcare, sanitation, and nutrition reduce infant and child mortality, and average life expectancy rises. This is a well-established demographic trend. The other options are incorrect: university attendance typically rises with development (A), population growth rates tend to fall after an initial decline in death rates (C), and the tertiary sector expands, not declines, as development proceeds (D).
Answer
B
B
Background Concept
This question tests understanding of the demographic transition model and the structural change that accompanies economic development. The demographic transition describes how a country's population changes as it moves from a pre-industrial to an industrialised economy. It typically has four stages:
- High stationary: high birth and death rates, stable population.
- Early expanding: death rate falls (better healthcare, sanitation, food supply), birth rate remains high, population grows rapidly.
- Late expanding: birth rate begins to fall (urbanisation, female education, family planning), population growth slows.
- Low stationary: low birth and death rates, stable or slowly growing population.
Alongside this, the sectoral composition of the economy shifts: agriculture (primary) declines, manufacturing (secondary) rises then falls, and services (tertiary) become dominant.
Understanding the Question
The question asks what is likely to happen in a developing country as it becomes more developed. It presents four options, only one of which is consistent with the typical pattern of development. The key is to recall the direction of change for each indicator: life expectancy, education participation, population growth, and sectoral employment.
Approach
For each option, think about the typical trend observed in countries that have undergone development:
- Option A: Education levels, especially tertiary enrolment, tend to increase with development, not decrease.
- Option B: Life expectancy consistently rises as healthcare improves and mortality falls.
- Option C: Population growth rates typically fall after an initial surge, as birth rates eventually decline.
- Option D: The tertiary (services) sector grows in importance, while primary and secondary sectors shrink.
Only option B matches the established pattern.
Step-by-Step Reasoning
-
Option A (lower percentage going to university): As countries develop, they invest more in education. Higher incomes allow more families to afford university, and the economy demands more skilled workers. Tertiary enrolment rates rise, not fall. This option is false.
-
Option B (average life expectancy rises): Development brings better healthcare (vaccinations, hospitals, clean water), improved sanitation, and more reliable food supplies. These reduce deaths from infectious diseases and malnutrition, especially among infants and children. Consequently, average life expectancy increases. This is a universal and well-documented trend. This option is true.
-
Option C (rate of population growth increases): The demographic transition shows that population growth initially accelerates when death rates fall but birth rates remain high (Stage 2). However, as development continues, birth rates eventually fall (Stage 3), slowing population growth. In the later stages of development, population growth is low or even negative. The question asks what happens as a country becomes more developed, implying the whole process, not just the early phase. The overall long-term trend is for population growth to slow, not increase. This option is false.
-
Option D (tertiary sector declines): The tertiary sector (services) includes retail, finance, education, healthcare, tourism, etc. As economies develop, they move from agriculture to manufacturing to services. In highly developed economies, the tertiary sector accounts for the largest share of GDP and employment. It grows, not declines. This option is false.
Therefore, only option B is correct.
Key Takeaways
- Development is associated with a clear set of demographic and structural changes: rising life expectancy, falling fertility, rising education levels, and a shift towards services.
- The demographic transition model is a key framework for understanding population changes during development.
- Be careful with option C: population growth does increase early in development, but the question asks about the overall process of becoming more developed, which includes the later stage where growth slows.
Common Mistakes
- Confusing the early and late stages of the demographic transition: A student might think population growth always increases with development, forgetting that birth rates eventually fall. The question's phrasing "as it becomes more developed" covers the entire transition, not just the initial phase.
- Assuming the tertiary sector declines because manufacturing grows: In early industrialisation, manufacturing does grow, but in later development, services become dominant. The tertiary sector does not decline overall.
- Overlooking the universal trend in life expectancy: This is one of the most robust empirical regularities in development economics.
Things to Be Careful About
- Read the question carefully: "as it becomes more developed" implies a process over time, not a single snapshot.
- Distinguish between short-term and long-term trends. Population growth may rise initially but falls in the long run.
- Remember that development is multidimensional: it involves changes in health, education, economic structure, and demographics simultaneously.
- For multiple-choice questions, eliminate clearly wrong options first to narrow down the choice.
Your score so far
Answer a question to start scoring
Your marks add up here as you work through the paper.