Economics 9708/41 — May/June 2022
Cambridge A-Level · A Level Data Response and Essays · worked solutions for every part, with the mark scheme
Topics Market Structures · Performance of Firms in Different Market Structures · Short-Run and Long-Run Production · Economic Growth and Sustainability · Efficiency and Market Failure · Objectives and Pricing Policies of Firms · +6 more
Productivity in the G7 countries
The G7 is a group of countries that have some of the world’s major advanced economies. Productivity in the G7 countries varies, as shown in Fig. 1.1 below, with United Kingdom (UK) performance as the base index of 100.
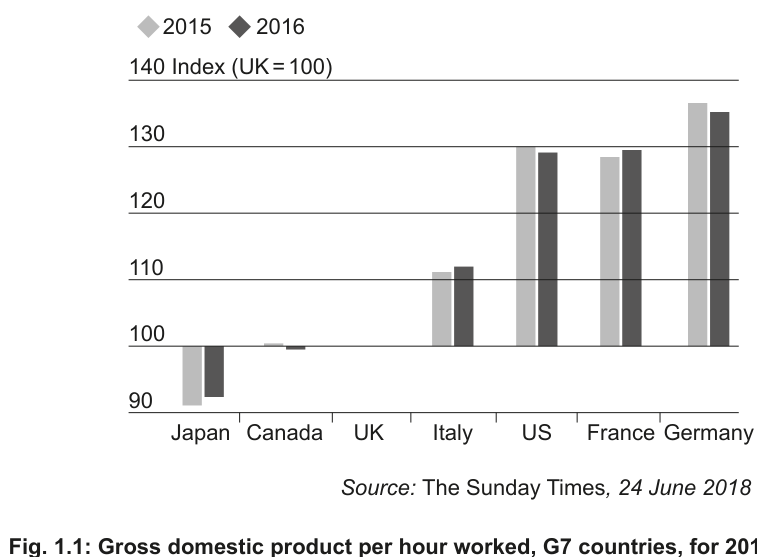
Fig. 1.1: Gross domestic product per hour worked, G7 countries, for 2015 and 2016
Source: The Sunday Times, 24 June 2018
Productivity in the UK was one of the worst in the G7. Poor management practices and lower levels of skills in the workforce were the main reasons for the UK’s position. In low wage, high employment sectors of the UK economy, the performance compared unfavourably with five of the G7 countries. In retailing, the UK was 40% lower than the performance in the United States (US). In hospitality industries the UK had a 45% lower rate than France.
Tackling poor productivity is about innovation, investment and improving infrastructure as well as labour skills.
The Federal Reserve Bank of the US suggested that innovation is one of the keys to productivity differences among the G7 countries. Innovation can occur using different factor inputs such as IT hardware and software, investment in staff training, research and development (R&D) and marketing. In 2015, the US had the most advanced software and IT services industries in the world accounting for a third of the global IT market. In 2018, the industry accounted for 12% of private sector employment and contributed 7.1% of GNP. Three of the top ten IT companies in the world were based in the US.
In 2014, in the UK, businesses spent US$26 billion on R&D, notably on digital technology and biomedical research projects that are world-renowned. However over the past 25 years R&D in the UK has only averaged between 1% and 1.3% of GNP and falls behind Japan with 3.4%, Germany 2.9%, the US 2.7% and France 2.2%.
There were concerns about the UK government reducing spending but in 2018 it made a commitment to a large investment programme in transport and communications to provide a boost to productivity. At that time one threat to the UK economy was its decision to leave the European Union’s single market. The decision created uncertainties for investors and the balance of foreign direct investment (FDI) showed that there were more investments abroad than there were foreign investments in the UK. This made some UK industries, such as car production, vulnerable. The central bank in the UK has stated that foreign owned car manufacturers in the UK invest heavily in R&D and their presence boosts the productivity of labour. It was thought this may change in the future.
Sources: The Sunday Times 24 June 2018, David Smith (Economic Outlook). ‘We don’t need a new target but we must raise our game’.
The Times 27 June 2018, David Smith. ‘Inward Investment so important to Britain is now at risk’.
Office for National Statistics, Britain, 2016
Explain what is meant by productivity.
Answer
Productivity is the rate of output per unit of input, such as labour, for a given period. It is commonly measured as the ratio of GDP to hours worked, indicating the efficiency with which inputs are used to produce outputs.
Productivity is the rate of output per unit of input (e.g. GDP per hour worked), measuring the efficiency of production.
Background Concept
Productivity is a fundamental measure of economic efficiency. It indicates how much output is produced per unit of input. The most common measure is labour productivity, calculated as total output (such as GDP) divided by the number of hours worked. Higher productivity means an economy can produce more goods and services with the same amount of labour, which is essential for raising living standards and economic growth. It is distinct from total output: an economy can have high output but low productivity if it has a large workforce working long hours with low efficiency.
Understanding the Question
The question asks for an explanation of what is meant by productivity. This is a 2-mark definition question (AO1). The extract uses the specific measure of GDP per hour worked, so the answer should reflect that productivity is a ratio of output to input, typically measured over a specific time period such as an hour.
Approach
Provide a concise definition that captures two elements: (1) the ratio of output to input, and (2) the concept of efficiency. Mention that inputs can be labour, capital, or a combination, and that the extract specifically uses GDP per hour worked.
Step-by-Step Reasoning
- Start with the core definition: productivity is the rate of output per unit of input.
- Specify that inputs may include labour, capital, or a combination of factors of production.
- Note that it is measured for a given period, usually an hour.
- Mention the specific measure used in the extract: the ratio of GDP to hours worked.
- Conclude by noting that it measures the efficiency of production.
Key Takeaways
Productivity is always a ratio (output/input). It is a measure of efficiency, not just total output. Labour productivity is the most common macro-level measure.
Common Mistakes
- Confusing productivity with total production or GDP. A country can have high GDP but low productivity if the workforce is large.
- Being too vague, e.g., "how much is produced" without mentioning "per unit of input".
- Forgetting to mention the time period or the efficiency aspect.
Things to Be Careful About
- Ensure the definition explicitly mentions "per unit of input" or "per hour worked".
- In data-response questions, it is often useful to link the definition to the specific measure used in the extract (GDP per hour worked).
The information suggests that innovation and R&D are important in ensuring high productivity. Is this statement consistent with the evidence in Fig. 1.1?
Answer
The statement is not entirely consistent with the evidence in Fig. 1.1.
Innovation and R&D are identified as key strategies to improve productivity, alongside investment and infrastructure. However, while countries with high productivity indices—such as the US (approximately 128), Germany (approximately 135) and France (approximately 127)—also have relatively high R&D spending as a percentage of GNP (2.7%, 2.9% and 2.2% respectively), Japan is an exception. Japan has the highest R&D spending at 3.4% of GNP but recorded the lowest productivity index in the G7 at approximately 93 in 2016. This indicates that high R&D does not guarantee high productivity, as other factors such as management practices and workforce skills are also influential.
The statement is not entirely consistent with the evidence in Fig. 1.1.
Background Concept
Innovation and research and development (R&D) are widely regarded as key drivers of productivity growth. R&D can lead to new technologies, better production processes, and improved product quality, all of which can raise output per worker. However, the relationship between R&D spending and productivity is not automatic or immediate. Other factors—such as management quality, workforce skills, infrastructure, and the ability to adopt new technologies—also play crucial roles. Therefore, while high R&D is often associated with high productivity, it is not a guarantee.
Understanding the Question
The question asks whether the statement that "innovation and R&D are important in ensuring high productivity" is consistent with the evidence in Fig. 1.1. This is a 4-mark point-based question requiring application (AO2) and a judgement (AO3). The candidate must compare the R&D data in the text with the productivity data in the chart and decide if they align.
Approach
- Acknowledge the theoretical basis: innovation and R&D are indeed important for productivity.
- Examine the correlation: look at countries with high productivity in Fig. 1.1 (Germany, France, US) and check their R&D spending mentioned in the text.
- Look for exceptions: identify any country with high R&D but low productivity, or vice versa.
- Reach a conclusion on consistency.
Step-by-Step Reasoning
- The text states that innovation is one of three key strategies (along with investment and infrastructure) for tackling poor productivity.
- From Fig. 1.1, the highest productivity countries in 2016 are Germany (~135), the US (~127), and France (~127). The text states these countries have R&D spending of 2.9%, 2.7%, and 2.2% of GNP respectively. This supports the statement.
- However, Japan has the highest R&D spending at 3.4% of GNP but the lowest productivity index in the chart at approximately 93 in 2016. This is a clear exception.
- Because of this exception, the evidence in Fig. 1.1 is not entirely consistent with the statement. It suggests that while R&D is important, it is not sufficient on its own to ensure high productivity; other factors such as management practices and skills (mentioned in the extract) also matter.
Key Takeaways
When evaluating consistency between a claim and data, always look for both supporting evidence and counter-examples. A single strong counter-example (like Japan) is enough to make a statement "not entirely consistent".
Common Mistakes
- Stating that the evidence is fully consistent without mentioning Japan.
- Ignoring the chart and only using the text, or vice versa.
- Making a judgement without providing the evidence to support it.
Things to Be Careful About
- Use the specific figures from the chart (approximate values are acceptable) and the text (percentages).
- The mark scheme awards a mark for noting that Fig. 1 is "not entirely consistent", so the conclusion must be nuanced, not absolute.
Use the information to comment on productivity in the US and indicate which factors contributed to its performance.
Answer
The US had relatively high productivity in 2015 and 2016, with an index of approximately 128 in 2015 and 127 in 2016, placing it second highest in the G7.
Several factors contributed to this performance. First, the US spent 2.7% of GNP on R&D, which is relatively high and supports technological advancement. Second, the US dominates the global IT market, accounting for one-third of the global market; the industry contributed 7.1% to GNP and employed 12% of the private sector workforce in 2018. Third, three of the world's top ten IT companies are based in the US, demonstrating strong innovation capacity. These factors have helped raise US labour productivity well above the UK base.
The US had high productivity (index approximately 128/127) due to high R&D spending, dominance in the global IT market, and hosting major IT companies.
Background Concept
A country's productivity level is determined by a combination of factors including the quality of its labour force (skills and education), the quality of its management, the level of investment in physical capital (machinery, infrastructure) and intangible capital (R&D, software), and the technological environment. The US's high productivity reflects its strengths in innovation, technology, and human capital.
Understanding the Question
The question asks to use the information to comment on US productivity and indicate which factors contributed to its performance. This is a 6-mark point-based question (AO1/AO2). "Comment" requires stating the performance level using data, then explaining the factors from the text.
Approach
- Extract the US productivity figures from Fig. 1.1 for both years.
- Identify the factors mentioned in the text that explain US performance: R&D spending, IT industry dominance, and major companies.
- Link each factor to how it improves productivity.
Step-by-Step Reasoning
- From Fig. 1.1, the US has an index of approximately 128 in 2015 and 127 in 2016, well above the UK base of 100 and second only to Germany. This indicates relatively high productivity.
- The text identifies several contributing factors:
- R&D intensity: The US spends 2.7% of GNP on R&D, which helps drive technological advancement and efficiency.
- IT sector dominance: The US accounts for one-third of the global IT market. This sector contributed 7.1% to GNP and employed 12% of the private sector workforce in 2018. Advanced IT hardware and software directly improve labour productivity by making workers more efficient.
- Major corporations: Three of the top ten IT companies globally are US-based, indicating strong capacity for innovation and technological advancement.
- These factors collectively explain why US workers produce more output per hour than their G7 counterparts (except Germany).
Key Takeaways
When asked to "comment on" data, always lead with the specific figures from the chart, then use textual evidence to explain the reasons. Distinguish between the performance (the what) and the causes (the why).
Common Mistakes
- Describing the US performance without quoting the index figures from Fig. 1.1.
- Listing factors from the text without explaining how they contribute to productivity.
- Confusing the US with another country.
Things to Be Careful About
- Ensure the figures cited match the chart (approximately 128/127 for the US).
- Note that the text mentions 2018 data for the IT sector, but this is still relevant as an explanatory factor for the 2015/16 productivity performance.
Use the information to discuss whether or not it is likely that the UK’s productivity within the G7 countries will improve.
Answer
It seems unlikely that UK productivity will improve in the short term, though there are factors that could lead to improvement in the long term.
On the one hand, several factors suggest limited near-term improvement. Over the past 25 years, UK business R&D spending has averaged only 1% to 1.3% of GNP, well below the levels in Japan (3.4%), Germany (2.9%), the US (2.7%) and France (2.2%). Poor management practices and lower workforce skills levels also constrain productivity. Furthermore, the decision to leave the EU single market has created uncertainty for investors, and the balance of FDI has turned negative, with more UK investment abroad than foreign investment in the UK. This threatens sectors such as car production, where foreign-owned manufacturers invest heavily in R&D and boost labour productivity.
On the other hand, there are grounds for longer-term optimism. The UK has world-renowned R&D capabilities in digital technology and biomedical research. Additionally, the UK government made a commitment in 2018 to a large investment programme in transport and communications infrastructure, which should provide a boost to productivity.
Overall, while the UK has strengths in innovation, the low levels of past investment, relatively low R&D intensity, skills gaps and adverse FDI trends make significant short-term improvement unlikely. Improvement is more plausible in the long term if government infrastructure investment and existing R&D strengths can be fully exploited.
It seems unlikely in the short term due to low investment, R&D, skills and FDI issues, but long-term improvement is possible due to existing R&D strengths and planned infrastructure investment.
Background Concept
Productivity growth is influenced by both supply-side factors and the overall investment climate. In the short run, productivity can be constrained by low investment, skills shortages, and economic uncertainty. In the long run, it can be improved through investment in infrastructure, R&D, education, and management practices. The UK faces a mix of constraints and opportunities.
Understanding the Question
The question asks whether it is likely that UK productivity will improve. This is an 8-mark evaluative question (discuss). It requires two sides: arguments that it will not improve (or will improve only slowly) and arguments that it will improve, followed by a justified judgement. The answer must be based on the information provided.
Approach
- Side 1 (Unlikely to improve / slow improvement): Focus on the negative factors in the extract—low past investment, low R&D, poor management/skills, and FDI decline due to Brexit.
- Side 2 (Likely to improve): Focus on the positive factors—world-class R&D in specific sectors and planned government infrastructure investment.
- Judgement: Weigh the evidence. The negative factors suggest short-run stagnation, but the positive factors suggest long-run potential if policies are sustained.
Step-by-Step Reasoning
-
Arguments that improvement is unlikely (especially in the short run):
- The extract states that over the past 25 years, UK business R&D spending has averaged only 1% to 1.3% of GNP, significantly below competitors (Japan 3.4%, Germany 2.9%, US 2.7%, France 2.2%). Low R&D limits innovation.
- Poor management practices and lower workforce skills are cited as main reasons for the UK's poor position.
- The decision to leave the EU single market has created uncertainty. The balance of FDI is negative (more investment abroad than inward), which threatens industries such as car production that rely on foreign investment for R&D and productivity spillovers.
- Low levels of business investment over 20 years mean the capital stock per worker may be inadequate.
-
Arguments that improvement is possible:
- The UK has world-renowned R&D in digital technology and biomedical research, providing a strong base for future innovation-led productivity growth.
- The government committed in 2018 to a large investment programme in transport and communications infrastructure. Better infrastructure reduces transport and communication costs, improving the efficiency of the economy.
-
Evaluation and Judgement:
- The negative factors are structural and have persisted for 25 years, suggesting inertia. The Brexit uncertainty adds a new downward pressure on investment.
- However, the existing R&D strengths and planned infrastructure spending provide a foundation for catch-up.
- A justified judgement would be that significant improvement is unlikely in the short term due to the legacy of low investment, skills gaps, and FDI outflows, but the long-term outlook is more positive if government infrastructure spending and existing R&D capabilities are successfully leveraged.
Key Takeaways
For "discuss" questions, always present both sides before concluding. The conclusion must be justified by the evidence, not just a summary. In data-response questions, anchor every point to specific evidence from the extract.
Common Mistakes
- Providing a one-sided answer (e.g., only listing reasons why it won't improve). This would forfeit evaluation marks.
- Ending with a summary rather than a judgement (e.g., "In conclusion, there are reasons for and against").
- Making assertions not supported by the extract (e.g., mentioning interest rates or exchange rates when the extract does not).
- Forgetting to mention the time dimension (short run vs long run), which is crucial for this question.
Things to Be Careful About
- The mark scheme awards separate marks for each side and for the conclusion. Ensure both sides are developed with specific evidence from the text.
- Use the exact figures from the extract (1-1.3%, 3.4%, etc.) to strengthen the argument.
- The conclusion should directly answer "whether or not it is likely" — do not simply say "it depends" without explaining what it depends on and which direction the evidence points.
The rest of this paper
6 more questions- Q2Efficiency and Market Failure · Market Structures · Performance of Firms in Different Market Structures25M
- Q3Market Structures · Performance of Firms in Different Market Structures · Objectives and Pricing Policies of Firms25M
- Q4Wage Determination and Labour Market Intervention25M
- Q5The Multiplier and National Income Determination · Economic Development and Living Standards25M
- Q6Money and Banking25M
- Q7Effectiveness of Macroeconomic Policies · Employment and Unemployment25M