Economics 9708/32 — May/June 2021
Cambridge A-Level · A Level Multiple Choice · answer key with instant marking and worked solutions
Topics Government Policies to Correct Market Failure · Employment and Unemployment · Efficiency and Market Failure · Objectives and Pricing Policies of Firms · Market Structures · Economic Growth and Sustainability · +18 more
Tap an option under each question to check it — your score builds as you go.
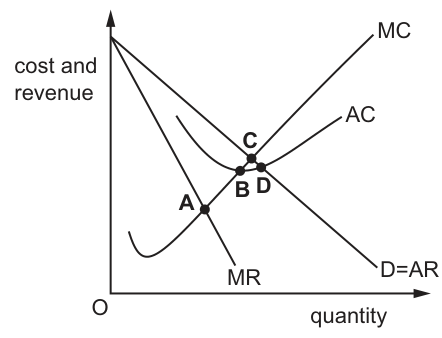
The diagram shows a monopolistically competitive firm.
Which point represents allocative efficiency?
Options
A point A on Fig. 1.1
B point B on Fig. 1.1
C point C on Fig. 1.1
D point D on Fig. 1.1
Answer
Allocative efficiency occurs where the price consumers are willing to pay equals the marginal cost of production, meaning Average Revenue (AR) equals Marginal Cost (MC). Looking closely at the cluster of points near the top of the diagram: the AC curve is the smooth, near-flat curve running through points B and D, while two straight lines (MC and AR) cross each other just above it at point C. Point B is where MC crosses AC (productive efficiency), point D is where AR crosses AC (normal profit), and point C is where MC crosses AR — the allocative efficiency condition.
Answer
C
C
Background Concept
Allocative efficiency is achieved when resources are distributed in a way that maximizes net social benefit. For a firm, this occurs where the marginal benefit to consumers (represented by the price they are willing to pay, i.e., the Average Revenue or Demand curve) equals the marginal cost of producing that last unit (Marginal Cost). The condition is therefore AR = MC (or P = MC). Productive efficiency, by contrast, occurs when a firm produces at the lowest possible average cost, which is where the Marginal Cost curve intersects the Average Cost curve at its minimum point (MC = AC). In a monopolistically competitive market, firms face a downward-sloping demand curve and typically operate with excess capacity, meaning they are neither allocatively nor productively efficient in the long run.
Understanding the Question
The question asks to identify the point on a diagram of a monopolistically competitive firm that represents allocative efficiency. The diagram provides four curves (D=AR, MR, AC, MC) and four marked points (A, B, C, D), three of which (B, C, D) are clustered tightly together near the AC curve's minimum.
Approach
- Recall the definition of allocative efficiency: AR = MC.
- Identify which curves form each of the closely-spaced points B, C and D by tracing each line's direction into and out of the cluster.
- Locate the AR × MC intersection specifically, distinguishing it from AC × MC (productive efficiency) and AC × AR (normal profit).
Step-by-Step Reasoning
- Point A is the intersection of MR and MC, away from the cluster. This is the profit-maximizing output level for the firm.
- In the B/C/D cluster, the AC curve is the smooth, gently curved line that runs through the lower two points (B and D), consistent with it being close to its minimum there.
- One straight line enters the cluster from the lower-left (this is MC, rising throughout the diagram) and exits to the upper-right toward the "MC" label. It touches the AC curve at the lower-left point of the cluster — point B — before continuing up to point C. So B = MC ∩ AC, the productive-efficiency point (minimum AC).
- The other straight line enters the cluster from the upper-left (this is AR, declining throughout the diagram, labelled "D=AR") and exits to the lower-right. It touches the AC curve at the lower-right point of the cluster — point D — after crossing through C. So D = AR ∩ AC, the point where price equals average cost (normal profit only, not allocative efficiency).
- The two straight lines, MC and AR, cross each other at the topmost point of the cluster — point C. Since price (AR) equals marginal cost (MC) exactly at C, this is the allocative efficiency point.
- Therefore, the correct point representing allocative efficiency is C.
Key Takeaways
- Allocative efficiency: AR = MC (Point C in this diagram).
- Productive efficiency: MC = AC at minimum AC (Point B in this diagram).
- AR = AC (normal profit, zero economic profit): Point D in this diagram — easy to mistake for allocative efficiency because it also sits on the AC curve.
- Profit maximization: MR = MC (Point A).
Common Mistakes
- Confusing allocative efficiency (AR = MC) with the AR = AC normal-profit point, especially when both lie close together on/near the AC curve, as at points C and D here.
- Assuming the point where a curve "touches" AC is always the allocative-efficiency point — AC touches both MC (at B) and AR (at D), neither of which is where MC = AR.
- Not tracing each line's slope carefully enough through a tightly clustered set of points; the direction a line enters and leaves the cluster identifies which curve it belongs to.
Things to Be Careful About
- When points are drawn very close together, trace each straight line's slope through the whole diagram (back to its axis label) rather than judging by proximity alone.
- Always double check exam diagrams directly — an auto-generated or assumed description of "point D = MC∩AR" can be wrong; here the real diagram shows C = MC∩AR and D = AR∩AC.
The rest of this paper
29 more questions- Q2Government Policies to Correct Market Failure1M
- Q3Externalities, Social Costs and Benefits1M
- Q4Utility Theory1M
- Q5Indifference Curves and Budget Lines1M
- Q6Objectives and Pricing Policies of Firms1M
- Q7Growth and Survival of Firms1M
- Q8Costs of Production1M
- Q9Efficiency and Market Failure · Market Structures1M
- Q10Performance of Firms in Different Market Structures1M
- Q11Market Structures1M
- Q12Objectives and Pricing Policies of Firms · Revenue and Profit1M
- Q13Government Policies to Correct Market Failure1M
- Q14Government Policies to Correct Market Failure1M
- Q15Characteristics of Countries at Different Levels of Development · Equity, Poverty and Redistribution1M
- Q16Demand for and Supply of Labour1M
- Q17Wage Determination and Labour Market Intervention1M
- Q18Economic Growth and Sustainability1M
- Q19Economic Development and Living Standards1M
- Q20Relationships Between Countries at Different Levels of Development1M
- Q21Employment and Unemployment1M
- Q22Employment and Unemployment1M
- Q23Economic Growth and Sustainability1M
- Q24The Multiplier and National Income Determination1M
- Q25Money and Banking1M
- Q26Money and Banking1M
- Q27Relationships Between Countries at Different Levels of Development1M
- Q28Employment and Unemployment · Effectiveness of Macroeconomic Policies · Macroeconomic Objectives and Policy Conflicts1M
- Q29Effectiveness of Macroeconomic Policies · Balance of Payments and Policies to Correct Disequilibrium1M
- Q30Macroeconomic Objectives and Policy Conflicts1M