Physics 9702/36 — October/November 2025
Cambridge AS Level · Advanced Practical Skills · worked solutions for every part, with the mark scheme
Topics Manipulation, Measurement and Observation · Presentation of Data and Observations · Analysis, Conclusions and Evaluation
In this experiment, you will investigate the phase difference between the oscillations of two mass–spring systems.
• Assemble the apparatus as shown in Fig. 1.1.
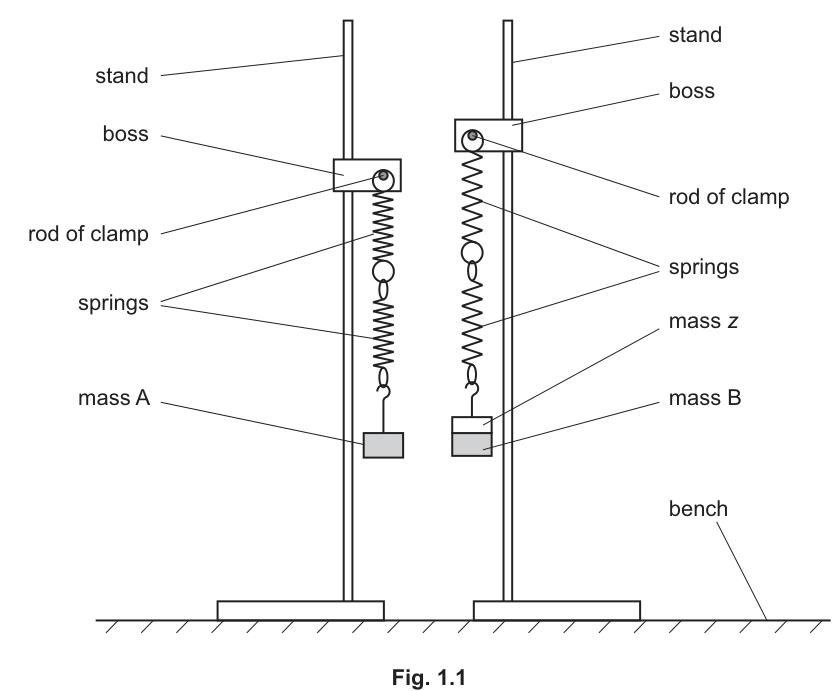
• Mass A and mass B are each .
• Add a mass of to mass B.
Record the value of .
= ______
• is given by .
Calculate .
= ______
• Pull both A and B down a short distance and release them together. Observe the oscillations. A and B initially oscillate in phase (both moving up and down together), then their oscillations go out of phase and then become in phase again.
• The time from A and B oscillating in phase to the next time they oscillate in phase is .
Measure and record .
= ______
Working
Recorded added mass:
Measured time between successive in-phase conditions (example):
Answer
z = 40 g, M = 240 g, P = 18.5 s (example)
Background Concept
Two oscillators (mass–spring systems) with slightly different periods will drift in and out of phase. When they start in phase, the phase difference increases with time because one oscillator completes cycles slightly faster than the other. After some time, they return to being in phase again.
The quantity defined here is the time from one “in phase” condition to the next “in phase” condition (often called a beat period in this context).
Understanding the Question
You are told:
- mass A is ,
- mass B is plus an extra mass (initially ),
- .
You must:
- record from the balance, 2) calculate , and 3) observe the motion and measure the time between successive times when A and B are in phase.
Approach
- Read directly from the mass pieces / balance and record to the balance resolution.
- Add to obtain .
- For , use the definition in the question: start timing when A and B are clearly in phase (moving together), stop when they are next clearly in phase again.
Step-by-Step Reasoning
- Added mass is specified as , so record:
- Use the given relationship:
- To measure reliably:
- Pull both masses down by a small similar distance and release together.
- Watch for the condition “in phase” (both moving up together and down together). Choose a clear reference, e.g. when both pass through equilibrium moving upward.
- Start the stopwatch at one in-phase moment and stop at the next in-phase moment.
- Record to the stopwatch resolution (commonly ).
(Your numerical value of depends on your apparatus and readings, so any sensible measured value with correct precision is acceptable.)
Key Takeaways
- Record directly measured values to the instrument’s resolution.
- Use the provided formula for a derived quantity ().
- Apply the operational definition of (in-phase to next in-phase) to decide when to start/stop timing.
Common Mistakes
- Forgetting to include units (g for and , s for ).
- Using the wrong timing interval (e.g. timing from in phase to out of phase).
- Recording with inappropriate precision (e.g. many decimal places not justified by a handheld stopwatch).
Things to Be Careful About
- Keep oscillations small so the motion is close to SHM and easier to judge.
- Ensure both are released at the same time; otherwise the initial phase is not well-defined.
- Decide a consistent “in phase” reference event (e.g. both at lowest point, or both crossing equilibrium in the same direction).
Change and determine . Repeat until you have six sets of values of and .
Record your results in a table. Include values of , and in your table.
Answer
Obtain six different values of and for each value:
- calculate ,
- measure (repeat and average),
- calculate and .
Record all results in one table with headings including units, e.g.
(Values are student-dependent.)
Single clear results table with six sets of z and P, plus computed M, 1/√M and 1/P (with units).
Background Concept
A good practical investigation needs:
- enough data points to reveal a trend (here, six sets),
- a suitable range of the independent variable ( hence ),
- repeat readings to reduce random uncertainty,
- correct processing of data into forms that allow a straight-line graph.
Calculated quantities should be presented with consistent significant figures and with units.
Understanding the Question
You must change the added mass and determine the corresponding time (time between successive in-phase conditions). You then need a table containing not only and but also:
Six sets means six different values of with a matching measured for each.
Approach
- Choose six different values of (spread out, not all close together).
- For each :
- assemble the mass on B,
- start both oscillations together,
- measure (repeat at least twice and take a mean).
- Fill the table row-by-row:
- compute by addition,
- compute using a calculator,
- compute .
- Ensure headings show quantity and unit, and ensure consistent dp / sf within each column.
Step-by-Step Reasoning
-
Choosing values: Use values that make clearly different each time (for example, increments of or , depending on available masses). This improves the spread on the later graph.
-
Measuring well:
- Keep amplitude small.
- Start timing at a clearly defined in-phase event (e.g. both at the lowest point, or both crossing equilibrium upward).
- Stop timing at the next time the same event happens with both in phase.
- Repeat the measurement of and average to reduce random reaction-time effects.
-
Tabulation conventions:
- Put all data in a single table.
- Include units in the heading (not in every cell).
- Keep decimal places consistent for each calculated column.
-
Derived columns:
- For each row, compute in grams.
- Compute ; if is in g, then the unit is .
- Compute ; if is in s, then unit is .
Key Takeaways
- Six points and a good range are essential for a reliable straight-line test.
- Repeats improve precision; means are more reliable than single timings.
- Correct headings and units are part of the assessment in Paper 3.
Common Mistakes
- Forgetting to include either , , or in the table.
- Mixing units (some in g, some in kg) within the same data set.
- Inconsistent significant figures (e.g. wildly different dp in the same column).
- Too small a range of , producing a cramped graph with large percentage uncertainties in gradient.
Things to Be Careful About
- If you decide to convert to kg, do it for every row and update units: would then be .
- Don’t round prematurely before calculating .
- Ensure the same in-phase reference is used every time when timing .
Answer
Plot a graph with:
- -axis: in
- -axis: in (or if is in kg)
Use a suitable scale (at least half the grid) and plot all six points.
Graph of 1/P (y) against 1/√M (x), correctly labelled with units and sensible scales.
Background Concept
To test a proposed linear relationship, you plot the variables in a form that should give a straight line. Good graphs in Cambridge practical papers require:
- correct axis choice,
- correct labels including units,
- scales that make good use of the page,
- points plotted accurately and clearly.
Understanding the Question
You have a results table containing , , and the derived quantities and . You are asked specifically to plot:
- vertical axis: ,
- horizontal axis: .
Approach
- Decide the units you are using for (commonly g in this experiment). Keep them consistent.
- Choose axis ranges that cover all your values with some margin.
- Pick simple scales (e.g. 1 big square = 0.01) rather than awkward ones.
- Plot each point as a small cross.
Step-by-Step Reasoning
- From the table, identify the minimum and maximum values of and .
- Draw axes and label:
- as with unit (if in g).
- as with unit .
- Choose scales so the plotted data fills at least half of each axis.
- Plot all six points carefully (use a ruler to read grid lines; avoid large blobs).
Key Takeaways
- Correct labels include both the quantity and its unit.
- Using most of the grid improves the accuracy of gradient and intercept.
Common Mistakes
- Swapping axes (plotting on ).
- Missing units or writing units wrongly (e.g. instead of ).
- Using a tiny section of the graph paper, making the best-fit line uncertain.
Things to Be Careful About
- If is in g, then has unit and has unit .
- Keep consistent significant figures in the plotted values to match your table.
Answer
Draw one straight line of best fit through the plotted points so that the points are approximately balanced about the line.
Straight line of best fit drawn.
Background Concept
A best-fit line represents the overall trend in data when random scatter is present. In Paper 3, the expectation is usually a single straight line (not dot-to-dot), with roughly equal scatter above and below.
Understanding the Question
You already plotted against . Now you must draw the straight line that best represents that relationship.
Approach
- Use a ruler.
- Aim for a line that passes through the “middle” of the data: roughly equal numbers (or equal overall deviation) of points above and below.
- Do not force the line through the origin unless the data clearly supports it.
Step-by-Step Reasoning
- Visually judge the trend of the points.
- Place a ruler so the line passes close to as many points as possible while keeping the scatter balanced.
- Draw a thin, clean straight line across the full range of the plotted data (not a short segment).
Key Takeaways
- Best-fit means “represents the trend”, not “connect the points”.
Common Mistakes
- Joining points dot-to-dot.
- Drawing a line that deliberately passes through every point, causing bias.
- Forcing the line through when the intercept is not zero.
Things to Be Careful About
- If one point is clearly anomalous, you may choose not to let it dominate the line, but you should still draw the line to fit the general pattern.
Determine the gradient and -intercept of this line.
gradient = ______
-intercept = ______
Working
Using two well-separated points on the best-fit line:
Read the -intercept from where the best-fit line crosses the -axis ().
Answer
gradient = (from graph)
-intercept = (from graph)
Gradient and y-intercept read from the best-fit line (student-dependent).
Background Concept
For a straight-line graph:
- is the gradient (slope): ,
- is the -intercept: the value of when .
In practical graphs, you must calculate the gradient using two points on the best-fit line, not necessarily two data points, and they should be far apart to reduce percentage reading error.
Understanding the Question
Your graph has:
- ,
- .
You must determine:
- the gradient of your best-fit line,
- the -intercept of your best-fit line.
Approach
- Draw a large triangle on the best-fit line (use points that are widely separated).
- Read the coordinates of the two triangle points.
- Compute gradient using .
- Read the intercept by extending the line to the -axis and reading the value.
Step-by-Step Reasoning
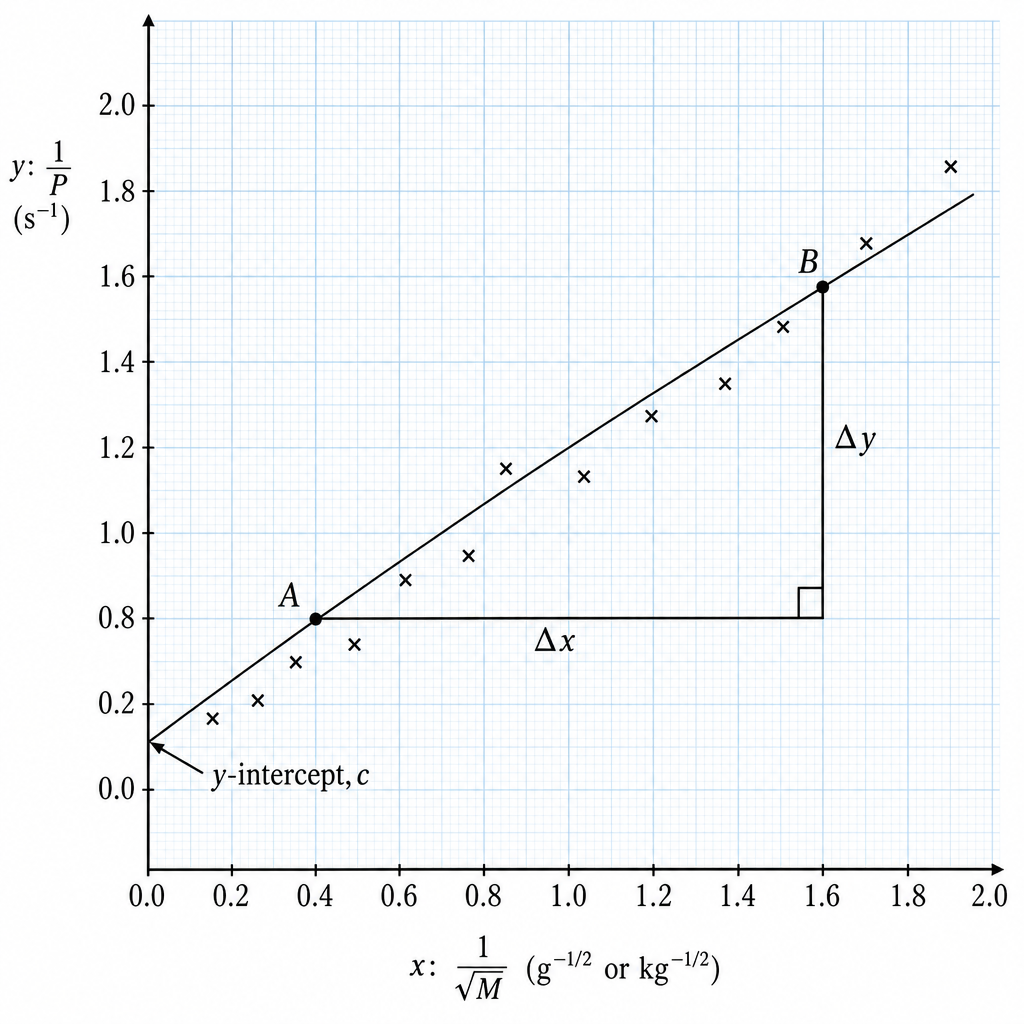
- Pick two points A and B on the best-fit line, ideally near the ends of the drawn line.
- Read their coordinates: and where and .
- Calculate:
- For the intercept, extend the best-fit line until it crosses the -axis (where ). Read this value as .
Units:
- has unit .
- If is in g, has unit .
So gradient unit is:
The intercept has the same unit as , i.e. .
Key Takeaways
- Use the best-fit line and a large triangle for a more accurate gradient.
- Always quote gradient and intercept with correct units.
Common Mistakes
- Using two adjacent points (small triangle) leading to large uncertainty.
- Calculating by accident (inverting the gradient).
- Reading the intercept from a data point rather than from the best-fit line.
Things to Be Careful About
- Ensure you use the same scale divisions when reading coordinates.
- Don’t round intermediate readings too aggressively; keep enough precision from the graph readings to give a sensible final gradient.
- If the best-fit line does not reach the -axis on your plotted range, extend it carefully with a ruler to read the intercept.
It is suggested that the quantities and are related by the equation
where and are constants.
Use your answers in (c)(iii) to determine the values of and .
Give appropriate units.
= ______
= ______
Working
Given
Compare with where and .
So
Units:
- has same unit as : .
- has units of (gradient) = (or if in kg).
Answer
a = gradient (units g^{1/2} s^{-1} or kg^{1/2} s^{-1}); b = y-intercept (units s^{-1}).
Background Concept
If a relationship can be written in the form
then a plot of against gives a straight line with:
- gradient ,
- intercept .
Matching an experimental straight line to this form is how you extract constants from data.
Understanding the Question
You are told the suggested model:
From part (c)(iii) you already have the gradient and -intercept of the graph of (y-axis) against (x-axis). You must use these to find and , and include appropriate units.
Approach
- Identify what you plotted: and .
- Rewrite the model as .
- Therefore, is the gradient and is the y-intercept.
- Work out units from the axis units.
Step-by-Step Reasoning
Start with the given equation:
Define:
Then the equation becomes:
So by comparison with :
- gradient ,
- intercept .
Units:
- is in seconds, so is in . Hence is in .
- If is in grams, then has units .
So
If you used kilograms for , replace by .
Key Takeaways
- A graph is most useful when it linearises the relationship into .
- Constants are read directly as gradient and intercept when variables match this form.
- Units of constants come from the plotted quantities’ units.
Common Mistakes
- Swapping and (remember: multiplies , is the intercept).
- Giving the same units as (they are generally different).
- Mixing g and kg between table, graph, and final units.
Things to Be Careful About
- Use the gradient and intercept values from your best-fit line (not from two data points).
- State units clearly using index notation (e.g. , ).
- If you converted to kg at any stage, keep that consistent through to the units for .
In this experiment, you will investigate the tension in a string.
• Set up the apparatus as shown in Fig. 2.1.
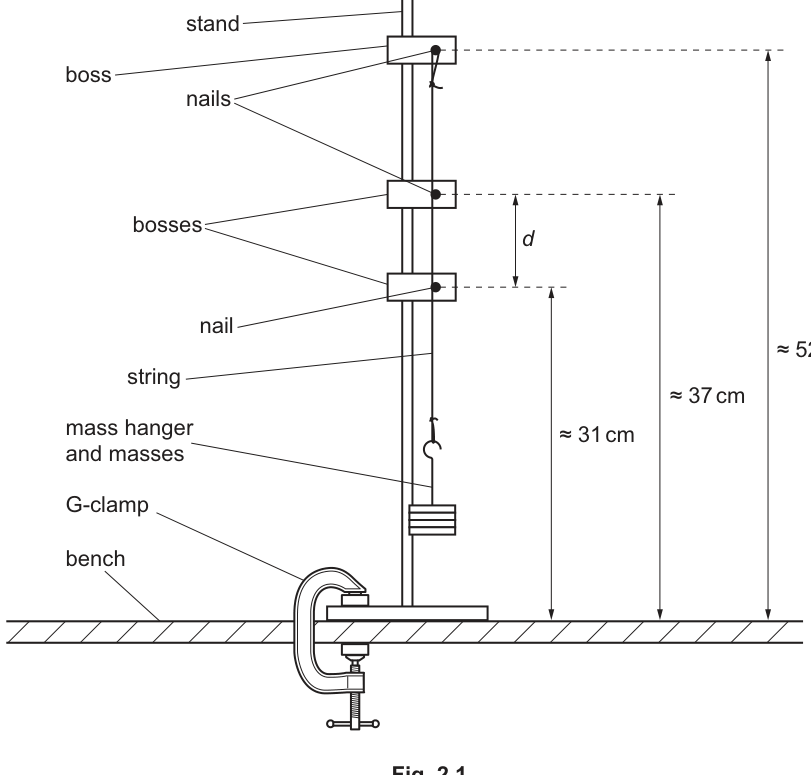
• The mass hanger and masses should have a total mass of .
• The distance between the two lower nails is , as shown in Fig. 2.1.
Measure and record .
= ______
Measure the vertical distance between the two lower nails with a ruler, to the nearest .
Example recorded value:
d = 37.0 cm (example)
Background Concept
In Paper 3, marks for a measurement are awarded for (i) measuring the correct quantity shown on the diagram and (ii) recording it with appropriate precision for the instrument used.
A ruler typically has smallest divisions, so a sensible recorded precision is to the nearest , i.e. .
Understanding the Question
You are told that is the distance between the two lower nails in Fig. 2.1. So you must locate the two lower nails and measure the separation between them (along the stand, i.e. the vertical separation shown).
Approach
- Place the ruler alongside the stand.
- Read the positions of the two lower nails (or their boss positions) against the ruler.
- Subtract to get .
- Record in to .
Step-by-Step Reasoning
- Align the ruler parallel to the stand so that it measures the separation vertically.
- Avoid parallax: your eye should be level with the mark you are reading.
- Read the position of the middle nail and the bottom nail, then compute the difference.
- Record a value such as (your value depends on your set-up).
Key Takeaways
- Measure the correct distance indicated by the diagram.
- Record to a precision appropriate to the instrument (typically for a ruler).
Common Mistakes
- Measuring the wrong distance (e.g. from the top nail to a lower nail).
- Recording with inappropriate precision (e.g. with no decimal, or implying unrealistic precision).
Things to Be Careful About
- Ensure you measure between the two lower nails only.
- Keep the ruler aligned with the direction of the distance being measured and avoid parallax.
Working
Answer
3.92 N
Background Concept
For a mass hanging at rest, the tension in the string equals the weight of the mass.
Weight is given by
where is the mass in and .
Understanding the Question
You are told to calculate the string tension using for total mass . So you simply multiply by .
Approach
Use
and substitute the given and .
Step-by-Step Reasoning
- Substitute values:
- Calculate:
- Quote to 3 s.f. (matching the given data):
Key Takeaways
- Tension equals weight for a stationary hanging mass.
- Keep units consistent: in gives in .
Common Mistakes
- Using but writing the unit incorrectly for tension.
- Writing (wrong operation).
Things to Be Careful About
- Use the total mass of hanger + slotted masses.
- Quote the unit for tension.
• Hook the newton meter on the string half-way between the two lower nails and pull it horizontally with a force of , as shown in Fig. 2.2.
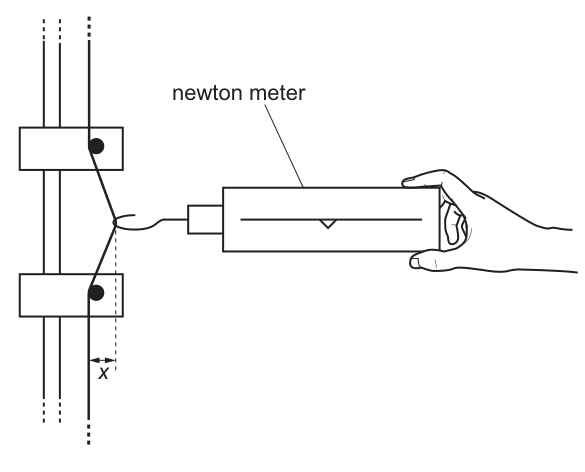
• The force causes the string to deflect a distance , as shown in Fig. 2.2.
Measure and record .
= ______
Apply with the newton meter and measure the horizontal deflection with a ruler, to the nearest .
Example recorded value:
x = 6.2 cm (example)
Background Concept
A displacement measurement in practical work needs:
- a clear reference position (here, the undeflected string position),
- a clear measured point (here, the midpoint of the string segment between the two lower nails),
- an instrument of suitable resolution (ruler/metre rule),
- a steady reading (no oscillations).
Understanding the Question
You must pull the string horizontally at the midpoint between the two lower nails with a force using a newton meter. This produces a sideways deflection . You then measure and record it in .
Approach
- Locate the midpoint between the two lower nails.
- Hook the newton meter at this midpoint.
- Pull until the newton meter reads .
- Measure the horizontal shift from the original (undeflected) string line to the pulled position.
Step-by-Step Reasoning
- With no pull, note the vertical line of the string between the lower nails (this is your zero position).
- Pull sideways and keep the newton meter reading at .
- Wait for the string to stop oscillating.
- Use a ruler (or set square) to measure the perpendicular horizontal distance from the original vertical line to the new position at the midpoint.
- Record to , e.g. .
Key Takeaways
- Always measure a displacement relative to a defined reference.
- For ruler measurements, record to (typical).
Common Mistakes
- Measuring along the string (gives a longer distance than the horizontal deflection).
- Measuring from the nail rather than from the original straight line of the string.
- Not keeping at while measuring.
Things to Be Careful About
- Parallax: read the ruler at eye level.
- Ensure you are measuring the deflection at the midpoint between nails (as instructed).
Estimate the percentage uncertainty in your value of . Show your working.
percentage uncertainty = ______
Working
Assume ruler uncertainty in is .
Answer
1.6%
Background Concept
For a directly measured quantity, an absolute uncertainty can be estimated from the instrument resolution.
- If a ruler is read to the nearest , a common estimate is an absolute uncertainty of about for a single reading.
Percentage uncertainty is
where is the absolute uncertainty.
Understanding the Question
You must estimate the percentage uncertainty in your measured value of and show working. So you need an assumed absolute uncertainty and then compute the percentage.
Approach
- Choose a sensible absolute uncertainty for based on how you measured it.
- Use .
Step-by-Step Reasoning
- If is measured with a ruler to , take .
- With example :
- Quote sensibly (typically 2 s.f.): .
(If you judged the reading to be harder, e.g. because the string is thick or moving, you might justify a larger ; the key is to show a reasonable method.)
Key Takeaways
- Percentage uncertainty comes from .
- Instrument resolution is the starting point for .
Common Mistakes
- Using without justification when readings are only to .
- Forgetting to multiply by 100.
Things to Be Careful About
- If is found from two readings (initial and final position), you should consider adding the absolute uncertainties of both readings. Only do this if it matches how you actually measured and you state it clearly.
Working
Using and :
Answer
19.5 cm
Background Concept
This question gives you a defined mathematical relationship:
This has the form of Pythagoras’ theorem, where is the hypotenuse of a right triangle with perpendicular sides and . As long as and are in the same units, comes out in those same units.
Understanding the Question
You have measured (the horizontal deflection) and (the separation of the two lower nails). You are asked to calculate using the provided formula and to record it in .
Approach
- Ensure and are both in .
- Compute .
- Compute .
- Add them.
- Take the square root to get .
Step-by-Step Reasoning
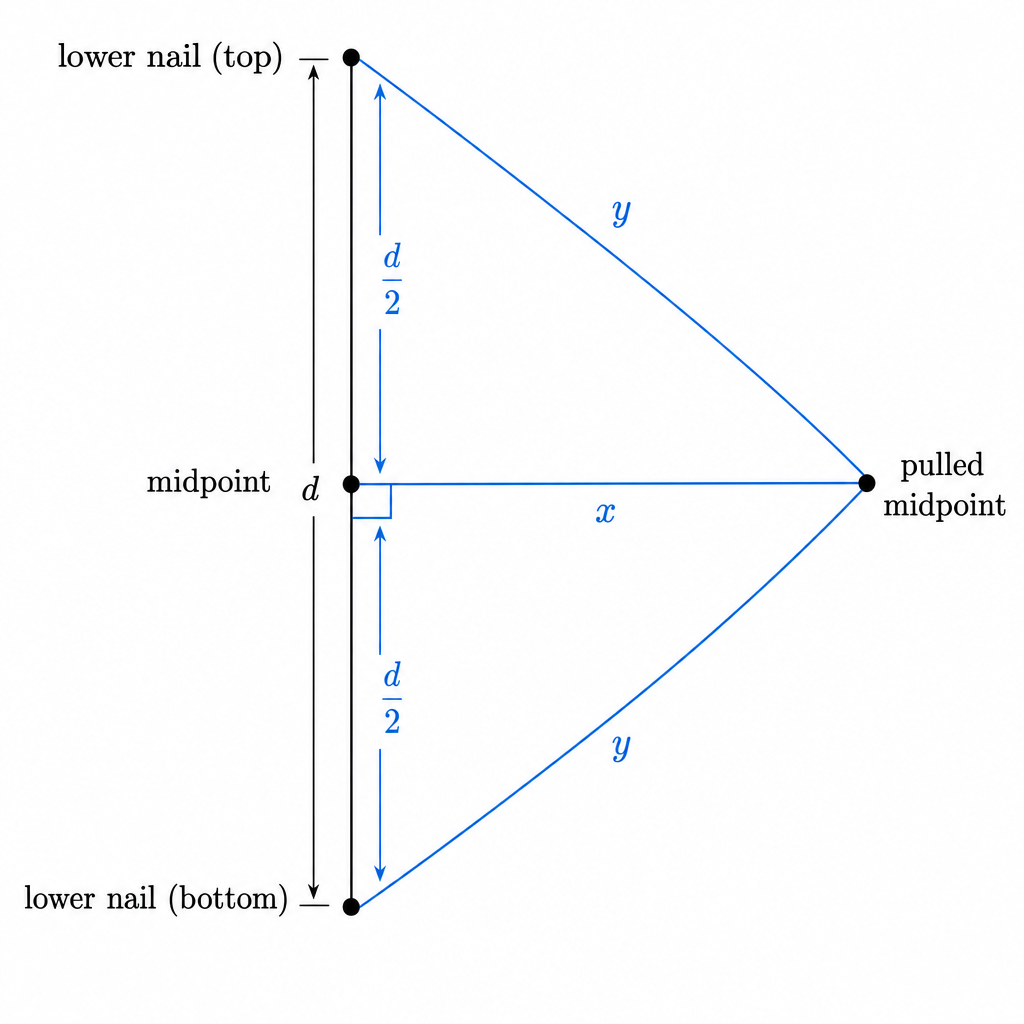
Using the example values and :
- Square :
- Compute :
- Add:
- Square root:
- Quote appropriately (matching measurement precision): .
Key Takeaways
- Keep units consistent before substitution.
- When squaring lengths you get , and the square root returns to .
Common Mistakes
- Using instead of .
- Mixing units (e.g. in cm and in m).
- Forgetting the square root at the end.
Things to Be Careful About
- Significant figures: might be 2 s.f., so quoting to 3–4 s.f. is usually unnecessary.
- Calculator brackets: ensure you calculate correctly, not .
• Add slotted masses to the mass hanger so that the total mass is .
• Repeat (b), (c)(i) and (c)(iii).
= ______
= ______
= ______
For :
Apply and measure (example):
Using :
T = 6.87 N, x = 3.5 cm, y = 18.8 cm (example)
Background Concept
Changing the hanging mass changes the tension via . A larger gives a larger tension, so for the same sideways force the deflection is typically smaller.
You then recompute from the same geometrical relationship:
Understanding the Question
You add masses so the total is , then you must repeat:
- (b): calculate using ,
- (c)(i): measure the new when ,
- (c)(iii): calculate the corresponding .
Approach
- Compute from .
- Perform the pull at and record the new .
- Substitute and the same measured into the formula for .
Step-by-Step Reasoning
- Tension:
-
Deflection: with greater tension the string resists sideways displacement, so is usually less than before (example ).
-
Calculate :
Key Takeaways
- Repeating measurements for a new value of gives another data set to test the proposed relationship.
- Consistent methods (same , same ) are essential.
Common Mistakes
- Forgetting to include the mass hanger in the total mass.
- Allowing to differ from when measuring .
- Using a new value of without re-measuring or stating it.
Things to Be Careful About
- Keep the same midpoint position for pulling.
- Record to consistent precision (e.g. ) so later significant figures in are justified.
It is suggested that the relationship between , and is
where is a constant.
Using your data, calculate two values of .
first value of = ______
second value of = ______
Working
From :
For :
For :
Answer
first value of
second value of
k ≈ 1.2 N and 1.3 N (example)
Background Concept
When a relationship includes an unknown constant, you can find the constant by rearranging and substituting measured values.
Given
is constant if the relationship is correct. Rearranging gives
Because and are both lengths measured in the same units, the ratio is dimensionless, so has the same unit as , i.e. .
Understanding the Question
You have two sets of data (one for and one for ). You must calculate for each set to see whether it stays about the same.
Approach
- Rearrange to .
- Use your calculated and calculated together with your measured .
- Compute two values, and .
Step-by-Step Reasoning
Using the example data:
- First run ():
- , ,
- Second run ():
- , ,
You then round both values to the appropriate significant figures (see next part).
Key Takeaways
- Always rearrange first so you substitute correctly.
- Check units: here comes out in .
Common Mistakes
- Using (wrong rearrangement).
- Mixing units (e.g. converting only to m but leaving in cm).
Things to Be Careful About
- Use the corresponding , , and from the same trial.
- If your calculated values differ slightly, that is expected; later you compare within uncertainty.
The limiting data are (2 s.f.) and the measured values (typically 2 s.f.).
So is given to 2 significant figures.
k to 2 significant figures
Background Concept
A calculated quantity should not be quoted to more significant figures than the least precise quantity used in the calculation.
If you multiply/divide quantities, the result should usually be given to the same number of significant figures as the input with the fewest significant figures.
Understanding the Question
You calculated from
You must justify how many significant figures you used for .
Approach
- Identify the least precisely known quantities that affect .
- Choose significant figures for to match those.
Step-by-Step Reasoning
- is calculated from and . Here (3 s.f.) and is given (often 3 s.f.), so can reasonably be 3 s.f.
- is a measured deflection and is commonly recorded to ; values like or are typically 2 s.f.
- is calculated from and , but its meaningful precision is still limited by the precision of and .
- Also, the applied force is stated as (2 s.f.), and in practice you cannot hold it exactly at more than that.
Therefore, quoting to 2 significant figures is justified.
Key Takeaways
- Significant figures in derived constants should reflect measurement precision.
Common Mistakes
- Quoting to 4 s.f. from a calculator display.
- Rounding inconsistently (e.g. one to 2 s.f. and the other to 3 s.f. without reason).
Things to Be Careful About
- If your measured values are recorded to 3 s.f. (e.g. ), then you may justify 3 s.f.; the justification must match what you actually recorded.
It is suggested that the percentage uncertainty in the values of is .
Using this uncertainty, explain whether your results support the relationship in (e).
Using and :
, so the two values agree within the stated uncertainty and support .
Yes, supports within 20% uncertainty
Background Concept
Experimental results rarely match exactly. We decide whether they support a suggested relationship by checking whether differences are within the stated uncertainty.
If the percentage uncertainty in is , then two values of are consistent if their difference is not more than about (a common simple test is to compare percentage difference with the uncertainty).
Understanding the Question
You have two values of from part (e). You are told to assume a uncertainty in and to decide whether your results support the relationship (i.e. whether is approximately constant).
Approach
- Find how different the two values are (percentage difference).
- Compare this with .
- Conclude whether they agree within uncertainty.
Step-by-Step Reasoning
Using example rounded values and :
- Difference:
- Mean value:
- Percentage difference:
Since is less than the stated , the two values of are consistent within uncertainty. That means the data support the proposed relationship.
Key Takeaways
- “Supports the relationship” means “consistent within uncertainty,” not “exactly equal.”
- Use a clear quantitative comparison when an uncertainty is given.
Common Mistakes
- Concluding “does not support” just because exactly.
- Comparing the absolute difference () to without converting to a percentage.
Things to Be Careful About
- Use your own calculated values (not the example ones).
- State the conclusion explicitly and link it to the inequality (e.g. “difference < 20% therefore supports”).
Describe four sources of uncertainty or limitations of the procedure for this experiment.
For any uncertainties in measurement that you describe, you should state the quantity being measured and a reason for the uncertainty.
- Measurement of : difficult to judge the undeflected reference line and the position of the string (string has thickness / may be moving), giving parallax and reading uncertainty.
- Maintaining : newton meter reading fluctuates and is hard to hold steady while measuring .
- Tension not uniform: friction where the string contacts the nails means the tension between the lower nails may not equal .
- String stretches / oscillates: applying the pull can cause the string to stretch or vibrate so the measured is not a steady equilibrium value.
Four valid limitations/uncertainties (see working)
Background Concept
Uncertainties and limitations come from:
- measurement resolution and judgement (random uncertainty),
- difficulty maintaining constant conditions,
- systematic effects (e.g. friction),
- assumptions in the physics model (e.g. uniform tension).
Good practical answers:
- name the quantity affected, and
- give a physical reason why it is uncertain or biased.
Understanding the Question
You must give four sources of uncertainty/limitations in this specific string-tension experiment. For measurement uncertainties, you must state what is being measured and why it is uncertain.
Approach
Think through each stage:
- measuring ,
- applying and reading ,
- measuring ,
- assuming everywhere,
- stability of the string.
Choose four distinct issues and describe them clearly.
Step-by-Step Reasoning
Examples of creditworthy points:
- Uncertainty in : the string is not a sharp line; it has thickness, may not remain still, and the “original” vertical reference position is hard to mark, so has parallax/judgement uncertainty.
- Uncertainty in : the newton meter pointer may fluctuate and it is hard to keep exactly while also reading . This changes .
- Friction at nails (systematic): the string rubbing on nails means the tension may differ on each side of a contact point; therefore the tension in the lower section may not equal the simple value .
- Oscillation/stretching: pulling can make the string vibrate; if you measure before it settles you do not get the true equilibrium . Also, elastic stretching changes the geometry during the measurement.
Other acceptable limitations could include difficulty identifying the midpoint between nails, nails not perfectly aligned, or the hanging mass swinging.
Key Takeaways
- Always link an uncertainty to a specific measured quantity.
- Include both random (reading/judgement) and systematic (friction, non-uniform tension) limitations.
Common Mistakes
- Writing vague statements like “human error” or “parallax” with no quantity stated.
- Repeating the same idea four times (e.g. four versions of “hard to measure”).
Things to Be Careful About
- Make sure each point is distinct.
- Include the reason (e.g. “string oscillates so reading changes”), not just the effect.
Describe four improvements that could be made to this experiment. You may suggest the use of other apparatus or different procedures.
- Measure with a fixed ruler scale and a perpendicular set square/pointer attached at the midpoint of the string to reduce parallax and improve repeatability.
- Use a clamp/retort stand to hold the newton meter position so that is steady at while is read.
- Reduce friction at contact points by using smooth pulleys/low-friction rings instead of nails (or lubricate/ensure smooth nail surfaces).
- Take repeated readings of for each mass and average (and wait for oscillations to die away before recording).
Four valid improvements (see working)
Background Concept
Improvements are changes that reduce uncertainty or remove limitations. Strong answers:
- are specific and practical,
- explain how the change reduces uncertainty or systematic error,
- ideally link back to a limitation from part (g)(i).
Understanding the Question
You must suggest four improvements (apparatus or procedure) that would make the experiment more reliable/accurate.
Approach
Match improvements to common issues:
- improve how is measured,
- keep constant,
- reduce friction so tension is closer to everywhere,
- reduce random scatter with repeats and averaging.
Step-by-Step Reasoning
Examples:
- Better measurement of : attach a small pointer at the midpoint of the string and place a ruler behind it; use a set square to ensure the horizontal distance is measured perpendicularly. This reduces judgement and parallax.
- Keep steady: clamp the newton meter or use a fixed horizontal pulling arrangement so the force remains at while you read .
- Reduce friction: replace nails with smooth pulleys or low-friction rings so the tension is more uniform along the string, making a better assumption.
- Repeats and averaging: repeat measurements several times for each and average; also wait until oscillations die away before taking readings. This reduces random uncertainty.
Other improvements could include using a digital force sensor, increasing the number of different masses to collect more data, or securing the mass to prevent swinging.
Key Takeaways
- Improvements must be realistic and should directly address the causes of uncertainty.
Common Mistakes
- Giving an “improvement” that is just a restatement of a limitation without a fix.
- Suggesting irrelevant changes (e.g. “use a micrometer” for a large displacement measurement).
Things to Be Careful About
- Do not repeat essentially the same improvement in different words.
- If you suggest additional readings, state explicitly that you would average them and keep conditions the same.