Physics 9702/35 — October/November 2025
Cambridge AS Level · Advanced Practical Skills · worked solutions for every part, with the mark scheme
Topics Manipulation, Measurement and Observation · Analysis, Conclusions and Evaluation · Presentation of Data and Observations
In this experiment, you will investigate the equilibrium of a wooden rod.
Some of the apparatus has been set up for you.
Fig. 1.1 shows the rod with two eyes.
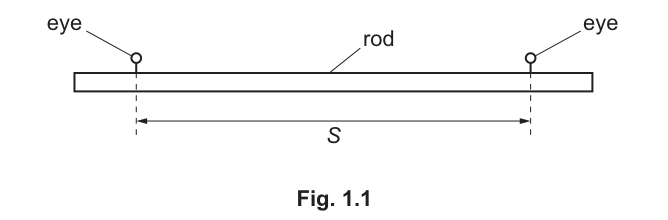
The distance between the two eyes on the rod is .
Measure and record .
= ______
Complete the set-up of the apparatus as shown in Fig. 1.2.
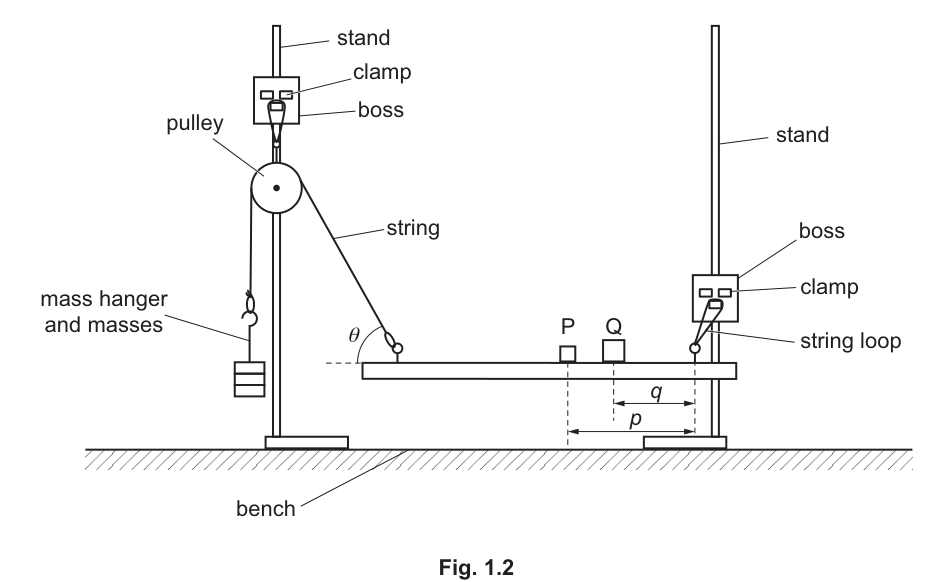
P and Q are masses.
The distance between the centre of mass P and the centre of the right-hand eye is , as shown in Fig. 1.2.
The distance between the centre of mass Q and the centre of the right-hand eye is , as shown in Fig. 1.2.
The angle between the string and the rod is .
Use some of the adhesive putty to attach Q to the rod so that is approximately .
Use some of the adhesive putty to attach P to the rod. Adjust the position of P and the position of the stand with the pulley so that the rod is parallel to the bench and is approximately .
Do not move the stands for the remainder of the experiment.
Measure and record , and .
= ______
= ______
= ______
Answer
(Representative example values, measured with a ruler to nearest and protractor to nearest .)
Example: S = 30.0 cm, θ = 45°, p = 18.4 cm, q = 26.0 cm
Background Concept
In static equilibrium, an object has no linear acceleration and no angular acceleration. In practical work, “the rod is parallel to the bench” is a convenient observable condition indicating the rod is not rotating and is in a steady equilibrium position.
The key experimental skills here are:
- measuring lengths using a ruler (choosing a sensible reference point, reading at eye level to reduce parallax),
- measuring an angle with a protractor,
- setting up apparatus to match a diagram, and
- recording values with appropriate precision and units.
Understanding the Question
You are asked to:
- measure the separation between the two eyes on the rod (Fig. 1.1),
- complete the apparatus setup (Fig. 1.2),
- set , then adjust and the pulley stand until the rod is horizontal and ,
- measure and record , and .
The note “Do not move the stands for the remainder of the experiment” matters because later readings assume the same geometry (especially ).
Approach
- Use the ruler to measure between the centres of the eyes.
- Place so that is close to .
- Adjust and the pulley stand until the rod is horizontal and is close to .
- Measure and from the centre of each mass to the centre of the right-hand eye.
- Measure between the string and the rod.
- Record all readings with correct units and sensible precision.
Step-by-Step Reasoning
- Measuring
- Align the ruler along the rod.
- Identify the centres of the two eyes.
- Measure the distance between these two centres.
- Record to the nearest mm (i.e. ) if using a standard ruler.
- Setting
- Measure from the centre of mass to the centre of the right-hand eye.
- Reposition (using adhesive putty) until the measurement is close to .
- Making the rod horizontal and
- Move along the rod to change its turning effect.
- Move the pulley stand (initially) to adjust the direction of the string and hence .
- When the rod is parallel to the bench, stop and do not move the stands afterwards.
- Measuring , , and
- : distance from centre of mass to the right-hand eye centre.
- : distance from centre of mass to the right-hand eye centre.
- : angle between the string and the rod, measured with a protractor.
Key Takeaways
- Record experimental measurements with correct precision and units.
- Use the diagram definitions carefully: all distances are from the right-hand eye.
- Achieving the stated condition (rod horizontal) is part of the skill being assessed.
Common Mistakes
- Measuring or from the wrong eye (left-hand instead of right-hand).
- Measuring to the edge of a mass rather than to its centre.
- Recording angles without the degree symbol or without appropriate precision.
- Moving the stands after the instruction not to (changes and ruins later comparisons).
Things to Be Careful About
- Parallax: read the ruler scale at eye level.
- Reference points: use the centres of the eyes and centres of masses.
- Units: if your ruler reads in cm, write cm explicitly.
- Consistency: use the same precision (e.g. all lengths to ) across the experiment.
The moment of the force about the eye due to mass P is .
The moment of the force about the eye due to mass Q is .
The values of and are given by:
where has the value .
Calculate and .
= ______
= ______
Working
Using example values and :
Answer
Example: TP = 9.03×10^-2 N m, TQ = 1.79×10^-1 N m
Background Concept
A moment (turning effect) about a point is
Its unit is . In this question you are given the expressions for the moments due to the weights of masses and about a particular eye:
Here is a weight (force). For the moment to come out in , the distances and must be in metres.
Understanding the Question
You have measured and (likely in cm). You are asked to calculate numerical values of and using the given formulae and the given value of .
Approach
- Convert and into metres.
- Substitute into and .
- Quote answers with unit and sensible significant figures.
Step-by-Step Reasoning
Using the representative readings (your readings will differ):
- Convert to SI units:
- Substitute into :
- Substitute into :
Key Takeaways
- Moments are measured in , so distances must be in metres.
- A correct unit conversion is often the main mark in a short calculation like this.
Common Mistakes
- Using and in cm without converting to m (gives answers too large by a factor of 100).
- Omitting units or writing .
- Rounding too aggressively (e.g. 1 s.f.) so later graphing becomes poor.
Things to Be Careful About
- Keep enough significant figures for plotting (typically 3 s.f. is safe).
- Ensure you use the correct multiplier (5 for , 7 for ).
Change the position of Q and adjust the position of P until the rod is again parallel to the bench. Measure and . Repeat until you have six sets of values of and .
Record your results in a table. Include values of and in your table.
Answer
Record six sets of readings of and (to nearest ), and calculate and for each set using
with and in metres and .
(Example of a correctly formatted table.)
| set | ||||
|---|---|---|---|---|
| 1 | 12.0 | 20.0 | 0.0589 | 0.137 |
| 2 | 15.0 | 23.0 | 0.0736 | 0.158 |
| 3 | 18.0 | 26.0 | 0.0883 | 0.179 |
| 4 | 21.0 | 29.0 | 0.103 | 0.199 |
| 5 | 24.0 | 32.0 | 0.118 | 0.220 |
| 6 | 27.0 | 35.0 | 0.132 | 0.240 |
See working (table of six sets of p, q with calculated TP and TQ)
Background Concept
In a practical investigation, marks for a results table usually come from presentation quality and correct processing, not from any single “correct” numerical value.
A good table:
- contains all raw and derived quantities needed later,
- has clear headings with quantity symbol / unit (e.g. ),
- uses consistent precision within a column,
- includes enough rows (here six sets) and a reasonable spread of the independent variable.
Understanding the Question
You must:
- move mass to a new position,
- adjust mass until the rod is again horizontal,
- measure and for that equilibrium,
- repeat until you have six pairs ,
- calculate and include and in the table.
Approach
- Decide on a range of positions for so that changes by a noticeable amount between trials.
- For each trial: set (choose ), then slide until the rod is horizontal, then measure and .
- Immediately compute and so you can spot anomalies while you still have the apparatus set up.
Step-by-Step Reasoning
- Collecting data
- Choose 6 different positions for (e.g. evenly spaced along the rod) to give a good range of .
- Each time you move , re-adjust until the rod is parallel to the bench (equilibrium condition).
- Measure and from the centre of each mass to the centre of the right-hand eye.
- Tabulating raw data
- Record and in cm to if using a mm scale.
- Keep the same number of decimal places down each column.
- Calculating and
- Convert and to metres before substitution.
- Use with .
- Record moments in , typically to 3 s.f. (or a consistent decimal place suitable for your data size).
Key Takeaways
- Six well-spread data points improve the reliability of the later graph.
- Correct headings (symbol and unit) and consistent precision are often the easiest marks to secure.
- Always include derived quantities needed for later parts (here and ).
Common Mistakes
- Missing units in headings (e.g. writing just instead of ).
- Mixing precisions (e.g. 12.0, 12.35, 12 in the same column).
- Forgetting to include and columns.
- Calculating and using cm instead of m.
Things to Be Careful About
- Don’t move the stands after initial set-up (your should remain constant for the investigation).
- Check that the rod is truly horizontal before reading and ; small tilts can shift the equilibrium point.
- If one reading looks inconsistent with the trend, repeat that trial rather than leaving an outlier unchecked.
Answer
Plot on the -axis against on the -axis.
- Label axes (horizontal) and (vertical).
- Use a suitable scale (at least half the grid in each direction).
- Plot all six points accurately.
Graph of TQ (y) against TP (x) plotted with labelled axes and suitable scales
Background Concept
A graph is used to reveal relationships between variables. Good graphing practice in Cambridge practical papers includes:
- axes labelled as “quantity / unit”,
- a sensible linear scale that uses most of the grid,
- points plotted with small, neat crosses,
- and later (in part (ii)) a best-fit line.
Understanding the Question
You have a table containing values of and for six equilibrium positions. You must plot on the vertical axis and on the horizontal axis.
Approach
- Decide the min and max values of and from your table.
- Choose axis scales that comfortably include all values and use at least half the graph paper.
- Label axes with units.
- Plot each pair .
Step-by-Step Reasoning
- Read the range of and from your table.
- On the x-axis, mark a linear scale for that covers the full range.
- On the y-axis, mark a linear scale for that covers the full range.
- Label:
- x-axis:
- y-axis:
- Plot each of the six points using a sharp pencil; use small crosses (not large blobs).
Key Takeaways
- Correct axis choice and labelling is assessed.
- Scale choice affects how well you can later draw a best-fit line and read gradient/intercept.
Common Mistakes
- Swapping axes (plotting on and on ).
- Missing units on axes.
- Using an awkward scale (e.g. 1 big square = 3 units) that makes plotting inaccurate.
Things to Be Careful About
- Do not force the axes to start at zero unless it helps; choose what gives best spread and accuracy.
- Ensure you plot the processed values (, ), not the raw distances , .
Answer
Draw a single straight line of best fit through the plotted points, with points scattered roughly equally about the line.
Straight line of best fit drawn
Background Concept
A best-fit line represents the underlying trend in experimental data when random uncertainties cause scatter. For a linear relationship, you draw a straight line that best represents all points, not a point-to-point join.
Understanding the Question
After plotting the six points of against , you must draw the straight line that best fits the pattern.
Approach
- Use a ruler to draw one straight line.
- Aim for roughly equal numbers of points above and below the line (or equal overall deviation).
- Do not join dots.
Step-by-Step Reasoning
- Visually judge the overall trend of the points.
- Place a ruler so that the line passes centrally through the scatter.
- Adjust slightly to balance deviations (no systematic bias to one side).
- Draw a thin, single straight line across the range of your data.
Key Takeaways
- Best-fit line should reflect the overall trend, not pass through every point.
- A well-drawn line is essential for accurate gradient and intercept.
Common Mistakes
- Joining points with segments.
- Forcing the line through the origin without evidence.
- Drawing a line that passes through the first and last point even if it leaves most points on one side.
Things to Be Careful About
- If you suspect an anomaly, you should normally still draw the best-fit line through the main cluster; do not delete points unless clearly justified by a mistake in that reading.
Determine the gradient and -intercept of this line.
gradient = ______
-intercept = ______
Working
Using two well-separated points on the best-fit line (example):
-intercept read from graph (example):
Answer
gradient
-intercept
Example: gradient = 1.41, y-intercept = 5.5×10^-2 N m
Background Concept
For a straight-line graph of against :
- the gradient is
- the y-intercept is the value of when .
In this question, is and is , so the gradient has no units (because it is ), while the intercept has units of , i.e. .
Understanding the Question
You have already plotted vs and drawn a best-fit straight line. Now you must extract two numerical features of that line:
- its gradient,
- and its y-intercept.
These values are then used in part (d).
Approach
- Choose two points on the best-fit line that are far apart (to reduce percentage reading error).
- Read their coordinates .
- Compute gradient .
- Find y-intercept either by reading where the line crosses the y-axis or by using with a point on the line.
Step-by-Step Reasoning
- Pick two points on the line
Choose points near the ends of your drawn line (not necessarily data points), e.g.
- Point 1:
- Point 2:
- Calculate the gradient
Using widely spaced points makes and larger, so the same small ruler-reading error has a smaller effect on the final gradient.
- Find the y-intercept
- Either read the intersection of the line with the y-axis directly.
- Or use
with a point on the best-fit line.
Key Takeaways
- Gradient comes from the best-fit line, not from joining adjacent points.
- Use a large triangle to reduce uncertainty.
- Units: gradient is dimensionless here; y-intercept has units .
Common Mistakes
- Using two adjacent plotted points (gives a very uncertain gradient).
- Calculating gradient as instead of .
- Reading coordinates from the plotted points rather than from the best-fit line.
- Forgetting the y-intercept unit.
Things to Be Careful About
- Write enough significant figures consistent with graph-reading precision (often 2–3 s.f.).
- Ensure you use the same scale units as your axes when reading coordinates.
- If the line does not reach the y-axis, extend it carefully with a ruler before reading the intercept.
It is suggested that the quantities and are related by the equation
where and are constants.
Using your answers in (c)(iii), determine the values of and . Give appropriate units.
= ______
= ______
Working
Given
Comparing with for a graph of (y) against (x):
Answer
(no unit)
Example: A = 5.5×10^-2 N m, B = 1.41
Background Concept
If experimental data give a straight-line relationship, it can be written in the linear form
where:
- is the gradient,
- is the y-intercept.
Here the suggested theory is
which is already in the same structure, with playing the role of and playing the role of .
Understanding the Question
You have already found from the graph:
- the gradient,
- the y-intercept.
Now you must convert those graph features into the constants and and state appropriate units.
Approach
- Identify as the y-intercept because it is the value of when .
- Identify as the gradient because it multiplies .
- Assign units: must have the same units as ; is a ratio of to .
Step-by-Step Reasoning
- Compare:
with
- Therefore:
- y-intercept.
- gradient.
- Units:
- is a moment, so unit is , hence is in .
- is
so is dimensionless (no unit).
Key Takeaways
- Constants in a linear model come directly from intercept and gradient.
- Always check units: the additive constant has the same unit as the dependent variable.
Common Mistakes
- Swapping and .
- Giving units to when both axes have the same unit.
- Using raw data points instead of the best-fit line values.
Things to Be Careful About
- Quote and to a reasonable number of significant figures consistent with your graph readings.
- Ensure you use your (c)(iii) values, not recalculated values from a single data point.
Theory suggests that
where is the weight of the rod and has the value .
Use your answers in (a)(i) and (d)(i) to determine a value for . Give an appropriate unit.
= ______
Working
Using , with example values , , and :
Answer
Example: R = 1.71 N
Background Concept
The given theoretical relationship combines two ideas:
- resolving a force into a component using ,
- using a graph-derived constant (which has units of moment, ) together with a length to form a force term .
Dimensional check:
so the equation produces a force (weight) as required.
Understanding the Question
You are told:
with . You must use:
- and from part (a)(i),
- from part (d)(i),
to calculate , the weight of the rod.
Approach
- Convert into metres because is in .
- Compute .
- Compute .
- Subtract to obtain and give the unit .
Step-by-Step Reasoning
Using representative values (your values will be based on your own measurements and graph):
- Convert :
- Calculate the upward/vertical component term:
- Calculate the term involving :
- Substitute into the formula:
Key Takeaways
- Always make units consistent: moments in require lengths in metres when used in calculations.
- A constant obtained from a graph can be substituted into further theoretical expressions.
- Trigonometric components like are common when forces act at angles.
Common Mistakes
- Using in cm in the term (gives an answer wrong by a factor of 100).
- Using instead of .
- Forgetting the unit for (should be N, since it is a weight).
Things to Be Careful About
- Ensure your calculator is in degree mode when using .
- The final significant figures should reflect the precision of (from a graph) and (from a protractor); 2–3 s.f. is usually appropriate.
In this experiment, you will investigate the rolling of a plastic bottle.
You are provided with a plastic bottle with a cap, as shown in Fig. 2.1.
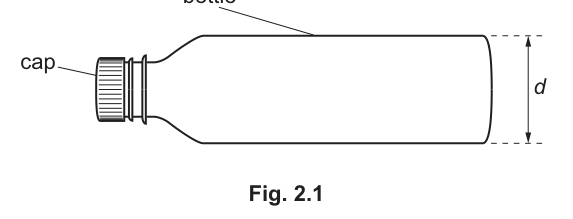
The diameter of the base of the bottle is .
Measure and record .
= ______
Answer
Measure the base diameter with a ruler (or calipers) and record to the nearest .
Example:
Example: d = 6.50 cm
Background Concept
In practical work, a measurement must be recorded with a precision that matches the instrument used. A metre rule typically has smallest divisions, so a length read from it is usually recorded to the nearest (i.e. ).
Understanding the Question
You are given a bottle and asked to measure the diameter of its circular base. This is a straightforward length measurement.
Approach
- Place the bottle so you can view the base clearly.
- Use a ruler (or calipers if available) across the widest part of the base.
- Read the scale with your eye directly above the mark to minimise parallax.
- Record to the correct resolution.
Step-by-Step Reasoning
- Align the zero of the ruler with one edge of the base.
- Read the position of the opposite edge.
- The diameter is the difference between these two readings.
- Record in to (or in to the nearest ).
A typical bottle might give, for example, .
Key Takeaways
- Match the recorded decimal places to the measuring instrument.
- Avoid parallax by reading the scale straight-on.
Common Mistakes
- Recording too many decimal places (e.g. from a ruler).
- Measuring a chord that is not the true diameter (not across the widest point).
- Parallax error from viewing the scale at an angle.
Things to Be Careful About
- Ensure the ruler is actually across the centre of the circular base.
- If the bottle base is not perfectly circular, note that the “diameter” may vary slightly depending on orientation; take the largest consistent value if instructed to measure the diameter.
Estimate the percentage uncertainty in your value of . Show your working.
percentage uncertainty = ______
Working
Using a ruler with divisions:
Example with :
Answer
0.8%
Background Concept
For a direct reading on an analogue scale (like a ruler), a common estimate of absolute uncertainty is half the smallest scale division.
Percentage uncertainty is defined by
Understanding the Question
You must estimate the percentage uncertainty in your measured diameter and show the working. The key is identifying the likely absolute uncertainty in from your measuring instrument.
Approach
- Decide the instrument used (usually a ruler with resolution).
- Convert the reading uncertainty into the same units as .
- Substitute into the percentage uncertainty formula.
Step-by-Step Reasoning
- If the smallest division is , the reading uncertainty is typically .
- Convert to the unit used for .
- Divide by and multiply by .
Example:
So a sensible quoted value is .
Key Takeaways
- Use half a scale division as the absolute uncertainty for a single analogue reading.
- Always convert to consistent units before calculating a percentage.
Common Mistakes
- Using instead of for a single reading.
- Mixing units (e.g. using with in without conversion).
- Writing an uncertainty with too many significant figures.
Things to Be Careful About
- If you measured by taking two ruler readings (one at each edge) and subtracting, some schemes allow a larger uncertainty (two readings). If not specified, the standard half-division approach is usually accepted in Paper 3, but be consistent with how you measured it.
Set up the apparatus as shown in Fig. 2.2.
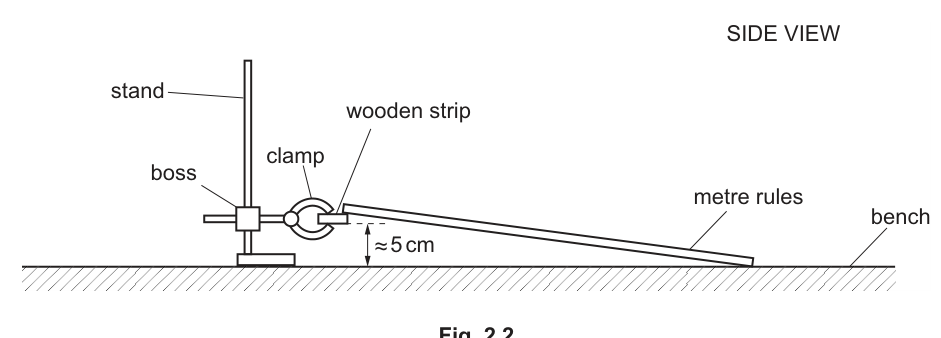
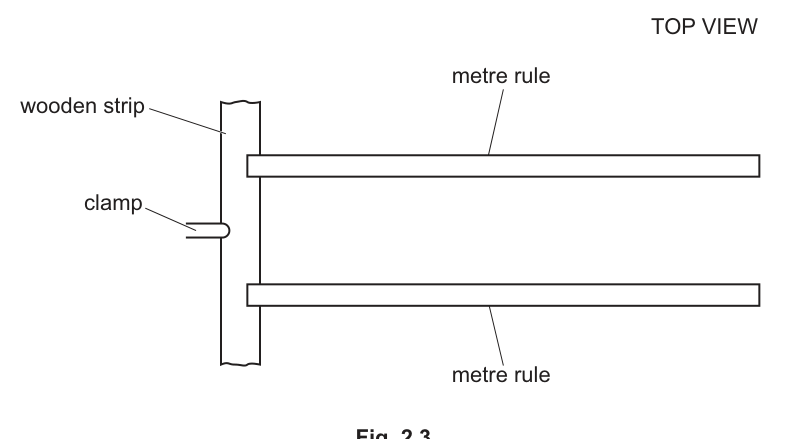
Adjust the two metre rules so that the rules are approximately parallel to each other, as shown in Fig. 2.3.
Pour all the water from the beaker into the bottle.
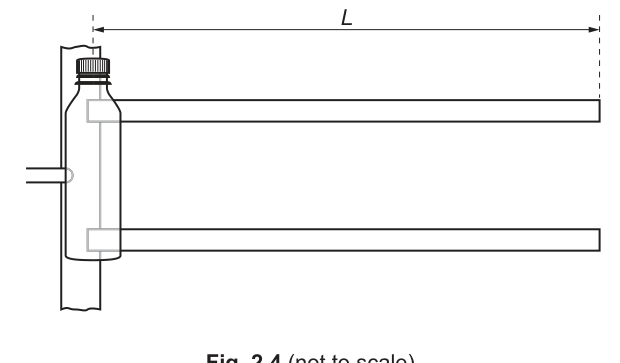
Place the bottle on the two rules as shown in Fig. 2.4.
Release the bottle. Adjust the rules so that the bottle rolls to the end of the rules.
The distance that the bottle rolls on the rules is , as shown in Fig. 2.4.
Measure and record .
= ______
Answer
Measure the distance rolled along the rules and record to the nearest .
Example:
Example: L = 80.0 cm
Background Concept
In Paper 3, marks for a measurement usually depend on (i) recording a plausible value and (ii) recording it to an appropriate precision for the instrument.
Understanding the Question
After setting up the two metre rules as a track, you must measure the distance that the bottle rolls along the rules (from the release point to the end position indicated).
Approach
- Adjust the rules so the bottle rolls smoothly to the end.
- Identify clearly where the bottle starts and where it stops.
- Measure the distance between these points with the metre rule.
- Record with correct precision.
Step-by-Step Reasoning
- Use a fixed reference point on the bottle for start/end (e.g. the same point on the base touching the rule).
- Mark the start position with a small piece of tape or pencil mark on the rule.
- After the roll, mark the end position similarly.
- Measure between marks and record to (or ).
Example: .
Key Takeaways
- Define start and end points consistently.
- Mark positions to improve repeatability.
Common Mistakes
- Measuring from the wrong end of the rules (not the start position shown).
- Recording to an unrealistic precision.
- Allowing the bottle to fall off early; then is not the intended distance.
Things to Be Careful About
- Ensure the rules are approximately parallel and stable; if they move between runs, may change.
- Read the scale without parallax and keep the ruler aligned with the track direction.
Stand the bottle upright on the bench.
The height of the water in the bottle is , as shown in Fig. 2.5.
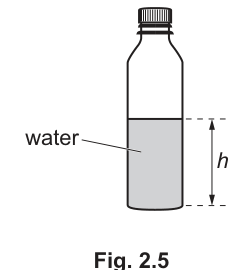
Measure and record .
= ______
The time for the bottle to roll distance on the rules is .
Take measurements to determine .
= ______
Working
Measure to the nearest .
Example:
Determine by timing the roll over distance several times and taking a mean.
Example timings: , ,
Answer
Example: h = 10.0 cm, t = 2.30 s
Background Concept
Two key practical skills are being assessed:
- Measuring a height of a liquid column: the main uncertainty is parallax and judging the level/meniscus.
- Measuring a time interval : the main uncertainty is reaction time. Repeating readings and taking a mean improves reliability and helps identify anomalies.
Understanding the Question
You must:
- Stand the bottle upright and measure the water height (as in Fig. 2.5).
- Measure the time taken for the bottle to roll the previously-measured distance along the rules.
Both and will be used later to calculate acceleration and then the constant .
Approach
- For : use a ruler alongside the bottle, read the level at eye height.
- For : use a stopwatch, but reduce random error by repeating the timing several times and averaging.
Step-by-Step Reasoning
Measuring
- Put the bottle on a flat bench.
- Place a ruler next to the bottle with the zero at the base level.
- Look horizontally at the water level (eye at the same height as the surface) to avoid parallax.
- Record to (so usually as ).
Measuring
- Mark the start position and the end position (so you start/stop the timing at the same points each run).
- Release the bottle without pushing.
- Start the stopwatch as the bottle begins rolling and stop it when it reaches the end point.
- Repeat at least 3 times and calculate the mean time.
Example:
- times , , , mean .
Key Takeaways
- Repeat timings to improve reliability.
- Parallax is a major issue for reading liquid levels.
Common Mistakes
- Only taking one timing and not averaging.
- Starting timing before releasing or after the bottle has already moved.
- Measuring with the ruler not aligned to the base level.
Things to Be Careful About
- Water can slosh if the bottle is moved; allow it to settle before measuring .
- Use the same start/end reference each time; otherwise the time corresponds to a different distance.
- If one timing is clearly anomalous, repeat rather than averaging it in without question.
Working
Using .
Example with and :
Answer
0.303 m s^-2
Background Concept
If an object starts from rest and moves with constant acceleration over distance in time , then
Rearranging gives
In this experiment, the given formula is used as a working model for the bottle’s motion along the rules.
Understanding the Question
You are given the equation for in terms of your measured and and asked to calculate . The key practical point is using consistent units (preferably SI).
Approach
- Convert into metres.
- Substitute and into .
- Calculate and present the result with appropriate significant figures and unit .
Step-by-Step Reasoning
Using the example values:
Compute :
Then
Key Takeaways
- Always convert to SI before substituting into kinematics-style equations.
- Keep the unit of acceleration as .
Common Mistakes
- Using in and still writing the unit as .
- Forgetting to square the time.
- Writing or other rearrangement errors.
Things to Be Careful About
- Ensure your calculator brackets include the whole in the denominator.
- If your has been averaged, use the averaged value consistently.
Answer
is calculated from and .
is recorded to (e.g. ) and to (e.g. ), so is given to .
a quoted to 3 s.f., limited by L and t.
Background Concept
A calculated quantity should not be quoted to more significant figures than are justified by the precision of the measurements used to calculate it. For multiplication/division (and powers), the significant figures in the result are limited by the least precise input (in significant-figure terms).
Understanding the Question
You must justify the number of significant figures used for in part (c)(ii). That means referring to how precisely and were measured/recorded.
Approach
- Identify the significant figures of and as recorded.
- State that since depends on both, should be quoted to the same (or fewer) significant figures as the least precise of and .
Step-by-Step Reasoning
Example:
- If , that is .
- If (mean time), that is .
So should be given to (e.g. ).
If your time is only recorded to (e.g. ), then should be quoted to .
Key Takeaways
- Quote calculated results to a precision justified by raw measurements.
- Time measurements often limit precision in mechanics experiments.
Common Mistakes
- Giving to many decimal places just because the calculator displays them.
- Justifying based on the number of decimal places instead of significant figures.
- Ignoring that is squared (it can strongly affect the uncertainty), though the sig-fig rule still follows the recorded precision.
Things to Be Careful About
- Be consistent: if you record as , don’t later treat it as if it were .
- If is a mean, you should still record it to a sensible precision based on stopwatch resolution and spread of repeats (don’t overstate precision).
Pour approximately half the water from the bottle into the beaker.
Repeat (c)(i) and (c)(ii).
= ______
= ______
= ______
Working
After pouring out about half the water, repeat the measurements and calculation.
Example:
Mean time (example):
With :
Answer
Example: h = 5.0 cm, t = 2.70 s, a = 0.219 m s^-2
Background Concept
To test a suggested relationship involving and , you need more than one data set. Changing the amount of water changes ; repeating the procedure gives a second value of to compare.
Understanding the Question
You must remove about half the water, then repeat the measurements of and and recalculate using the same (unless was changed).
Approach
- Keep the apparatus arrangement the same as before (rules separation, slope, and ).
- Measure the new water height .
- Time the roll several times again and compute the mean .
- Calculate from .
Step-by-Step Reasoning
Example (illustrative):
- New height: .
- Mean time: .
- Use the same as before, converted into metres.
Then
Substituting and :
Key Takeaways
- Repeating the experiment with a changed condition provides additional data.
- Keep all other variables as constant as possible when testing a relationship.
Common Mistakes
- Changing the spacing/angle of the rules unintentionally between runs (this changes the motion for reasons unrelated to ).
- Not re-measuring after pouring out water.
- Using a single timing for the second run.
Things to Be Careful About
- Ensure “approximately half” is not wildly different each attempt; the important thing is that is clearly different and measured accurately.
- Let the water settle before measuring and before releasing the bottle.
It is suggested that the relationship between and is
where is a constant.
Using your data, calculate two values of .
first value of = ______
second value of = ______
Working
From
Example using .
First set: ,
Second set: ,
Answer
First value of
Second value of
Example: k ≈ 16.6 and 17.0
Background Concept
When a relationship contains an unknown constant (here ), you can use experimental measurements to evaluate it by rearranging the equation.
Given
solve for :
To test whether is constant, calculate it for different values of and see if the results agree within uncertainty.
Understanding the Question
You have two sets of measured data (one with more water, one with about half). Using each set, calculate a value of . If the suggested model is correct, the two values should be similar.
Approach
- Rearrange the given equation to make the subject.
- Convert and to metres and use in .
- Calculate twice (once per data set).
Step-by-Step Reasoning
Using the example measurements:
- .
Data set 1
- , .
Compute the square-root factor:
Then
Data set 2
- , .
The two values are close, suggesting is approximately constant.
Key Takeaways
- Rearranging a model lets you compute a constant from experimental results.
- Using consistent SI units avoids hidden scaling errors.
Common Mistakes
- Forgetting the factor of in the rearrangement.
- Using in inside while using in .
- Calculating only one value of instead of two.
Things to Be Careful About
- Keep enough significant figures in intermediate steps (especially square roots) to avoid rounding too early.
- If you include units for , be consistent; however, many mark schemes for Paper 3 mainly credit correct numerical evaluation and consistency between the two values.
It is suggested that the percentage uncertainty in the values of is .
Using this uncertainty, explain whether your results support the relationship in (e).
Working
Example values: , .
Percentage difference (using mean):
Since , the values agree within uncertainty.
Answer
Yes. The two values of are consistent within , so the results support the relationship.
Yes, k values agree within 15% so relationship is supported.
Background Concept
To judge whether results support a suggested relationship, you compare measured/derived values against the experimental uncertainty.
If two values are supposed to be the same (here should be constant), they are considered consistent if their difference is not larger than the stated uncertainty level.
Understanding the Question
You are told the percentage uncertainty in is . Using that, you must decide whether your two calculated values of support the model in (e). This is essentially a consistency check.
Approach
- Calculate how different the two values are (a percentage difference is a clear method).
- Compare this difference to .
- If the difference is less than (or comparable to) , conclude the results support the relationship.
Step-by-Step Reasoning
Using illustrative values and :
Difference:
A sensible percentage difference is relative to the mean:
Because is much less than , the two values agree within the stated uncertainty. Therefore the results support the relationship.
Key Takeaways
- Use uncertainty to decide whether differences are meaningful.
- A relationship is supported if derived constants are consistent within experimental uncertainty.
Common Mistakes
- Stating “they are close” with no reference to the uncertainty.
- Using an incorrect percentage calculation (e.g. dividing by the larger value without explanation).
- Concluding the relationship is wrong just because the values are not identical (experimental data never match perfectly).
Things to Be Careful About
- Make sure you are comparing like with like (both values calculated using consistent units and methods).
- If your two values differ by more than , you should conclude the results do not support the model (or are inconclusive), not try to force agreement.
Describe four sources of uncertainty or limitations of the procedure for this experiment.
For any uncertainties in measurement that you describe, you should state the quantity being measured and a reason for the uncertainty.
Answer
- Timing : stopwatch reaction time when starting/stopping; hard to judge the exact instant the bottle starts moving and reaches the end.
- Distance : difficulty defining the exact start/end position of the bottle (which part of the bottle is the reference), so may not be measured consistently.
- Height : parallax / unclear water level (meniscus) when reading on the bottle, especially if the bottle is not perfectly vertical.
- Motion not perfectly repeatable: rules may not be exactly parallel / surface friction varies, so the bottle may wobble or rub a rule, changing the acceleration between runs.
Four limitations listed (timing, L definition, h reading, repeatability due to alignment/friction).
Background Concept
Experimental uncertainty comes from:
- Instrument limits (resolution of ruler/stopwatch)
- Human factors (reaction time, judgement)
- Systematic effects (misalignment, friction, changing conditions)
Good evaluation statements identify the measured quantity and explain why it is uncertain or why the method is limited.
Understanding the Question
You must describe four sources of uncertainty or limitations. For any measurement uncertainty you mention, you must name the quantity (e.g. , , ) and give a reason.
Approach
Choose distinct points covering different parts of the experiment:
- timing the motion
- measuring distances/heights
- repeatability of the run (track alignment, friction)
- any physical effect that violates assumptions (e.g. sloshing water)
State each one clearly as a separate bullet.
Step-by-Step Reasoning
Examples of creditworthy limitations:
- Timing uncertainty (): manual stopwatch timing introduces reaction time (random error) and ambiguity of when the bottle starts/finishes.
- Distance uncertainty (): the bottle is not a point object; if you don’t always measure from the same reference point on the bottle, changes. Also, the end position may not be sharply defined.
- Water height uncertainty (): the water surface may not be perfectly level, and the meniscus is hard to judge through curved plastic; parallax occurs if not viewed at eye level.
- Non-repeatable rolling: if the rules are not exactly parallel or have uneven surfaces, the bottle can drift and rub, changing resistive forces; this affects the acceleration and therefore the derived and .
Other acceptable limitations (if kept distinct) could include:
- water moving inside the bottle during rolling (changing mass distribution)
- small changes in slope/track geometry between runs
- bottle slipping rather than rolling without slipping
Key Takeaways
- Link uncertainties to specific measured quantities.
- Give physical reasons, not just “human error”.
Common Mistakes
- Writing vague statements like “parallax error” without saying which reading (e.g. or ).
- Repeating the same idea four times (e.g. “reaction time” for everything).
- Listing improvements instead of limitations.
Things to Be Careful About
- Make sure you give four distinct sources.
- For measurement uncertainties, always include quantity + reason (e.g. “ because reaction time”).
Describe four improvements that could be made to this experiment. You may suggest the use of other apparatus or different procedures.
Answer
- Measure using light gates / motion sensor / video analysis instead of a stopwatch to remove reaction time.
- Use a fixed release mechanism (e.g. a clamp/stop at the start) so the bottle is released from the same position without an initial push.
- Fix the rules with clamps/spacers so they are truly parallel and do not move; keep the separation constant for all runs.
- Increase reliability by repeating each timing several times (and/or using a longer ) and taking a mean to reduce random error.
Four improvements listed (automatic timing, controlled release, fixed parallel rules, repeats/longer L).
Background Concept
Improvements should directly reduce uncertainties or remove limitations. Strong improvement statements:
- specify what to change
- explain what uncertainty it reduces
Common categories: better instruments, better control of variables, more repeats, and improved geometry/alignment.
Understanding the Question
You must describe four improvements (apparatus and/or procedure) to make the experiment more accurate/reliable.
Approach
Take the limitations from (g)(i) and propose one improvement for each. Ensure all four are different.
Step-by-Step Reasoning
Examples:
- Replace stopwatch timing with light gates or video tracking. This removes reaction time and gives a clearer definition of start/finish time.
- Standardise the release: use a rigid stop at the start and lift it away quickly, or a simple gate mechanism. This avoids giving the bottle an extra push and keeps the start position fixed.
- Maintain track geometry: clamp the metre rules and use spacers to keep them parallel and at constant separation; this improves repeatability and reduces rubbing/wobbling.
- More data / better averaging: repeat each run many times and calculate a mean (and possibly exclude anomalies). Alternatively, increase so that the same reaction time produces a smaller percentage error in .
Other possible improvements (if needed):
- Use a set square/vertical reference to measure more accurately.
- Mark the start/end points on the rules for consistent .
- Use a smoother track surface to reduce variable friction.
Key Takeaways
- Improvements should clearly target the dominant uncertainties (often timing and repeatability).
- Standardising start conditions improves reliability.
Common Mistakes
- Suggesting vague improvements like “be more careful”.
- Giving an improvement that does not address any stated limitation.
- Repeating the same idea in different words (e.g. “do more repeats” four times).
Things to Be Careful About
- Provide exactly four distinct improvements.
- Include enough detail so the improvement is actually implementable in a school laboratory.