Physics 9702/33 — February/March 2025
Cambridge AS Level · Advanced Practical Skills · worked solutions for every part, with the mark scheme
Topics Manipulation, Measurement and Observation · Presentation of Data and Observations · Analysis, Conclusions and Evaluation
In this experiment, you will investigate an electrical circuit.
• Connect the circuit shown in Fig. 1.1.
E, F, G and H are crocodile clips.
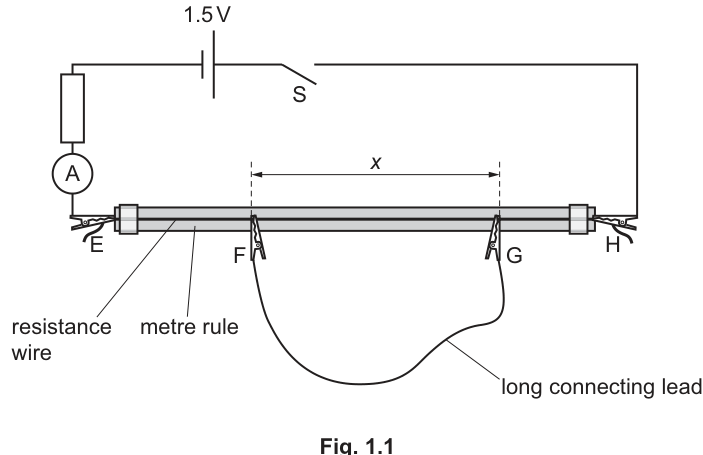
• Using the long connecting lead, clip crocodile clips F and G on the resistance wire so that they are approximately apart.
• The length of resistance wire between F and G is .
Measure and record .
= ______
• The current in the circuit is .
Close S and record .
= ______
• Open S.
Answer
Example readings (student-dependent):
See working (student-dependent)
Background Concept
In a simple d.c. circuit, the ammeter measures the current flowing in series. The length of resistance wire included in the circuit affects the total resistance, so changing a length on the wire can change the current.
A metre rule is used to measure the separation between two clip positions along the wire. The key practical skills here are:
- making a clear, parallax-free length measurement,
- ensuring the ammeter is in series and reads steadily,
- recording values with appropriate precision and units.
Understanding the Question
You are asked to:
- set up the circuit of Fig. 1.1,
- set clips and about apart,
- measure and record the wire length between them, (in ),
- close the switch and record the current (in ), then open the switch.
The actual numerical values depend on your apparatus, so the mark is for correct measurement technique, sensible values, and correct recording (unit, precision).
Approach
- Build the circuit exactly as in the figure.
- Place and on the wire and measure their separation using the metre rule scale.
- Close switch briefly, wait for the ammeter reading to settle, and record .
- Open to prevent heating of the wire (which would change its resistance).
Step-by-Step Reasoning
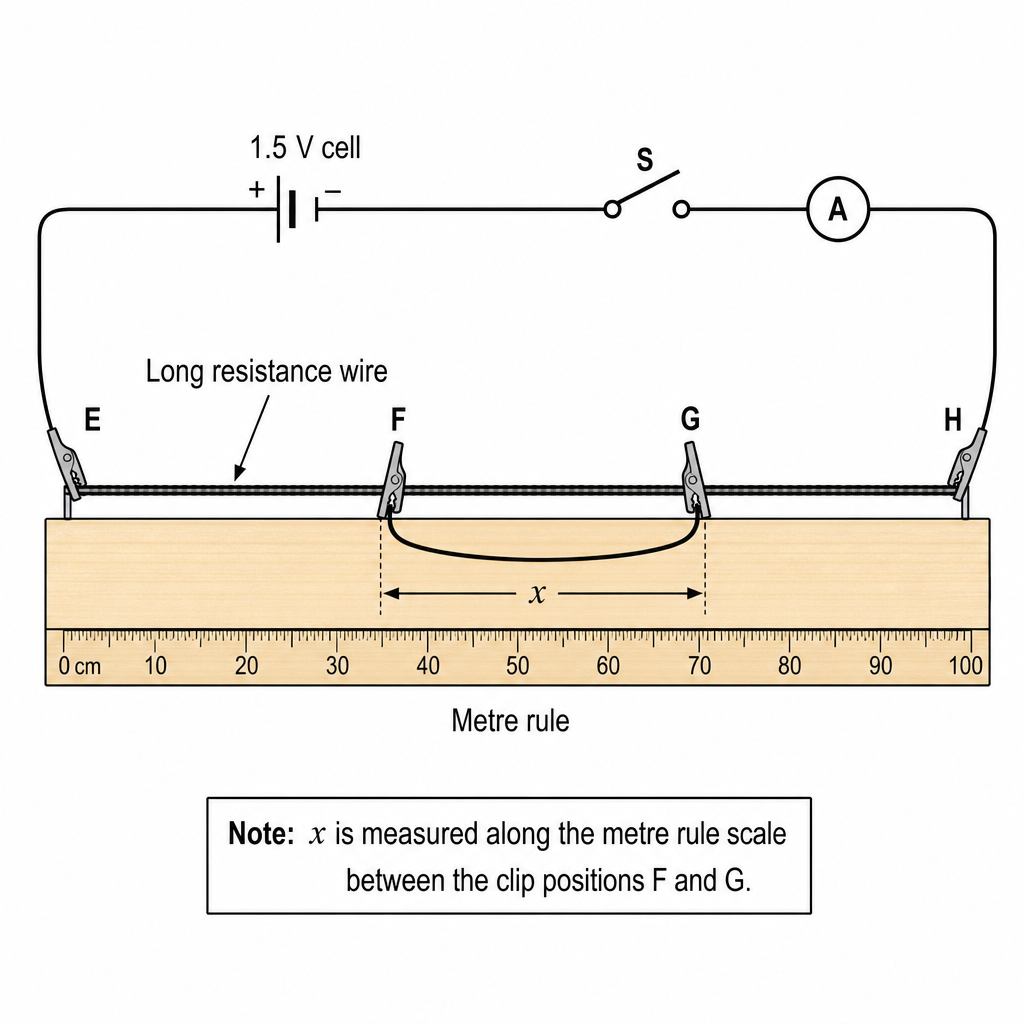
- Set up: Ensure the cell, switch , and ammeter are all in series with the resistance wire.
- Set : Move crocodile clips and so they are roughly apart.
- Measure : Read positions of and on the metre rule and calculate as the difference. Record to a sensible precision (e.g. or depending on how well you can align the clip).
- Measure : Close , let the current settle, record (typically to or depending on meter resolution), then open .
Key Takeaways
- Measure lengths using end readings on a scale and take the difference.
- Ammeter must be in series; record with unit .
- Keep switch closed only briefly to reduce heating.
Common Mistakes
- Measuring from the end of the wire instead of between and .
- Recording without units or in when the answer space expects .
- Leaving the switch closed for long periods so the wire heats up and drifts.
Things to Be Careful About
- Avoid parallax when reading the metre rule.
- Ensure crocodile clips make good electrical contact (otherwise may be unstable).
- Record and to consistent, sensible precision that matches your instruments.
Change and record and .
Repeat until you have six sets of values of and .
Record your results in a table. Include values of in your table.
Answer
Record six pairs of and , and calculate .
Example of a suitable table (values are illustrative):
| 0.10 | 0.200 | 5.00 |
| 0.20 | 0.238 | 4.20 |
| 0.30 | 0.286 | 3.50 |
| 0.40 | 0.357 | 2.80 |
| 0.50 | 0.435 | 2.30 |
| 0.60 | 0.556 | 1.80 |
See working (student-dependent)
Background Concept
When investigating a relationship experimentally, you choose an independent variable (here ) and measure a dependent variable (here ). To test a proposed linear model of the form
you must calculate for each measured current and present the results clearly.
Good data-handling practice in Paper 3 includes:
- a suitable range of values,
- six sets of readings (as requested),
- clear table headings with quantity and unit,
- consistent precision in each column,
- correct calculation of derived quantities.
Understanding the Question
You must change several times and, each time, measure . You then make a results table containing:
- (in ),
- (in ),
- (in ),
for six different values of .
Approach
- Choose six different values of spread across a wide practical range (not all clustered near ).
- For each , close the switch briefly, record , then open the switch.
- Compute for each row.
- Build one clear table with correct headings and units.
Step-by-Step Reasoning
- Choosing values: pick values that are well separated (e.g. steps of to ), staying within the wire length.
- Taking readings: for each , close switch briefly and wait for a steady ammeter reading. Open after recording to limit heating.
- Repeat/quality: if one reading looks anomalous or unstable, repeat it immediately; keep contact points clean and firm.
- Calculating : for each measured current, compute
and record it to consistent significant figures (typically matching the precision of ).
5) Table presentation: include units in the headings (not in the body). Use consistent decimal places within each column where reasonable.
Key Takeaways
- Six well-spaced readings improve the reliability of the graph.
- Derived quantities must be calculated correctly and presented with units.
- Consistent precision and clear headings are essential for marks.
Common Mistakes
- Missing the column or giving it without unit .
- Writing units in every cell instead of in the heading.
- Using too narrow a range of (gives a poor graph and uncertain gradient).
- Inconsistent precision (e.g. mixing with without justification).
Things to Be Careful About
- Do not let the wire heat up (it changes resistance and therefore changes ).
- Ensure is not so large that it exceeds the ammeter range.
- If is very small, becomes very large and uncertainties become significant; choose so readings remain sensible.
Answer
Plot on the -axis (unit ) against on the -axis (unit ) using a suitable scale and all six data points.
Graph plotted
Background Concept
A graph is used to reveal and test relationships between quantities. If the suggested model is
then a plot of against should produce a straight line.
Marks are typically awarded for:
- correct axes (right variables on the right axes),
- correct labels including units,
- sensible scales (not cramped; not awkward like 3 squares = 0.07),
- accurate plotting of all points.
Understanding the Question
You must use your table from (b) and create a graph with:
- horizontal axis: (in ),
- vertical axis: (in ).
Approach
- Decide the minimum and maximum of your and data.
- Choose scales that spread the data over at least half of the graph paper in both directions.
- Label axes as and (or equivalent clear labelling).
- Plot each point with a small, neat cross.
Step-by-Step Reasoning
- From the table, identify the range of and .
- Mark a scale along each axis that covers the full range.
- Add axis labels with units.
- Plot each pair carefully; do not join dots.
Key Takeaways
- The variables on the axes must match the instruction.
- Labels must include units.
- Good scaling and accurate points reduce uncertainty in the gradient.
Common Mistakes
- Plotting instead of .
- Missing units on axes.
- Using a tiny section of the grid (poor scale choice).
- Plotting blobs too large to judge accuracy.
Things to Be Careful About
- Check that you have not inverted a value incorrectly (e.g. using ).
- Ensure each plotted point corresponds to the correct row of the table.
Answer
Draw one straight line of best fit through the plotted points (balanced so there are roughly equal numbers of points on each side).
Best-fit line drawn
Background Concept
Experimental points rarely lie exactly on a straight line due to measurement uncertainty. A best-fit line is drawn to represent the overall trend predicted by a model.
Understanding the Question
After plotting the six points, you must draw a straight line that best represents the relationship between and .
Approach
- Use a ruler.
- Aim for a line that passes as close as possible to all points.
- Do not force the line through the origin unless the data and theory demand it.
Step-by-Step Reasoning
- Visually judge the trend of the plotted points.
- Place the ruler so that the line leaves a similar scatter above and below.
- Draw a single thin straight line.
Key Takeaways
- Best-fit means balanced scatter, not join-the-dots.
Common Mistakes
- Connecting points one by one.
- Forcing the line through the origin without justification.
- Drawing a thick line that makes intercept/gradient hard to read.
Things to Be Careful About
- If there is an anomalous point, do not bend the line to reach it; still draw the best overall straight line.
Determine the gradient and -intercept of this line.
gradient = ______
-intercept = ______
Working
Choose two well-separated points on the best-fit line, e.g.
Read the -intercept from the graph:
Answer
Gradient
-intercept
Gradient = -6.36 A^-1 m^-1, y-intercept = 5.64 A^-1 (illustrative)
Background Concept
For a straight-line graph, the gradient (slope) is
and the -intercept is the value of when (where the line crosses the -axis).
Here:
- with unit ,
- has unit ,
so the gradient unit must be .
Understanding the Question
You must extract two numerical features from your best-fit line:
- its gradient,
- its -intercept.
These are then used later to find constants and .
Approach
- Use two points on the best-fit line (not necessarily measured points).
- Make the points as far apart as possible to reduce percentage uncertainty.
- Compute .
- Read the intercept by extending the line to the -axis and reading the value.
Step-by-Step Reasoning
- Select two points: pick grid intersections where you can read and accurately.
- Calculate gradient:
Check that is in and in .
3) Find -intercept: find where the line crosses the -axis (). If the intercept is off the graph, extend the line carefully.
4) Units: gradient ; intercept .
Key Takeaways
- Use a large triangle on the line for an accurate gradient.
- Gradient is always , never .
- Units come directly from the axes.
Common Mistakes
- Using two experimental points rather than points on the best-fit line.
- Choosing points too close together (large uncertainty).
- Getting the sign wrong: if the line slopes downwards, gradient is negative.
- Forgetting units or using the wrong ones.
Things to Be Careful About
- Read values to the precision allowed by the graph scale.
- Make sure you identify as , not .
- If you extend the line, keep the ruler aligned with the original best-fit line.
It is suggested that the quantities and are related by
where and are constants.
Using your answers in (c)(iii), determine the values of and .
Give appropriate units.
= ______
= ______
Working
For the graph of against :
So
Using (c)(iii):
Answer
a = gradient, b = y-intercept (with units)
Background Concept
A straight-line graph has form
where is the gradient and is the intercept on the -axis.
In this experiment, the suggested relationship is
Comparing directly:
- ,
- ,
- .
Units:
- has unit ,
- has unit ,
therefore
Understanding the Question
You are not asked to re-plot anything. You simply use your gradient and intercept from (c)(iii) to state and , including appropriate units.
Approach
- Set equal to the gradient.
- Set equal to the -intercept.
- Attach units based on the graph axes.
Step-by-Step Reasoning
- Write the linear model and compare with .
- Replace with your measured gradient and with your intercept.
- Confirm units are consistent with axis units.
Key Takeaways
- Straight-line identification: gradient coefficient of ; intercept constant term.
- Units come from the variables plotted.
Common Mistakes
- Swapping and .
- Quoting without the .
- Using the gradient of the wrong graph (e.g. if axes were swapped).
Things to Be Careful About
- Keep the sign of (negative if the line slopes downward).
- Ensure is read at (not at your smallest measured ).
Theory suggests that
where is the resistance per unit length of the resistance wire and is .
Use your value of to calculate the value of .
= ______
Working
Given
so
With and :
Answer
P = 9.54 Ω m^-1 (illustrative)
Background Concept
The gradient of a suitable graph can be linked to a physical constant. Here, theory gives
where:
- is resistance per unit length of the wire (),
- is a voltage ().
Because , multiplying (unit ) by (unit ) gives , as required.
Understanding the Question
You must use your experimental value of (from the graph) and the known value to calculate .
Approach
Rearrange the theoretical equation to make the subject:
Then substitute your value of and .
Step-by-Step Reasoning
- Start with
- Multiply both sides by :
- Multiply by :
- Substitute values, keeping the sign correct (if is negative, comes out positive).
- Quote with unit .
Key Takeaways
- Always rearrange carefully and track negative signs.
- Check units: .
Common Mistakes
- Forgetting the minus sign and getting a negative .
- Using without units and then writing an incorrect unit for .
- Using instead of .
Things to Be Careful About
- Use your own measured from (d), not the illustrative value shown here.
- Use a sensible number of significant figures (often matching the precision of the gradient from the graph).
In this experiment, you will investigate the thermal properties of plastic pipe.
• You are provided with two lengths of plastic pipe.
• Select one of them and, using the waterproof pen, label one end A.
• Make a mark approximately from end A, as shown in Fig. 2.1.
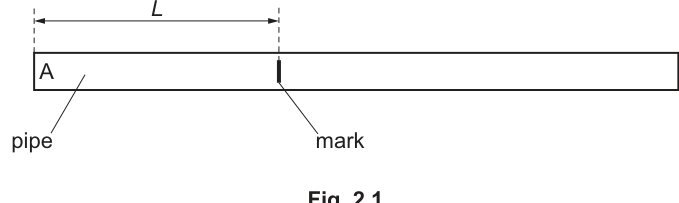
• The distance from end A to the mark is , as shown in Fig. 2.1.
Measure and record .
= ______
• Use the thermometer to measure the room temperature .
Record .
= ______
Answer
measured with a ruler to the nearest (example):
Room temperature (example):
Example readings: L = 12.0 cm, T0 = 25.0 °C
Background Concept
In Paper 3, marks for measurements are awarded mainly for good technique and appropriate recording. A length should be measured with a suitable instrument (e.g. a metre rule) and recorded to a precision consistent with the smallest scale division. A temperature should be measured with the thermometer provided and recorded with a sensible resolution (often or depending on the scale).
Understanding the Question
You must (1) mark a point about from end A, then measure the actual distance from end A to the mark (this is ), and (2) measure the room temperature . These are raw measurements used later to test the proposed relationship.
Approach
- Measure along the pipe from the end face at A to the drawn mark.
- Measure with the thermometer at room conditions.
- Record both with units and appropriate precision.
Step-by-Step Reasoning
- Place the ruler alongside the pipe so the zero is aligned with end A (or measure between two clear reference points if the end cannot be aligned exactly).
- Read the position of the mark at eye level to reduce parallax; record to the nearest small division (commonly ).
- For , ensure the thermometer bulb is in air (not touching your hand or a warm surface), wait for the reading to stabilise, and read at eye level.
- Record with the unit .
Key Takeaways
- Raw readings must be recorded clearly, with units and appropriate precision.
- Parallax and poor alignment are common causes of systematic error in length measurements.
Common Mistakes
- Measuring from the wrong end (not from end A).
- Writing with no unit or an unrealistic precision (e.g. ).
- Reading the ruler/thermometer at an angle (parallax).
Things to Be Careful About
- The mark is “approximately” : you must measure the actual you made, not assume .
- Ensure the reference is the end face at A (not the start of a label line drawn on the pipe).
• Set up the apparatus as shown in Fig. 2.2.
The point Z is the lower edge of the end of the wooden strip.
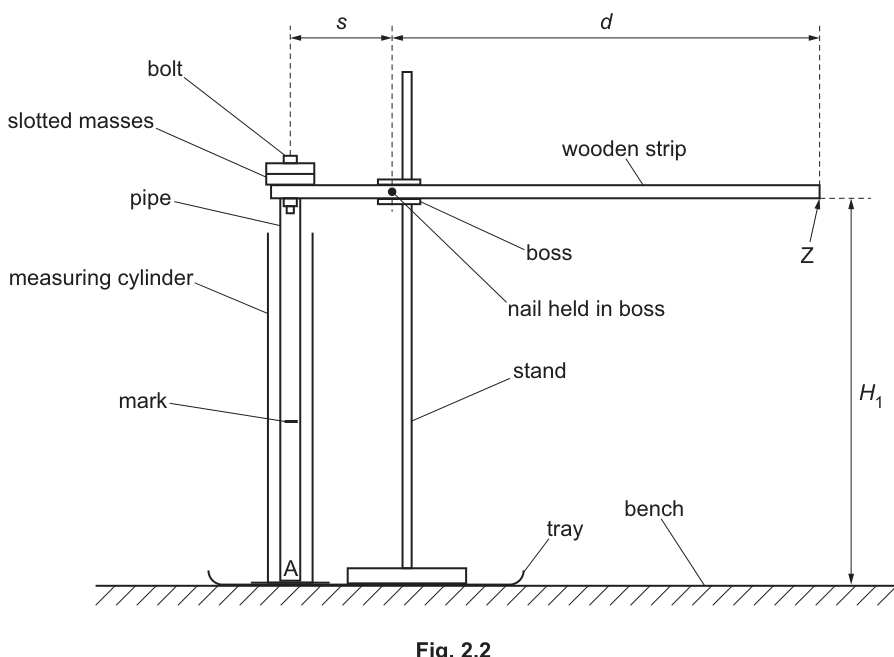
• Ensure that end A is at the bottom of the measuring cylinder.
• The distance between the centre of the bolt and the centre of the nail is .
The distance between the centre of the nail and the end of the wooden strip is , as shown in Fig. 2.2.
• Measure and record and .
= ______
= ______
Answer
Measure between the stated centres (example readings):
Example readings: s = 7.5 cm, d = 22.5 cm
Background Concept
This set-up uses a wooden strip as a lever about the nail (pivot). The distances and are lever arms measured from the pivot to (i) the bolt connection and (ii) the end point Z. Because the later calculation uses a ratio , identifying the correct reference points (centres) is essential.
Understanding the Question
You are told:
- is the distance between the centre of the bolt and the centre of the nail.
- is the distance between the centre of the nail and the end of the wooden strip (point Z).
You must measure and record and .
Approach
- Use the diagram to identify the nail (pivot), the bolt (where the pipe is attached), and point Z (the lower edge of the strip end).
- Measure centre-to-centre distances with a ruler, keeping the ruler parallel to the strip.
Step-by-Step Reasoning
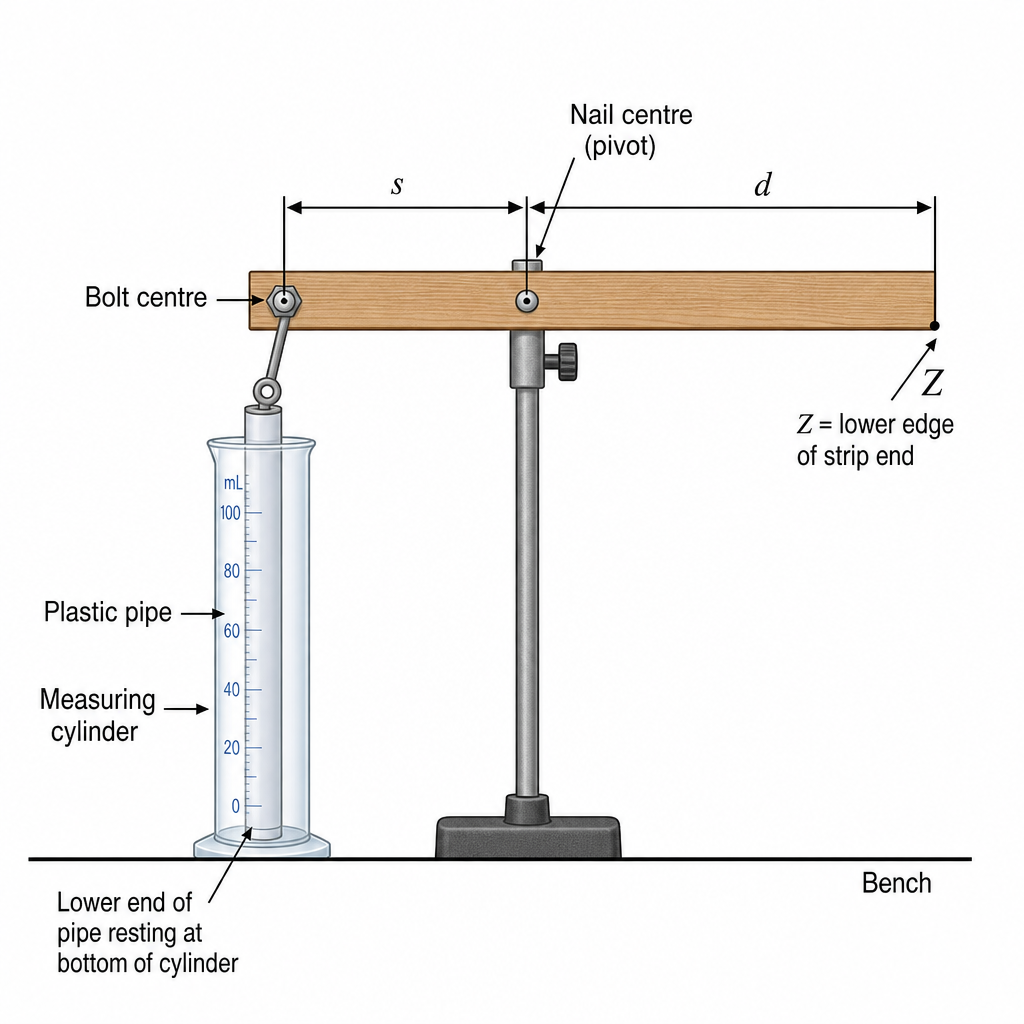
- Locate the nail: it passes through the wooden strip and is held in a boss (this is the pivot).
- Locate the bolt: it is fixed to the strip and connects to the pipe/masses.
- Measure along the strip from the centre of the nail to the centre of the bolt.
- Identify Z as the lower edge at the end of the strip and measure from the nail centre to Z along the strip.
- Record both distances in to a consistent precision (typically ).
Key Takeaways
- Always measure the quantity exactly as defined (centre-to-centre here).
- Lever problems are sensitive to the correct lever arm lengths.
Common Mistakes
- Measuring to the edge of the nail/bolt rather than the centre.
- Measuring to the wrong end of the strip (not to point Z).
- Measuring off the strip (diagonal measurement) rather than along the line of the strip.
Things to Be Careful About
- If the nail or bolt head obscures the centre, estimate the centre by measuring diameter and halving, or use the apparent midpoint.
- Keep the strip still while measuring to reduce random error.
• The distance from the bench to Z is , as shown in Fig. 2.2.
Measure and record .
= ______
• Slowly and carefully pour very hot water into the measuring cylinder until the water level reaches the mark on the pipe.
The distance between the bench and Z will change. When Z reaches its lowest position the new distance from the bench to Z is .
Measure and record .
= ______
• The temperature of the water in the measuring cylinder is .
Measure and record .
= ______
Answer
Example readings:
Example readings: H1 = 18.4 cm, H2 = 17.6 cm, T = 85.0 °C
Background Concept
When the pipe is heated by hot water, it expands and changes the geometry of the lever system, causing point Z to move. The experiment uses changes in height ( to ) as the measurable effect of thermal expansion. Temperature is needed to relate expansion to temperature rise.
Understanding the Question
You must measure:
- : the distance from the bench to point Z before adding hot water.
- : the new distance from the bench to Z when Z reaches its lowest position after filling the cylinder to the mark.
- : the temperature of the hot water in the cylinder.
Approach
- Use a ruler or metre rule to measure vertical distances from the bench to Z.
- Add hot water carefully until the level reaches the mark, then watch Z move and record the minimum height.
- Measure water temperature with the thermometer once the water has settled.
Step-by-Step Reasoning
- Before adding hot water, hold the ruler vertically on the bench near Z and read the height of Z at eye level: this is .
- Pour hot water slowly until the water surface reaches the mark on the pipe. Pouring slowly reduces overshoot and splashing.
- Observe Z as the pipe heats; it will move and then stop changing. Record the lowest position reached as .
- Place the thermometer bulb in the hot water (not touching the pipe or cylinder wall), wait for a steady reading, and record .
Key Takeaways
- Identify the correct moment to take : at the lowest (final) position.
- Temperature readings require time to stabilise.
Common Mistakes
- Recording too early (before Z stops moving).
- Measuring from the wrong reference level (not from the bench).
- Measuring while the thermometer bulb is touching the container wall (can give an unrepresentative reading).
Things to Be Careful About
- Avoid parallax when reading the ruler and thermometer.
- Ensure the water level is exactly at the mark; if above/below, the heated length is not the intended and affects the result.
• Calculate .
= ______
• Estimate the percentage uncertainty in your value of .
Show your working.
percentage uncertainty = ______
Working
Assume each height reading has uncertainty .
Absolute uncertainty in :
Percentage uncertainty:
Answer
percentage uncertainty
H1 − H2 = 0.8 cm; percentage uncertainty = 25%
Background Concept
When you calculate a difference of two measured values, the absolute uncertainty in the result is found by adding the absolute uncertainties of the two readings (worst-case). Then percentage uncertainty is
This is especially important when the difference is small, because the percentage uncertainty can become large.
Understanding the Question
You must:
- Compute the change in height .
- Estimate the percentage uncertainty in this change and show working.
The uncertainty must be based on how precisely you can read and .
Approach
- Subtract your measured heights to find .
- Decide the reading uncertainty for each height (often half a smallest division; many candidates use for a mm-scale ruler).
- For a subtraction, add the absolute uncertainties.
- Convert to percentage.
Step-by-Step Reasoning
- Using the example values, subtract: .
- Estimate reading uncertainty. If the ruler is marked in divisions, a common estimate is per reading.
- Combine for a difference (worst-case): .
- Percentage uncertainty: .
Key Takeaways
- Differences of similar numbers can have large percentage uncertainties.
- For addition/subtraction, add absolute uncertainties.
Common Mistakes
- Using percentage uncertainties of and instead of absolute uncertainties.
- Subtracting uncertainties () instead of adding.
- Forgetting to multiply by to convert to percent.
Things to Be Careful About
- Your uncertainty must match your instrument (don’t claim if you used a normal ruler).
- Keep units consistent: if you use for uncertainty, convert to (or vice versa) before forming the percentage.
Working
Answer
ΔL = 0.267 cm
Background Concept
The expression
comes from lever geometry: the movement at one point on a rigid bar is proportional to its distance from the pivot. Here, a measured vertical displacement at Z is converted into the extension of the pipe using the ratio of lever arms .
Understanding the Question
You are given the formula for and must calculate it using your measured , , and .
Approach
- Ensure , , and are in the same length unit.
- Substitute into the formula.
- Quote to a sensible number of significant figures based on the raw data.
Step-by-Step Reasoning
- Using example values in cm keeps the calculation simple and consistent.
- Compute numerator: .
- Divide by : .
- Round appropriately (typically 2–3 s.f. depending on measurement precision): .
Key Takeaways
- Keep units consistent; the lever ratio is dimensionless.
- Calculated quantities should not be quoted to unrealistic precision.
Common Mistakes
- Mixing mm and cm (e.g. in mm but in cm).
- Writing too many decimal places (false precision).
- Using instead of .
Things to Be Careful About
- Because may be small, rounding it too aggressively can change noticeably; keep an extra digit during working and round only at the end.
• Remove the pipe from the measuring cylinder and empty the water into the beaker.
• Select the other pipe and label one end of this pipe B. Make a mark approximately from end B.
• Measure and record the value of for this pipe.
= ______
Answer
Measure for the second pipe (example):
Example reading: L = 19.0 cm
Background Concept
Using two different initial lengths allows you to test whether the extension is proportional to (as suggested by the relationship in part (d)). You must therefore measure accurately for the second pipe as well.
Understanding the Question
You switch to the other pipe, label one end B, make a mark about from B, and then measure and record the actual distance from B to the mark.
Approach
- Make the mark roughly at the required distance.
- Measure the actual distance from end B to the mark with a ruler.
- Record with appropriate precision.
Step-by-Step Reasoning
- Place the ruler along the pipe with the zero aligned with end B.
- Read the position of the mark at eye level to reduce parallax.
- Record (commonly to ).
Key Takeaways
- Do not assume the mark is exactly : measure it.
Common Mistakes
- Measuring from end A instead of end B after relabelling.
- Recording with no unit.
Things to Be Careful About
- Ensure the mark is a thin line; a thick mark increases uncertainty in where to measure to.
• Place this pipe in the measuring cylinder as shown in Fig. 2.2.
• Ensure that end B is at the bottom of the measuring cylinder.
• Repeat (b)(ii) and (b)(iv).
= ______
= ______
= ______
= ______
Working
Example readings:
Answer
Example: H1 = 18.0 cm, H2 = 16.9 cm, T = 80.0 °C, ΔL = 0.367 cm
Background Concept
Repeating the same measurement process with a different pipe length tests the proposed proportionality to . Consistency of method is crucial: you want any difference in to be due to physics (different and possibly different ) rather than a changed measuring technique.
Understanding the Question
For the second pipe, you must repeat part (b)(ii) (measure , , and ) and part (b)(iv) (calculate ). The same apparatus geometry ( and ) is used.
Approach
- Set the second pipe in the cylinder with end B at the bottom.
- Measure before heating and at the lowest point after heating.
- Measure of the hot water.
- Compute from the given formula.
Step-by-Step Reasoning
- With the pipe at room temperature, record using the same ruler position/reference as before.
- Add hot water to the mark and wait until Z reaches its lowest stable position; record .
- Measure the water temperature .
- Compute and substitute into
- Round the final appropriately.
Key Takeaways
- Repeatability depends on keeping the method and reference points consistent.
- is a derived quantity; its quality depends on careful readings of and .
Common Mistakes
- Forgetting to ensure end B is at the bottom (heated length becomes wrong).
- Using a different reference point for height measurements between trials.
- Not waiting for Z to reach its minimum before recording .
Things to Be Careful About
- If and are unchanged, you should reuse the same measured values; do not re-measure sloppily and introduce extra variation unless instructed.
- Hot water temperature may drift while you wait; measure promptly and, if possible, stir for uniform temperature.
It is suggested that , , and are related by
where is a constant.
Using your data, calculate two values for .
first value of = ______
second value of = ______
Working
From
First pipe:
Second pipe:
Answer
first value of
second value of
k1 = 3.71×10^-4 °C^-1, k2 = 3.51×10^-4 °C^-1
Background Concept
The suggested model
states that thermal extension is proportional to the original heated length and the temperature rise . The constant plays the role of a coefficient of linear expansion (units of inverse temperature).
Understanding the Question
You have two sets of measurements (one for each pipe length). For each set, you know (or have calculated) , you measured , you measured the hot-water temperature , and you measured room temperature . You must calculate twice and report both values.
Approach
- Rearrange the given equation to make the subject.
- Use each data set separately.
- Keep temperature differences in (same size as in K for differences) and keep and in the same length unit (cm cancels).
Step-by-Step Reasoning
- Rearrange:
- For trial 1, compute and substitute with and .
- For trial 2, compute and substitute.
- Quote in (or ; both acceptable for a temperature difference).
Key Takeaways
- Temperature differences are what matter in thermal expansion.
- Use consistent units so cancellations happen cleanly.
Common Mistakes
- Using instead of .
- Mixing mm and cm for and .
- Reporting with no unit.
Things to Be Careful About
- Even if you convert to kelvin, is unchanged numerically; do not add 273 twice or create an incorrect difference.
- If your is small, rounding too early can change noticeably; keep extra digits until the final step.
It is suggested that the percentage uncertainty in the values of is .
Using this uncertainty, explain whether your results support the relationship in (d).
Working
Mean value:
Percentage difference:
Answer
Since , the two values of agree within the uncertainty, so the results support the relationship in (d).
Yes — values of k agree within 30%, so results support the relationship.
Background Concept
Two experimental values are considered consistent if their difference is no larger than what you would expect from the stated uncertainty. A common method is to calculate the percentage difference between the two values and compare it with the percentage uncertainty.
Understanding the Question
You are told that the percentage uncertainty in is . Using that, you must decide whether your two calculated values of are consistent enough to support the model in (d).
Approach
- Compute how far apart the two values are (difference).
- Express this difference as a percentage (often relative to the mean).
- If the percentage difference is less than (or comparable to) , conclude that the values agree within uncertainty.
Step-by-Step Reasoning
- Find the mean to use as a reference scale.
- Find the absolute difference .
- Convert to percentage difference:
- Compare with :
- If smaller, the discrepancy is within the uncertainty, supporting the relationship.
- If larger, the discrepancy is too big, and the data would not support the relationship.
Key Takeaways
- “Support” here means “consistent within uncertainty,” not “exactly equal.”
- Always link your final statement to the numerical comparison.
Common Mistakes
- Saying “supports” with no quantitative comparison.
- Comparing the difference to of the larger/smaller value without stating what you did.
- Using uncertainty in or instead of in (the question specifies uncertainty in ).
Things to Be Careful About
- The uncertainty is large (), so quite a big spread in could still be acceptable; don’t over-interpret small differences.
- Make sure your percentage is computed correctly (difference divided by a reference value, then ).
Describe four sources of uncertainty or limitations of the procedure for this experiment.
For any uncertainties in measurement that you describe, you should state the quantity being measured and the reason for the uncertainty.
Answer
- Uncertainty in and : Z is not a sharp pointer and readings can suffer from parallax when using a ruler/metre rule.
- Uncertainty in : difficult to judge the exact lowest position of Z because it moves while the pipe is heating and may oscillate slightly.
- Uncertainty in : thermometer has limited resolution/response time, and the water temperature may not be uniform (temperature gradients if not stirred).
- Uncertainty in the heated length: the water level may not be exactly at the mark (meniscus/overshoot), so the effective length at temperature is not exactly .
Four limitations/uncertainties listed (see solution).
Background Concept
An uncertainty/limitation statement scores well when it (i) names the quantity affected and (ii) explains the physical reason the reading is hard to take or the method is not ideal. Good answers are specific (e.g. “parallax in reading ”) rather than vague (e.g. “human error”).
Understanding the Question
You must give four sources of uncertainty or limitations in this experiment. If you mention a measurement uncertainty, you must state the quantity being measured and why it is uncertain.
Approach
Think through the procedure and identify where:
- readings are difficult (small changes, moving parts, unclear reference points),
- conditions are not controlled (temperature not uniform, water level not exactly at mark),
- the system may not behave ideally (friction at pivot, slipping of connections).
Then write four distinct, clearly explained points.
Step-by-Step Reasoning
Possible high-quality points include:
- Heights and : Z may be a broad wooden edge with no fine pointer; judging its exact level against a ruler introduces parallax and alignment error.
- Lowest height : while heating, the lever can move continuously; deciding the exact minimum is subjective, especially if Z overshoots or vibrates.
- Temperature : hot water can cool during the measurement; if not stirred, the water near the pipe may be cooler/warmer than where the thermometer bulb sits; thermometer lag adds further uncertainty.
- Water level at the mark (heated length): reading a meniscus in a cylinder and stopping exactly at the mark is difficult; if the level is not exactly at the mark, the length of pipe at temperature is not the intended .
Other creditable limitations (if needed) could be friction at the pivot, slipping of the pipe/attachments, or heating of the cylinder/pipe not reaching thermal equilibrium.
Key Takeaways
- State the quantity and the reason.
- Choose distinct limitations that affect the key calculated value .
Common Mistakes
- Writing vague points (“heat loss”, “human error”) without linking to what is measured and how it affects results.
- Repeating the same idea four times (e.g. four variants of “parallax”).
- Listing improvements instead of limitations (that belongs in (f)(ii)).
Things to Be Careful About
- Avoid claiming impossible precision (e.g. “exactly measure the lowest point”).
- Make sure each of the four points is clearly different and refers to a different weakness in the method or measurement.
Describe four improvements that could be made to this experiment. You may suggest the use of other apparatus or different procedures.
Answer
- Add a thin pointer (or attach a fiducial marker) at Z and use a set square to read and vertically to reduce parallax.
- Use a video recording (or a travelling microscope/pointer scale) to identify the minimum position of Z more precisely.
- Stir the hot water before measuring and use a digital temperature probe/data logger for faster response and better resolution.
- Repeat measurements for each pipe several times and take mean values of (and hence and ) to reduce random uncertainty.
Four improvements listed (see solution).
Background Concept
Improvements should be actionable changes that reduce uncertainty, control variables better, or increase reliability. The strongest improvements explicitly target the limitations identified in (f)(i).
Understanding the Question
You must propose four improvements to the experiment. You may use other apparatus or change procedures. Each improvement should plausibly make the measured more reliable/accurate.
Approach
For each limitation, ask: “What change would make that measurement easier or more precise?” Then propose a practical solution (pointer, better instruments, repetition, better temperature control, etc.).
Step-by-Step Reasoning
- Improve height readings: a sharp pointer at Z gives a clear reference; a set square ensures the measurement is vertical and reduces parallax.
- Improve detection of minimum : video allows frame-by-frame identification of the lowest point; alternatively, a scale and pointer arrangement can make the minimum clearer.
- Improve temperature measurement: stirring reduces gradients; a digital probe/data logger reduces reaction time and can track cooling, letting you record a representative temperature.
- Improve reliability: repeating each run and averaging reduces random scatter and makes the comparison of two values more meaningful.
Other valid improvements could include insulating the cylinder to reduce cooling, using a lid to reduce heat loss, or increasing (larger expansion gives a larger and smaller percentage uncertainty).
Key Takeaways
- Improvements must be specific and practical.
- The best improvements clearly reduce a named uncertainty.
Common Mistakes
- Giving vague suggestions (“use better equipment”) without stating what and how it helps.
- Repeating the same improvement in different words.
- Suggesting changes that alter the physics being tested without control (e.g. changing materials) rather than improving measurement quality.
Things to Be Careful About
- Ensure each improvement is distinct.
- Make sure the improvement is feasible with typical lab equipment and genuinely addresses the measurement challenges in this set-up.