Physics 9702/33 — October/November 2024
Cambridge AS Level · Advanced Practical Skills · worked solutions for every part, with the mark scheme
Topics Manipulation, Measurement and Observation · Presentation of Data and Observations · Analysis, Conclusions and Evaluation
In this experiment, you will determine the resistivity of a metal.
● Set up the circuit shown in Fig. 1.1.
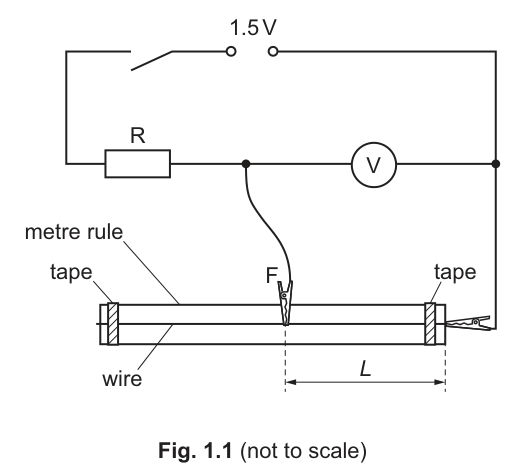
● The distance between the two crocodile clips is . The reading on the voltmeter is .
Adjust the position of crocodile clip F so that is approximately .
● Close the switch.
● Record the value of and the voltmeter reading .
= ______
= ______
● Open the switch.
Answer
Example of acceptable readings (student-dependent):
Example: L = 45.0 cm, V = 0.56 V
Background Concept
The experiment measures the potential difference across a chosen length of a metal wire. A voltmeter must be connected in parallel with the section of wire being measured. The length is set by moving a crocodile clip along the wire on a metre rule.
Understanding the Question
You are instructed to set the crocodile clip so that the distance between the fixed end and clip F is about , then close the switch and record:
- the length (from the metre rule), and
- the voltmeter reading across that length.
Approach
- Set up the circuit exactly as shown, ensuring the voltmeter is across the wire segment.
- Move clip F until .
- Close the switch briefly, wait for a steady reading, then record and .
- Open the switch to reduce heating of the wire.
Step-by-Step Reasoning
- Measure along the metre rule between the fixed contact and the position of clip F.
- Record to the nearest mm (typical: ) because a metre rule has 1 mm divisions.
- With the switch closed, read directly from the voltmeter scale/display and record to the voltmeter resolution.
- Open the switch after taking the reading to minimise temperature rise (resistance increases with temperature, affecting ).
Key Takeaways
- The voltmeter must be in parallel with the wire section whose p.d. is measured.
- Length readings should match the precision of the ruler scale.
- Avoid heating by keeping the switch closed only when taking readings.
Common Mistakes
- Measuring from the wrong end of the wire or not from the fixed contact.
- Leaving the switch closed for a long time so the wire warms up and readings drift.
- Recording without a unit or with unrealistic precision (e.g. ).
Things to Be Careful About
- Avoid parallax when reading the metre rule.
- Ensure crocodile clips make good electrical contact; a loose contact gives unstable .
- Record the actual you set (it only needs to be approximately , not exactly).
Vary in the range by adjusting the position of F. For each position of F, measure and . Repeat until you have six sets of values of and .
Record your results in a table. Include values of and in your table.
Answer
A single table with headings including units, and six sets of readings spanning to , plus calculated and .
Example (student-dependent):
Table of six L and V values (15.0–95.0 cm) with calculated 1/L and 1/V, correctly headed with units.
Background Concept
To test a relationship experimentally, you need:
- a suitable spread of the independent variable (here ),
- repeated measurements of the dependent variable (here ), and
- clear recording of raw and calculated values.
Because later parts ask for a graph of against , you must calculate the reciprocal columns carefully and present them with correct units.
Understanding the Question
You must vary the clip position so that covers the range to and record six pairs . You must then add two derived columns and .
Approach
- Choose six values of spaced across the range (e.g. roughly evenly).
- For each , close the switch briefly, read , then open the switch.
- Record all values in one table with units in headings.
- Compute and for each row, keeping sensible significant figures.
Step-by-Step Reasoning
- Select values across the whole interval: using only a narrow range makes the graph unreliable.
- For each :
- set the clip position,
- measure (typically to ),
- close the switch, allow the reading to settle, record , then open the switch.
- Construct a table:
- each heading should show quantity and unit, e.g. , ,
- derived headings must include units: and ,
- keep consistent decimal places in a column (especially for ).
- Compute reciprocals using a calculator:
- e.g. if , then ,
- if , then (to 3 s.f. if appropriate).
Key Takeaways
- Use a wide range and enough readings (six) for a reliable straight-line test.
- Put units in the table headings, not repeatedly in the body.
- Derived quantities need correct units and sensible rounding.
Common Mistakes
- Fewer than six sets of readings.
- Using values outside the required range.
- Missing units or incorrect units for and .
- Inconsistent rounding (e.g. mixed 2 d.p. and 3 d.p. within one column).
Things to Be Careful About
- If the wire heats up, for the same may drift; minimise by opening the switch between readings.
- Ensure you calculate using the recorded value (not the intended value).
- Do not write as ; it must be .
Answer
Plot against using a suitable scale (at least half the grid in each direction) and plot all six points accurately as small crosses.
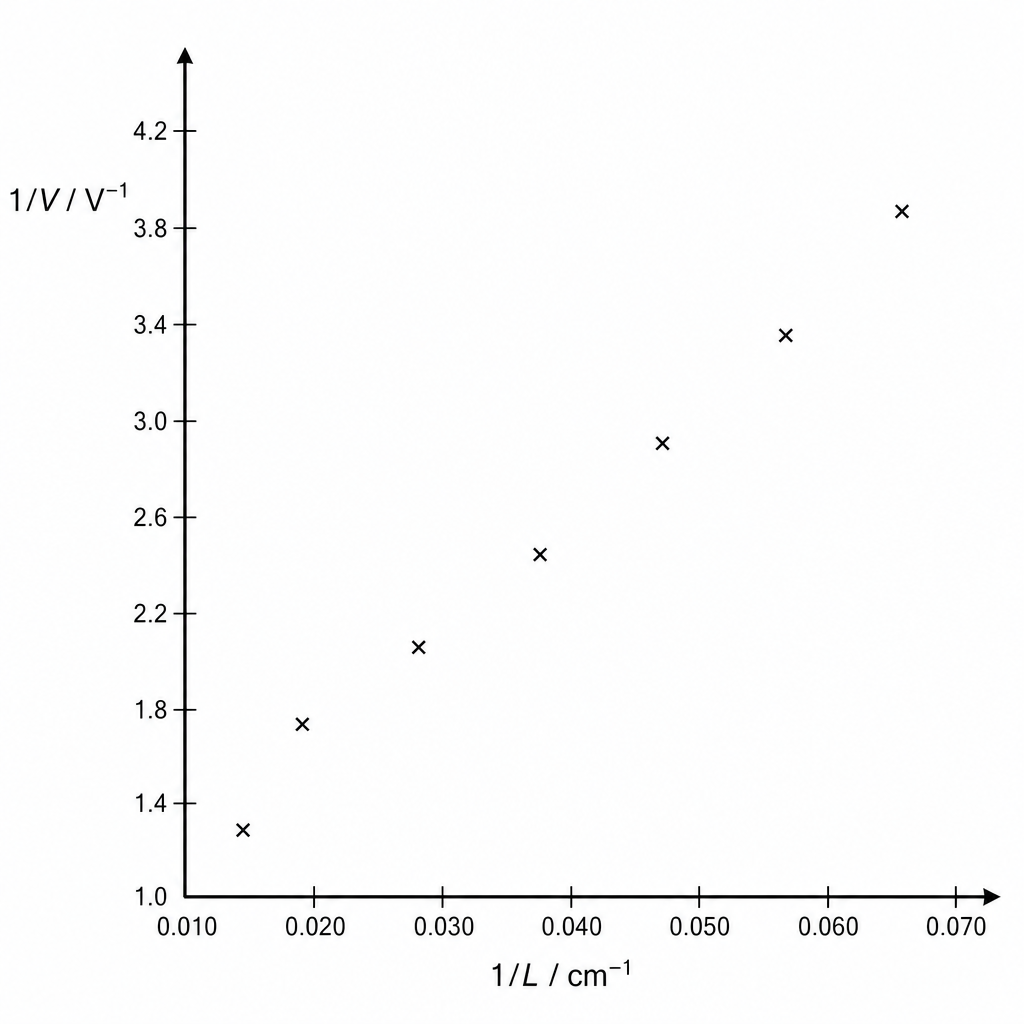
Graph of 1/V (V^-1) vs 1/L (cm^-1) plotted with suitable scales and all points.
Background Concept
A graph is used to test whether two variables have a linear relationship. When the question specifies plotting against , it is telling you to use a linearised form so the data should lie close to a straight line.
Good graph technique is assessed by:
- correct axis labels (quantity and unit),
- sensible scales,
- accurate plotting.
Understanding the Question
You have a table of six values of and and their reciprocals. You must plot:
- vertical axis: in ,
- horizontal axis: in .
Approach
- Decide the ranges of and from your table.
- Choose scales so the plotted points fill most of the graph paper.
- Label axes with both quantity and unit.
- Plot each point as a small cross centered on the coordinate.
Step-by-Step Reasoning
- From typical data, might range from about to .
- might range from about to .
- Pick scales such as:
- -axis: 0.010 to 0.070 with convenient divisions,
- -axis: 1.0 to 4.2 with convenient divisions.
- Plot all points carefully; accuracy matters because the next part uses the best-fit line to find gradient/intercept.
Key Takeaways
- Axes must be labelled as and .
- Use a scale that spreads points out for a more accurate gradient.
Common Mistakes
- Swapping axes (plotting on ).
- Missing units or writing units incorrectly (e.g. instead of ).
- Using a cramped scale so all points bunch together.
Things to Be Careful About
- Do not force the graph to go through the origin unless the data demands it.
- Plotting should be to within about half a small square.
- Use crosses, not large dots, so the best-fit line can be judged fairly.
Answer
Draw one straight line of best fit through the plotted points (not point-to-point), with the scatter balanced about the line.
Straight line of best fit drawn.
Background Concept
A best-fit line represents the overall trend of the data when measurements have random uncertainty. The line should be straight here because the chosen variables are expected to have a linear relationship.
Understanding the Question
After plotting the points of against , you must draw the straight line that best represents the relationship.
Approach
Use a ruler to draw one straight line that:
- passes through the middle of the cluster of points,
- has roughly equal numbers of points above and below (ignoring outliers only if clearly justified by an obvious mistake).
Step-by-Step Reasoning
- Place a ruler so that it matches the trend of the plotted points.
- Adjust it so that the distances of points above and below the line are, overall, similar.
- Draw a single straight line that extends across the full spread of your data (not only between the middle points).
Key Takeaways
- A best-fit line is not drawn by joining the dots.
- Extending the line across the full range helps with reading gradient and intercept accurately.
Common Mistakes
- Drawing a line that deliberately goes through every point (impossible with scatter).
- Using a short line segment that does not cover the data range.
- Drawing a curve when a straight line is expected.
Things to Be Careful About
- Use a sharp pencil and ruler; thick lines reduce reading accuracy.
- Do not choose the steepest or shallowest possible line unless asked for a worst acceptable line (not asked here).
Determine the gradient and -intercept of this line.
gradient = ______
-intercept = ______
Working
Using two well-separated points on the best-fit line,
Example values from a suitable best-fit line:
-intercept at :
Answer
-intercept
gradient = 50 cm V^-1, y-intercept = 0.67 V^-1
Background Concept
For a straight-line graph,
- the gradient is
- the -intercept is the value of when .
Here, is and is , so:
- gradient has units ,
- intercept has units .
Understanding the Question
You must obtain two numerical values from your best-fit line:
- the gradient,
- the -intercept.
These will be used directly in part (d).
Approach
- Choose two points on the drawn best-fit line that are far apart (to reduce percentage reading error).
- Read their coordinates and .
- Compute gradient .
- Find the intercept by reading where the line crosses the -axis (at ).
Step-by-Step Reasoning
- Pick points on the line (not the experimental crosses). A large separation in makes large and reduces the effect of small reading errors.
- Calculate:
- For the intercept, extend the line to meet the -axis at and read there.
- Quote both with appropriate units: for gradient and for intercept.
Key Takeaways
- Always use two points on the best-fit line, not two measured points.
- Gradient is , never .
- Units come from the axes.
Common Mistakes
- Using points that are too close together, giving an inaccurate gradient.
- Forgetting that the -axis is , not .
- Writing the intercept with the wrong unit (e.g. instead of ).
Things to Be Careful About
- Read coordinates carefully from the scale you chose.
- If your graph uses in cm, your gradient will be in (conversion to SI may be needed later).
It is suggested that the quantities and are related by the equation
where and are constants.
Using your answers in (c)(iii), determine the values of and . Give appropriate units.
= ______
= ______
Working
Given
Plot is against , so
Hence
Answer
J = 50 cm V^-1, W = 0.67 V^-1
Background Concept
If experimental data fits a straight line, you can compare the equation to the standard linear form:
Here,
If you define and , then
So the gradient is and the intercept is .
Understanding the Question
You have already found the gradient and -intercept from your graph of against . Now you must use those to state numerical values for the constants and , including units.
Approach
- Identify and from the axes.
- Compare the given equation with .
- Assign to the gradient and to the intercept.
- Use axis units to give units for and .
Step-by-Step Reasoning
- Since the graph is (units ) vs (units ), the gradient unit is:
- The intercept is read from the -axis, so it has units .
- Therefore, whatever numbers you obtained in (c)(iii) are directly and .
Key Takeaways
- Linearisation means constants can often be read directly as gradient/intercept.
- Units for gradient/intercept come directly from the graph axes.
Common Mistakes
- Using instead of when matching to .
- Swapping and .
- Giving the wrong unit (e.g. instead of ).
Things to Be Careful About
- If you later need SI units, convert from to by dividing by .
Answer
Example (student-dependent), micrometer reading to with repeats:
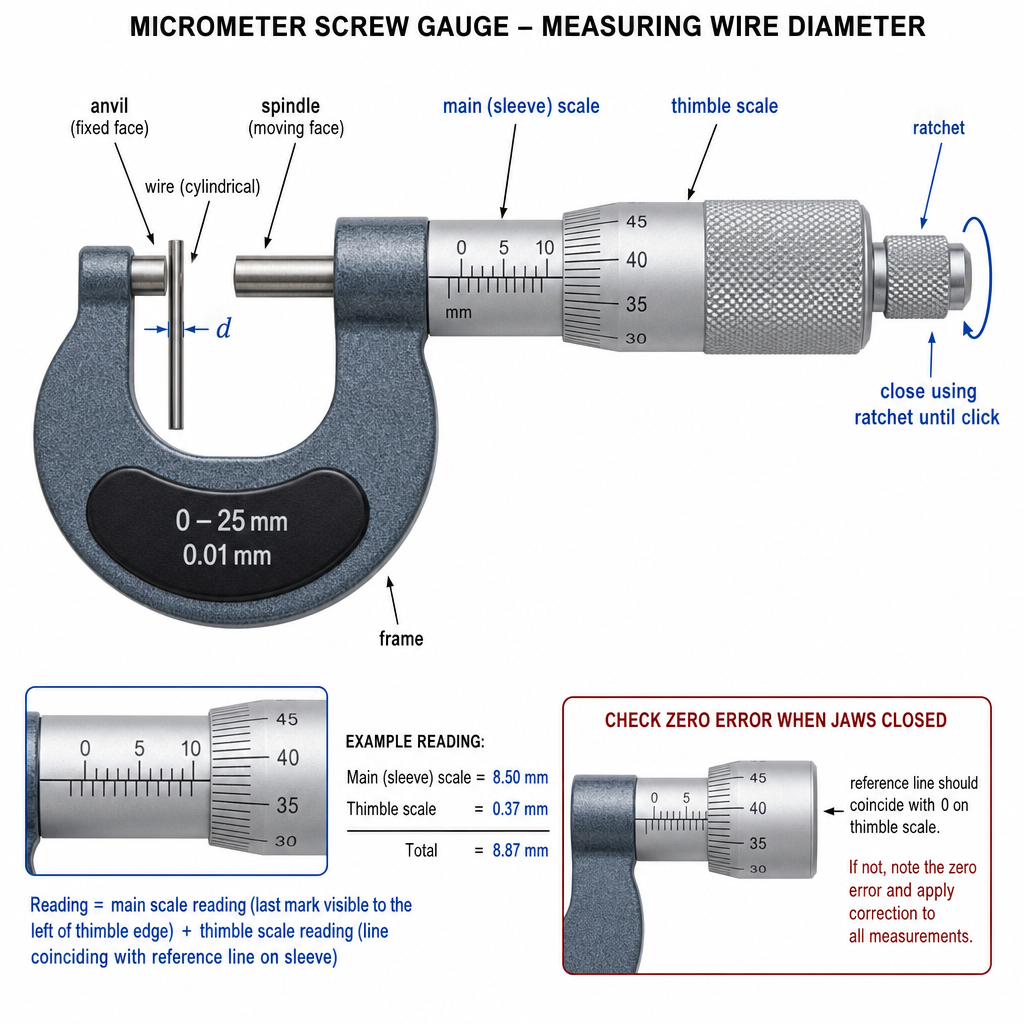
Example: d = 0.32 mm
Background Concept
The wire diameter is needed to find its cross-sectional area :
Because depends on , any percentage uncertainty in is doubled in , so careful measurement of is important.
A micrometer screw gauge typically reads to .
Understanding the Question
You must measure and record the diameter of the wire using a micrometer. Two marks typically require:
- correct precision (e.g. ), and
- good technique such as repeats and/or zero-error check.
Approach
- Check the micrometer for zero error.
- Measure the wire diameter by gently closing the jaws using the ratchet.
- Repeat at several positions and average.
- Record with unit.
Step-by-Step Reasoning
- Close the micrometer gently until the ratchet clicks; this applies a consistent force.
- If the micrometer reads a non-zero value when fully closed, apply a zero correction.
- Measure the diameter at different points along the wire and at different orientations (the wire may not be perfectly circular).
- Average the readings and record as .
Key Takeaways
- Use the ratchet to avoid compressing the wire.
- Repeat measurements and average for reliability.
- Record to the instrument resolution and include the unit.
Common Mistakes
- Not using the ratchet, leading to inconsistent pressure.
- Forgetting to correct for zero error.
- Recording with too many decimal places or without units.
Things to Be Careful About
- Ensure the wire is perpendicular to the anvil/spindle faces.
- Do not measure over a kinked or flattened section of wire.
- Keep track of units: .
Theory suggests that
where is and is the resistivity of the metal of the wire.
Using your answers in (d) and (e)(i), determine a value for .
= ______
Working
Given
Rearrange:
Convert to SI: .
Convert : .
Substitute and :
Answer
3.6 × 10^-6 Ω m
Background Concept
Resistivity is a material property linking resistance to dimensions:
This practical uses a graph to obtain constants ( and ), then combines them with the wire diameter to determine via the given theoretical relationship:
Understanding the Question
You are given:
- ,
- your measured from (e)(i),
- your and from (d).
You must calculate in . This requires SI units, so any values in cm or mm must be converted to m.
Approach
- Rearrange the given equation to make the subject.
- Convert to metres and ensure corresponds to in metres.
- Substitute values with units.
- Quote with appropriate significant figures and unit .
Step-by-Step Reasoning
Start with:
Multiply both sides by and divide by :
Unit consistency:
- If your graph used in cm, then came out in . The theoretical equation expects SI (metres), so convert:
- Convert diameter from mm to m:
Then substitute:
- compute carefully (it strongly affects the answer),
- keep track of powers of ten,
- ensure final unit is .
Key Takeaways
- Practical calculations often depend critically on unit conversions.
- When a graph uses non-SI units, the gradient/intercept may need conversion before use in theory equations.
- Squared quantities (like ) amplify measurement uncertainty.
Common Mistakes
- Using in directly without converting to .
- Using in mm instead of m.
- Rearranging incorrectly (e.g. putting in the numerator).
- Forgetting the unit .
Things to Be Careful About
- Convert only if the theoretical equation assumes in metres (it does here).
- Keep significant figures consistent with your measured values (often 2 or 3 s.f.).
- Write the unit as (not ).
In this experiment, you will investigate the movement of a ball.
You are provided with two table tennis balls A and B, each attached to a string.
The mass of A and its string is .
Use the balance to measure .
= ______
Measure the mass of ball A plus its string using the balance and record it to the balance resolution.
Example (typical):
m = 3.80 g (example; student-dependent)
Background Concept
A balance measures mass by comparing the weight of an object with an internal calibrated reference. The key exam skills are:
- zeroing (tare) the balance so the reading is not offset,
- placing the whole object to be measured on the pan,
- recording the mass with the correct unit and to the correct resolution (number of decimal places shown).
Understanding the Question
You are told that the mass of ball A together with its string is . You must use the provided balance to obtain a value of and write it in grams.
Approach
- Ensure the balance reads (or depending on its resolution) with an empty pan.
- Place ball A and its string on the pan without anything else touching.
- Wait for the reading to stabilise.
- Record the value with unit and with the same decimal places as the balance display.
Step-by-Step Reasoning
- If the balance displays to , record to (e.g. ).
- If it displays to , record to (e.g. ).
- Do not round to fewer decimal places than the balance provides.
Key Takeaways
- Always tare/zero first.
- Record mass with the correct unit and matching the instrument resolution.
Common Mistakes
- Forgetting to zero the balance.
- Measuring only the ball and not the string.
- Recording in when the answer line asks for .
Things to Be Careful About
- Ensure the string is fully supported by the balance pan and not touching the bench.
- Avoid draughts or movement that makes the reading fluctuate.
● Attach the clamp to the stand using the boss.
● Place both strings between the two wooden strips and secure the wooden strips in the clamp, as shown in Fig. 2.1.
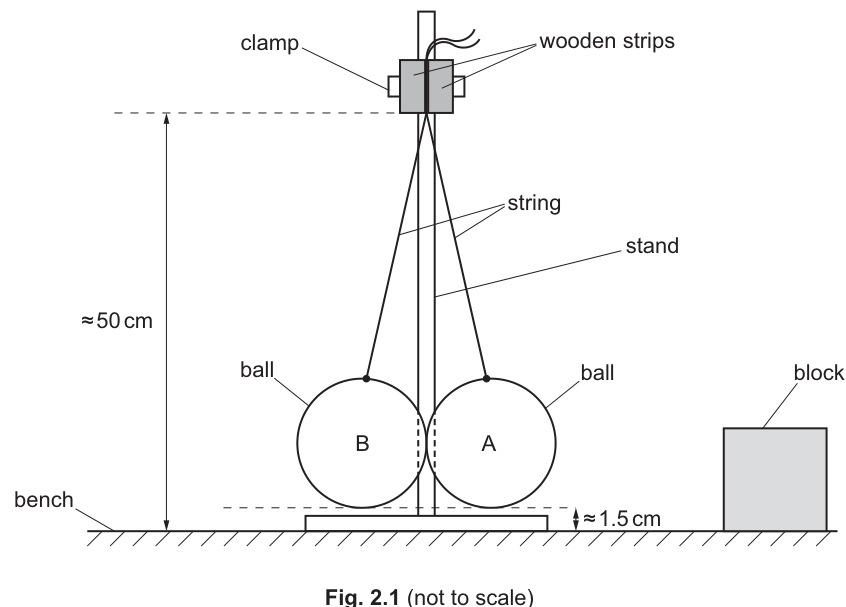
● Adjust the apparatus so that the bottoms of the two wooden strips are approximately above the bench and the bottoms of the two balls are approximately above the bench.
● Displace A and adjust the position of the block so that, when they are touching, the centre of A is level with the top of the block, as shown in Fig 2.2.
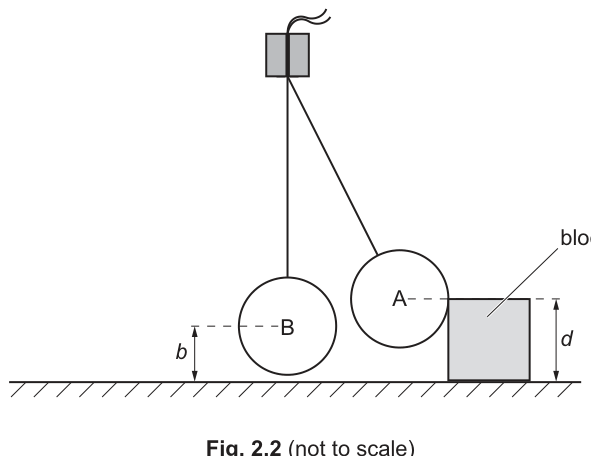
● When A is in this position, the distance between the centre of B and the bench is , as shown in Fig. 2.2.
The distance between the top of the block and the bench is .
Measure and record and .
= ______
= ______
● Calculate . Give an appropriate unit.
= ______
Example measurements (typical):
b = 3.5 cm, d = 7.5 cm, \sqrt{d-b} = 2.00 cm^{1/2} (example; student-dependent)
Background Concept
When you measure lengths with a ruler/metre rule, the key limitation is reading uncertainty (set by the smallest scale division) and parallax error if your eye is not directly in line with the mark.
Here, and are vertical distances from the bench to specific points. The quantity is a length, so it has unit (if and are in ). Taking a square root gives a derived unit:
Understanding the Question
You set up the apparatus so that when ball A touches the block, the centre of A is level with the top of the block.
- is the height of the centre of ball B above the bench in this configuration.
- is the height of the top of the block above the bench.
You must measure and , then calculate and include an appropriate unit.
Approach
- Use a ruler/metre rule to measure heights from the bench to the relevant point.
- Record and in to sensible precision (typically with a mm scale).
- Compute .
- Take the square root and write the correct unit .
Step-by-Step Reasoning
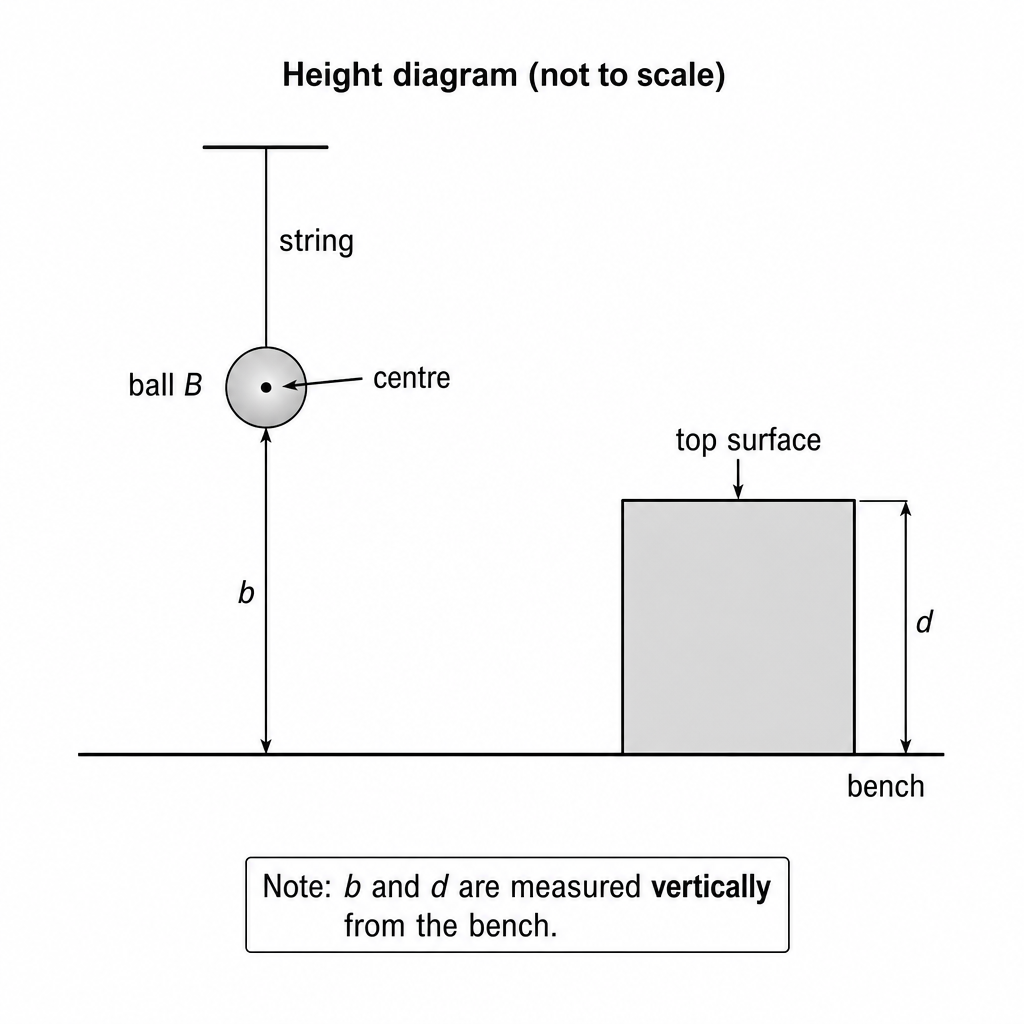
- Measuring : hold a metre rule vertically with its zero on the bench beside the block; read the scale at the top surface of the block.
- Measuring : with B hanging, identify the centre of the ball (half its diameter above its lowest point). Measure its height above the bench. A common practical method is to measure the height of the bottom of B above the bench and add the radius of the ball.
- Subtraction: compute using the same unit (both in cm).
- Square root: apply to .
- Unit: because you took a square root of a length, write .
Key Takeaways
- Keep units consistent before subtracting.
- A square root changes units: .
Common Mistakes
- Using different units for and before subtracting.
- Forgetting the unit or writing the unit as instead of .
- Measuring to the wrong point (e.g. top of the ball rather than centre).
Things to Be Careful About
- Parallax: your eye must be level with the mark being read.
- Ensure the bench is the reference level for both and .
- If you use the ball diameter to locate the centre, measure the diameter once and keep that value consistent.
If and are measured to the nearest , then is only known to about (or worse if both readings contribute). Therefore should be quoted to an appropriate number of significant figures consistent with this (e.g. ).
Quote \sqrt{d-b} to sig. figs. consistent with b and d (e.g. 2 s.f. if b and d are 0.1 cm).
Background Concept
Significant figures in a calculated quantity should reflect the uncertainty/precision of the measurements used.
- A metre rule typically allows readings to (nearest mm) or you record to .
- When you subtract two similar numbers, the absolute uncertainty in the difference can be relatively large compared with the difference.
- Taking a square root does not improve measurement precision; the result should not contain unjustified extra digits.
Understanding the Question
You calculated in (b)(i). This part asks you to explain why you wrote it to the number of significant figures you chose.
Approach
- State the resolution of the ruler readings for and .
- Explain that inherits uncertainty from both measurements.
- Conclude that should be rounded so it does not claim more precision than the measurements allow.
Step-by-Step Reasoning
- Suppose and are each recorded to . That implies each has an uncertainty on the order of .
- The difference combines both uncertainties, so its uncertainty is roughly the sum of the absolute uncertainties (order-of-magnitude reasoning is sufficient in Paper 3).
- Therefore might be uncertain by about (or more), so giving to many decimal places would be unjustified.
- A sensible choice is usually 2 or 3 significant figures depending on the size of and the ruler precision.
Key Takeaways
- Your calculated value must not imply higher precision than the measurements.
- Subtraction can reduce the meaningful precision.
Common Mistakes
- Quoting to 4 or 5 significant figures because a calculator shows them.
- Claiming “more s.f. is better”; it is not if it is not supported by measurement precision.
Things to Be Careful About
- Be explicit: mention the measurement precision of and (e.g. nearest ) and connect it to the rounding of .
● Release A so that it moves towards B.
● When A hits B, it causes B to move.
At the maximum height of ball B, the vertical distance between the centre of B and the bench is , as shown in Fig. 2.3.
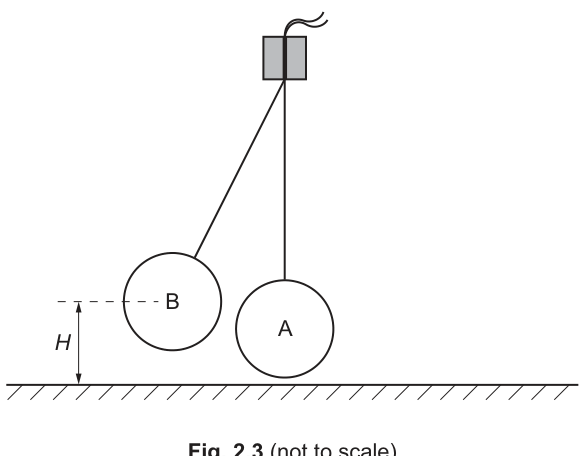
Determine .
= ______
Determine the maximum vertical height of the centre of ball B above the bench.
Example (typical):
H = 6.5 cm (example; student-dependent)
Background Concept
A pendulum bob rises to a maximum height (turning point) where its speed is momentarily zero. In experiments, the turning point is difficult to judge because it occurs briefly and the bob may oscillate.
A good measurement of a maximum height typically needs:
- a fixed scale (metre rule) referenced to the bench,
- a method to avoid parallax,
- repeats and averaging.
Understanding the Question
After releasing A, it collides with B and B swings upward. You must find , the vertical distance from the bench to the centre of B at its maximum height.
Approach
- Place a vertical scale beside the path of ball B (metre rule clamped upright).
- Use a marker/pointer aligned with the centre of B to identify its highest position.
- Repeat several times and take a consistent reading for .
Step-by-Step Reasoning
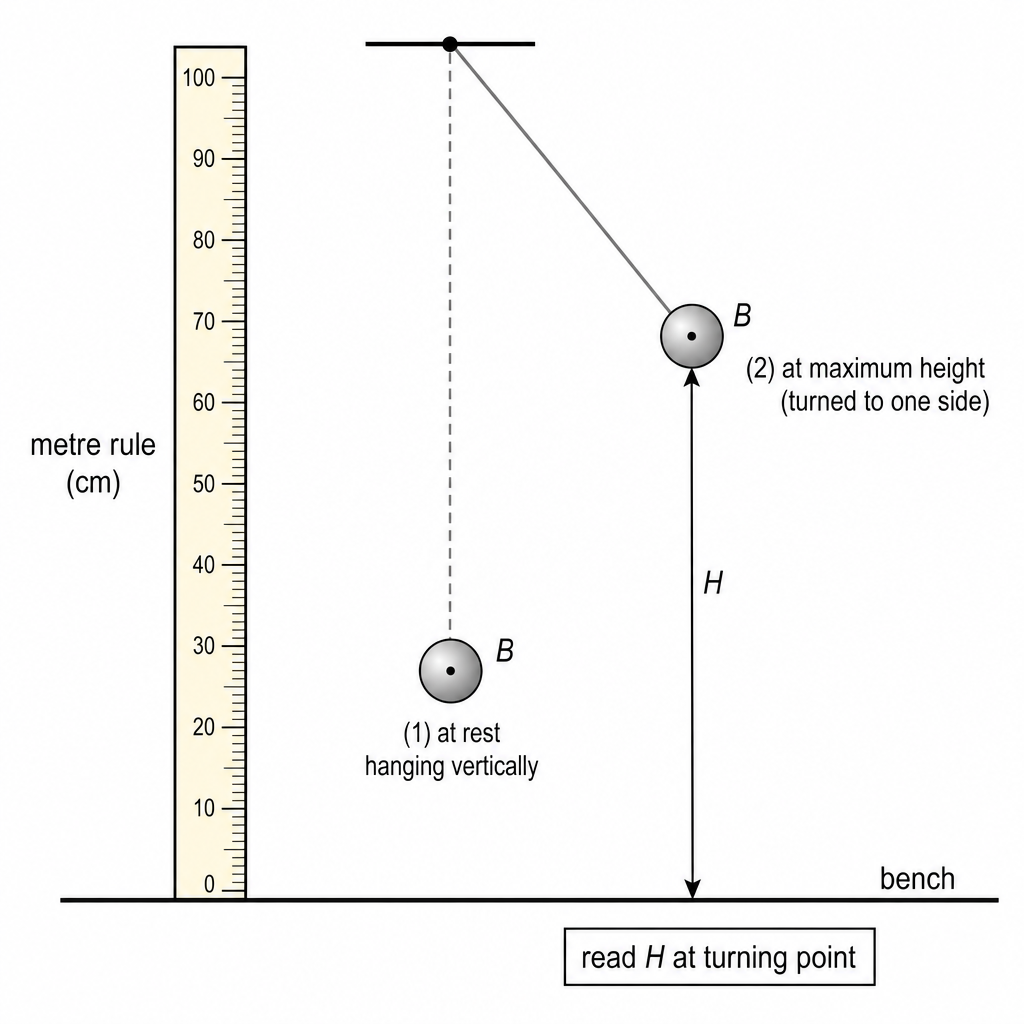
- Fix a metre rule vertically with its zero on the bench.
- Watch ball B and identify the highest point of its centre (a piece of card behind the ball can help you see the centre).
- Read the height at the turning point; to reduce random error, repeat the release several times and take the mean of consistent readings.
Key Takeaways
- Turning-point measurements are often the largest source of uncertainty.
- Repeating and averaging improves reliability.
Common Mistakes
- Measuring to the bottom or top of the ball instead of the centre.
- Reading the scale after the ball has already started descending.
- Holding the ruler by hand so it moves between trials.
Things to Be Careful About
- Keep the metre rule fixed and vertical.
- Align your eye with the centre of the ball to minimise parallax.
- Ensure each trial uses the same release position of A so that collisions are comparable.
Estimate the percentage uncertainty in your value of . Show your working.
percentage uncertainty = ______ %
Example (typical): take absolute uncertainty in as (difficulty judging maximum height).
8% (example, using \Delta H = 0.5 cm and H = 6.5 cm)
Background Concept
Percentage uncertainty expresses how large an absolute uncertainty is compared with the measured value:
Here, should reflect the limiting factor in measuring . For a turning point, the dominant uncertainty is often not the ruler resolution but the difficulty of judging the exact highest position.
Understanding the Question
You measured in (b)(iii). You must estimate the percentage uncertainty in and show the calculation.
Approach
- Decide a reasonable absolute uncertainty .
- If the metre rule reads to , the resolution might suggest .
- But because is a turning-point reading, a larger uncertainty (e.g. to ) is often more realistic.
- Substitute into .
Step-by-Step Reasoning
- Choose an uncertainty that matches the real limitation (turning point). For example, if you can only judge the maximum to about half a centimetre, then .
- Compute:
- Round appropriately (often to 1 s.f. or 2 s.f.): .
Key Takeaways
- Always use .
- For maximum-height measurements, the dominant uncertainty is often observational.
Common Mistakes
- Using the ruler resolution only (e.g. ) when the turning point dominates.
- Using in the denominator when the question asks uncertainty in .
- Forgetting to multiply by 100.
Things to Be Careful About
- State clearly what absolute uncertainty you assumed for and why.
- Use consistent units (both and in cm).
With this arrangement of the apparatus, the total mass of A is equal to measured in (a).
● Record the total mass of A.
= ______
● Calculate .
= ______
With this arrangement, .
Example (typical):
M = 3.80 g, \sqrt{H-b} = 1.73 cm^{1/2} (example; student-dependent)
Background Concept
This part uses two practical skills:
- Identifying that the “total mass of A” is the same quantity already measured as (when no extra mass is attached).
- Calculating a derived quantity from measured values.
If and are heights in , then is in and
Understanding the Question
You must:
- record , the total mass of A (which equals here),
- calculate using your measured from (b)(iii) and from (b)(i).
Approach
- Set and copy the value (with the same precision and unit).
- Compute .
- Take the square root and write the unit .
Step-by-Step Reasoning
- Because no additional mass is attached in part (b), the only mass of A is the ball plus string: .
- Subtract the two heights to find the rise of ball B above its initial centre height.
- Apply square root and include units.
Key Takeaways
- Use given relationships between symbols (here ).
- Always include units for derived quantities.
Common Mistakes
- Re-measuring unnecessarily and getting an inconsistent value.
- Forgetting to subtract from .
- Writing the unit incorrectly.
Things to Be Careful About
- Ensure so that is positive before taking a square root.
- Keep consistent significant figures based on and precision.
● Use the adhesive putty to attach the slotted mass to A.
The total mass of A is now equal to the sum of and the mass of the slotted mass.
● Displace A and adjust the position of the block so that, when they are touching, the centre of A is level with the top of the block, as shown in Fig. 2.2.
● Repeat (b)(iii) and (b)(v).
= ______
= ______
= ______
Attach the mass to A, repeat the measurement of and record the new total mass .
Example (typical):
H = 9.8 cm, M = 13.8 g, \sqrt{H-b} = 2.51 cm^{1/2} (example; student-dependent)
Background Concept
Changing the mass of the moving ball A changes the collision outcome, so you take a second set of readings. In practical work, you keep the geometry the same (same and same procedure) and change only one variable (the mass of A).
The new total mass is:
Understanding the Question
You must attach a known mass to A, then repeat what you did earlier to obtain:
- a new maximum height for ball B,
- the new total mass ,
- the new value of .
Approach
- Secure the slotted mass firmly using putty so it does not slip during motion.
- Re-adjust the block so that when A touches it, the centre of A is level with the top of the block (same condition as before).
- Release A, measure at the maximum height of B.
- Calculate and then .
Step-by-Step Reasoning
- Attaching the mass changes but does not change the measured of the ball + string.
- You must re-set the block position because the string may stretch/shift slightly when the mass is added, changing the geometry.
- Once you have a consistent value, substitute into and include .
Key Takeaways
- Change one factor (mass) and repeat measurements consistently.
- Re-adjusting the apparatus to the stated condition is essential for fair comparison.
Common Mistakes
- Forgetting to add to when calculating .
- Allowing the attached mass to be off-centre so A twists, giving inconsistent collisions.
- Not re-checking the block alignment condition (centre of A level with block top).
Things to Be Careful About
- Ensure the putty holds the mass securely throughout the swing.
- Record to appropriate precision (often 0.1 g when adding 10.0 g).
- Use the same value unless you have re-measured it after adjusting the setup.
It is suggested that the relationship between , , , and is
where is a constant.
Using your data, calculate two values of .
first value of = ______
second value of = ______
From
Using example data set 1 (, , ):
Using example data set 2 (, , ):
first value of :
second value of :
k1 = 0.328 cm^{-1/2}, k2 = 0.330 cm^{-1/2} (example; student-dependent)
Background Concept
When an equation is given with an unknown constant (here ), you can test the relationship by calculating from different sets of measurements. If the relationship is correct and uncertainties are small enough, the calculated values of should agree within experimental uncertainty.
The given model is:
All the quantities on the right can be measured or calculated from measurements, so you can rearrange to find .
Understanding the Question
You have two sets of data:
- No added mass (so ), giving one value of and therefore one value of .
- With the mass attached (so ), giving a second value of .
You must calculate two values of , one from each set.
Approach
- Rearrange the equation to make the subject:
- For each set of data, substitute the measured/calculated values.
- Keep consistent units (e.g. if are in cm, then and are in , so has unit ).
Step-by-Step Reasoning
- Compute once from (b)(i).
- For each run, compute .
- Evaluate .
- Evaluate (note: is dimensionless; the unit comes from ).
- Subtract to find .
If the two values are close, that supports the model.
Key Takeaways
- Always rearrange first to a clear expression for the constant.
- Use consistent units and keep track of derived units like .
Common Mistakes
- Using in both cases (instead of for the first run).
- Forgetting the factor of 2 in .
- Mixing cm and m in the square roots.
Things to Be Careful About
- Brackets: the term is , not vs .
- Significant figures: do not over-quote given the uncertainties in , , and .
It is suggested that the percentage uncertainty in the values of is .
Using this uncertainty, explain whether your results support the relationship in (d).
Using example values and :
Since , the two values of agree within the stated uncertainty, so the results support the relationship in (d).
Yes; k values agree within 15% uncertainty (example: 0.6% difference).
Background Concept
To decide whether results support a suggested relationship, you check whether differences between values derived from the data are explainable by the experimental uncertainty.
A common method is to compare the percentage difference between two values with the percentage uncertainty. If:
then the values are consistent (agreement within uncertainty).
Understanding the Question
You calculated two values of in (d). You are told the percentage uncertainty in the values of is . You must use that to decide whether your two values are consistent with each other (and therefore whether the relationship is supported).
Approach
- Find how different the two values are (absolute difference).
- Convert that difference into a percentage (often relative to the mean of the two values).
- Compare with .
- State a clear conclusion.
Step-by-Step Reasoning
- Compute:
- If this is less than , then the discrepancy is small enough to be due to uncertainty, so the data supports the model.
- If it is greater than , then the data does not support the model (or there may be a systematic error).
Key Takeaways
- Agreement is judged relative to uncertainty, not by exact equality.
- A short, explicit concluding sentence is required.
Common Mistakes
- Saying “they are close” without a quantitative comparison.
- Comparing the absolute difference with 15 (instead of comparing percentage difference with ).
Things to Be Careful About
- Make sure you interpret as a percentage uncertainty for , not for or other measurements.
- Use consistent rounding; over-rounding can hide a real mismatch.
Describe four sources of uncertainty or limitations of the procedure for this experiment.
For any uncertainties in measurement that you describe, you should state the quantity being measured and a reason for the uncertainty.
Answer
- Uncertainty in : difficult to judge the exact maximum height (turning point happens briefly), so has large reading uncertainty.
- Uncertainty in and/or : parallax when reading the metre rule and difficulty locating the centre of the ball / top surface of the block.
- Collision not perfectly repeatable: A may not strike B centrally each time (slight sideways motion/twist), so B’s maximum height varies between trials.
- Energy losses: air resistance and friction at the clamp/string and deformation of balls during collision reduce energy transfer, affecting measured (systematic reduction).
Four valid limitations/uncertainties stated (see solution).
Background Concept
In a practical evaluation, you gain marks by stating limitations that are:
- specific (not just “human error”),
- linked to a particular quantity being measured,
- with a physical reason explaining why the uncertainty occurs.
Uncertainties can be random (vary trial to trial) or systematic (bias results in one direction).
Understanding the Question
You must describe four sources of uncertainty or limitations in the procedure. For any measurement uncertainty, you must name the quantity (e.g. , , , ) and explain why it is uncertain.
Approach
Choose four distinct issues covering:
- measurement difficulties (reading a scale, locating a centre, turning point),
- procedural repeatability (release point and collision alignment),
- physical non-ideal behaviour (energy losses).
Step-by-Step Reasoning
Examples of creditworthy limitations:
- (maximum height): turning point is momentary; reaction time and oscillation make the highest position hard to identify → large uncertainty in .
- (centre height of B at rest): centre is not a marked point; you estimate it from the ball diameter or by eye → uncertainty in .
- (block top height): if the ruler is not vertical or your eye is not level, parallax occurs; block top may not be perfectly horizontal → uncertainty in .
- Collision repeatability: small changes in release position or twisting of strings mean A does not always hit B at the same point → varies.
- Energy losses (systematic): air resistance, friction at support, and deformation/sound during collision reduce the kinetic energy transferred, so measured is smaller than ideal.
Any four distinct, well-explained points like the above score the marks.
Key Takeaways
- Name the quantity, then give the reason.
- Turning points and collisions are common dominant sources of uncertainty.
Common Mistakes
- Writing vague statements like “human error” or “inaccurate readings” with no quantity or reason.
- Repeating the same limitation in different words.
Things to Be Careful About
- Make sure each of the four points is genuinely different.
- Include at least one limitation about the method/physics (not just ruler reading).
Describe four improvements that could be made to this experiment. You may suggest the use of other apparatus or different procedures.
Answer
- Measure using video recording (slow motion) or a motion sensor, then determine the maximum height from the playback/data to reduce turning-point uncertainty.
- Fix a vertical metre rule and use a set square/pointer aligned with the centre of ball B to reduce parallax and improve readings of and .
- Repeat each run several times and take the mean (and hence mean ) to reduce random variation from the collision.
- Use a mechanical release (e.g. a catch) to ensure A is released from the same position each time and guide the motion so A hits B centrally (reduces variation in collision).
Four valid improvements stated (see solution).
Background Concept
An improvement should specifically address a limitation by:
- reducing random uncertainty (repeat/average, better alignment),
- reducing systematic error (better calibration, reducing losses where possible),
- improving measurement method (data logging, clearer reference marks).
Understanding the Question
You must propose four improvements to the experiment. These can involve additional apparatus or revised procedures. The best answers explicitly target the uncertainties/limitations identified in (f)(i).
Approach
Select four improvements that target the biggest problems:
- maximum-height measurement,
- parallax and identifying the centre,
- repeatability of release and collision,
- reduction of random scatter by repeats.
Step-by-Step Reasoning
Creditworthy improvements include:
- Video / data logging for : record the motion and identify the exact frame at maximum height; this removes reaction-time/turning-point judgement.
- Better scale alignment: clamp a metre rule vertical and use a set square or a fixed pointer at the ball centre height to remove parallax and provide consistent reference.
- Repeats and averaging: perform (at least) 3–5 trials for each mass configuration and use the mean (and mean ) to reduce random collision variation.
- Controlled release and central collision: use a clamp/catch release at a fixed displacement, and ensure strings are untwisted and the balls are aligned so A strikes B centrally each time.
Other valid suggestions (any four total needed): mark the centre of the balls with a pen dot; use a heavier/rigid stand to reduce movement; use longer strings to reduce relative error in height measurements.
Key Takeaways
- Improvements should be practical and clearly reduce a specific uncertainty.
Common Mistakes
- Giving improvements that are not feasible with the setup (e.g. “use a more accurate ball”).
- Stating “take more care” without describing a specific change.
Things to Be Careful About
- Avoid repeating the same improvement (e.g. “repeat more times” and “take an average”) as two separate points; treat that as one.
- Make sure each improvement clearly links to what it improves (e.g. , , collision repeatability).