Physics 9702/32 — May/June 2024
Cambridge AS Level · Advanced Practical Skills · worked solutions for every part, with the mark scheme
Topics Manipulation, Measurement and Observation · Presentation of Data and Observations · Analysis, Conclusions and Evaluation
In this experiment, you will investigate an electrical circuit.
● Connect the circuit shown in Fig. 1.1.
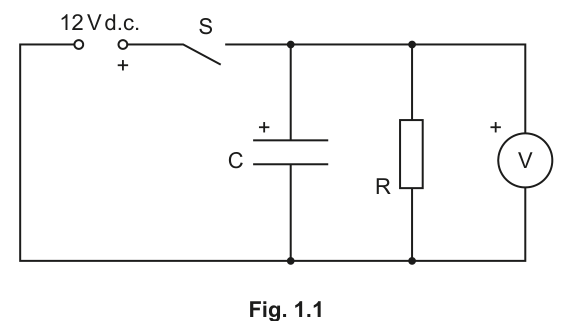
● Ensure that the polarities of the power supply, component C and the voltmeter are as shown in Fig. 1.1.
● Close switch S for a short time and then open it.
● Watch the voltmeter reading as it reduces.
When the voltmeter reading passes a value of , start the stop-watch.
When the voltmeter reading passes a value of , stop the stop-watch.
● Record the starting value and the time for the voltmeter reading to fall by .
= ______
= ______
Answer
(example, to nearest )
Example: VS = 8.00 V, T = 13.7 s
Background Concept
A capacitor that has been charged and then allowed to discharge through a resistor will show a decreasing potential difference (p.d.) across it. In this circuit, the voltmeter measures the p.d. across the capacitor (and the resistor branch, since they are in parallel).
In a practical exam, you are not being tested on getting a particular numerical value (because your component values differ), but on:
- using the apparatus correctly,
- following the timing instruction exactly (start/stop at specified voltages),
- recording values with appropriate precision.
Understanding the Question
You are told to:
- Connect the circuit as in Fig. 1.1 with the stated polarities.
- Close switch briefly (to charge the capacitor), then open it (so the capacitor discharges through ).
- Watch the voltmeter as it falls.
- Start timing when the reading passes and stop timing when it passes .
You must record:
- the start voltage (which should be ),
- the time for a drop of .
Approach
- Ensure the capacitor is charged close to the supply p.d. by closing only briefly, then opening it.
- Keep your eye on the voltmeter display and operate the stopwatch at the instants when the display passes and .
- Record exactly as stated (to because the question uses ) and record to the stopwatch resolution (typically ).
Step-by-Step Reasoning
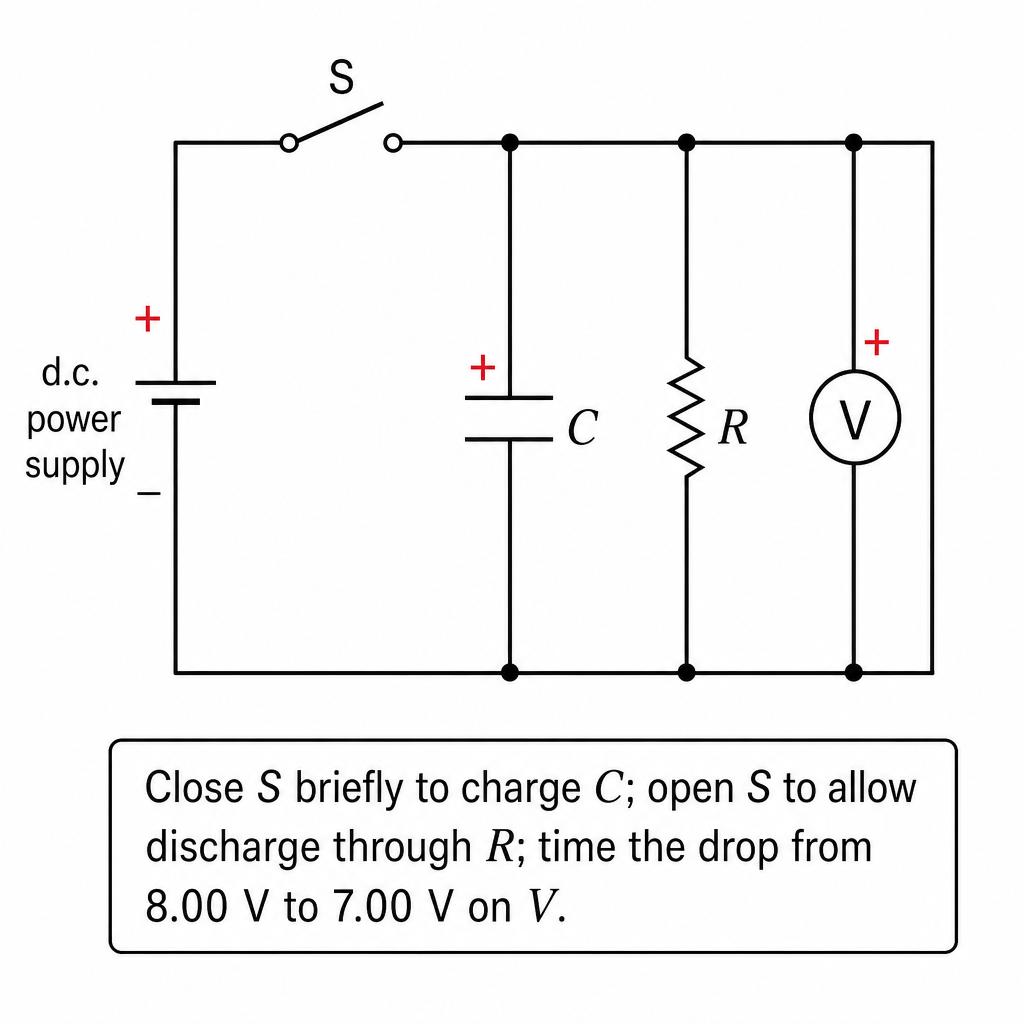
- Build the circuit exactly as shown, including polarity markings (this matters because electrolytic capacitors are polarised and must not be reversed).
- Close for a short time so that the capacitor charges.
- Open . Now the capacitor discharges through the resistor branch, so the voltmeter reading decreases.
- When the voltmeter reading passes , start the stopwatch.
- When it passes , stop the stopwatch.
- Record and the measured time (example shown in the solution).
Key Takeaways
- In Paper 3, marks often come from correct method and correct recording precision.
- “Passes a value” means you start/stop at the moment the reading crosses that value, not when it is merely close.
Common Mistakes
- Starting at instead of (loss of required precision).
- Timing from down to but accidentally stopping at or .
- Leaving the switch closed too long (may heat the resistor or cause unstable readings) or not charging enough so the reading never reaches .
Things to Be Careful About
- Record with a sensible resolution (typically ); do not overstate precision.
- Make sure the capacitor polarity is correct; reversed polarity can damage the capacitor and change results.
- Reacting time affects the measurement: try to be consistent in your start/stop technique.
Choose another starting value . Close S for a short time and then open it. Measure the time for the voltmeter reading to fall by from the starting value .
Repeat until you have six sets of values of and .
Record your results in a table. Include values of in your table.
Answer
Record six sets of and and calculate .
Example table (headings with units, consistent dp):
| 6.00 | 16.4 | 0.0610 |
| 7.00 | 14.9 | 0.0671 |
| 8.00 | 13.7 | 0.0730 |
| 9.00 | 12.7 | 0.0787 |
| 10.00 | 11.8 | 0.0847 |
| 11.00 | 11.0 | 0.0909 |
See working (table of VS, T and 1/T)
Background Concept
To test a relationship experimentally you must:
- vary an independent quantity (here the chosen starting voltage ),
- measure the dependent quantity (here the time for a drop),
- take enough readings over a good range to reveal any trend,
- calculate any required derived values (here ) and present everything clearly.
A good results table is a major source of marks in Paper 3.
Understanding the Question
You must choose different starting values and, for each one, measure the time for the voltmeter reading to fall by (from to ). You need six pairs .
You must then present the results in a single table and include a third column for .
Approach
- Choose a sensible range of values that are achievable during the discharge (e.g. several values between about and ).
- For each :
- charge the capacitor by closing briefly,
- open and time the drop from to .
- Keep technique consistent (same observer position, same way of starting/stopping the stopwatch).
- Calculate for each row and record it to an appropriate number of significant figures.
Step-by-Step Reasoning
- Selecting : If you choose values too close together, the graph trend is hard to see; if you choose values too near the supply limit or too low, you may not be able to start/stop cleanly at the required voltages.
- Recording precision:
- Because the question specifies , the voltmeter is effectively read to , so record all values to .
- A handheld stopwatch is typically read to , so record all values to .
- Derived column:
- For each row compute .
- The unit of is .
- Quote to typically 3 significant figures (or consistent dp) so the column is uniform.
A clear table must have:
- headings with quantity and unit, e.g. ,
- consistent decimal places within each column,
- all six rows present.
Key Takeaways
- Six readings over a sensible range is necessary to support a straight-line graph.
- A correct table has clear headings, units, consistent precision, and correctly calculated derived values.
Common Mistakes
- Omitting units in headings (e.g. writing just instead of ).
- Mixing decimal places in the same column (e.g. , , ).
- Calculating but forgetting the unit .
- Not taking enough readings (fewer than six rows).
Things to Be Careful About
- Make sure each measurement of corresponds to exactly a drop.
- Do not round too early before calculating ; calculate using your recorded then round appropriately.
- Keep values within the region where the capacitor actually passes through them during discharge (so you can start/stop cleanly).
Answer
Plot (in ) on the -axis against (in ) on the -axis using a sensible scale and all six data points.
Graph of 1/T against VS plotted
Background Concept
When you are asked to plot a graph of one quantity against another, you must:
- put the stated quantity on the stated axis,
- label each axis with both the symbol and the unit,
- choose a scale that spreads the points out (usually using at least half the grid in each direction),
- plot each point accurately.
These are routine Paper 3 marks.
Understanding the Question
You have a table containing and and you have calculated .
You must plot a graph with:
- horizontal axis: (unit V),
- vertical axis: (unit ).
Approach
- Decide suitable axis ranges based on your smallest and largest and .
- Use simple scales (e.g. 1 big square = 0.5 V or 1 V; 1 big square = 0.005 , etc.) that make plotting easy.
- Plot all six points with small, neat crosses.
Step-by-Step Reasoning
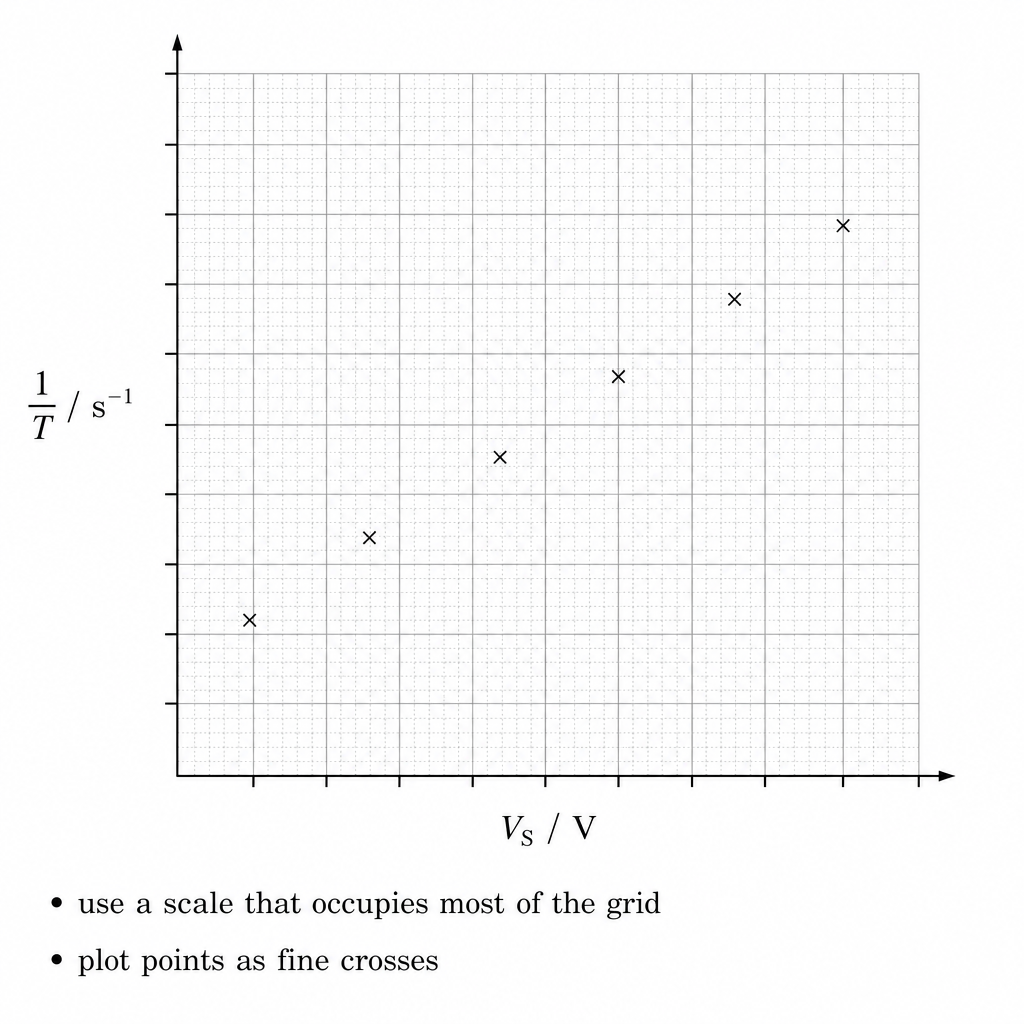
- Draw axes and label them:
- -axis:
- -axis:
- Choose scales:
- Avoid awkward scales like 3 squares = 1 unit.
- Ensure data fills a large part of the grid.
- Plot each point :
- Read off carefully using the grid.
- Use a sharp pencil and fine crosses; do not use large dots.
Key Takeaways
- Correct axis labels and sensible scales are as important as the points themselves.
- Plot exactly what is requested: vs , not vs .
Common Mistakes
- Swapping axes (plotting on instead of ).
- Missing units in axis labels.
- Using a tiny part of the grid (wastes resolution and reduces accuracy).
- Plotting instead of .
Things to Be Careful About
- If values are close together, choose a -axis scale that spreads them.
- Start axes at zero only if it helps; it is acceptable to use a non-zero origin if clearly marked and it improves spread.
Answer
Draw one straight line of best fit (balanced about the points).
Straight line of best fit drawn
Background Concept
In experimental graphs, points usually show small scatter due to measurement uncertainty. A best-fit line represents the overall trend.
For a straight-line trend, the best-fit line should be drawn so that:
- it follows the trend of the points,
- roughly equal numbers of points lie above and below the line,
- it is not drawn dot-to-dot.
Understanding the Question
You have plotted against . You must now draw the straight line that best represents the trend.
Approach
- Use a ruler.
- Ignore small deviations of individual points.
- Make the line long (use most of the plotted region), because this improves later gradient/intercept accuracy.
Step-by-Step Reasoning
- Place the ruler so the line passes through the "middle" of the scatter of points.
- Adjust so that the line is balanced (not forced through every point).
- Draw a single, thin straight line.
Key Takeaways
- Best-fit means balanced trend, not joining points.
- A long line improves the accuracy of gradient and intercept.
Common Mistakes
- Dot-to-dot joining.
- Forcing the line through an outlier.
- Drawing a short line segment only near one or two points.
Things to Be Careful About
- If one point is clearly anomalous, the best-fit line should still follow the main trend of the other points (unless the exam specifically asks you to justify excluding it).
Determine the gradient and -intercept of this line.
gradient = ______
-intercept = ______
Working
Using two well-separated points on the best-fit line (example):
-intercept (example) from :
Answer
gradient
-intercept
gradient = 6.0×10^-3 s^-1 V^-1, y-intercept = 2.5×10^-2 s^-1 (example)
Background Concept
For a straight-line graph of against , the equation is
where:
- is the gradient (slope),
- is the -intercept.
From a plotted best-fit line:
- gradient is found using two points on the line and
- -intercept is the value of when (where the line crosses the -axis), or can be calculated using .
Understanding the Question
You have a graph of (vertical) against (horizontal) with a best-fit straight line. You must determine:
- the gradient of the line,
- the -intercept.
These values will be used again in part (d).
Approach
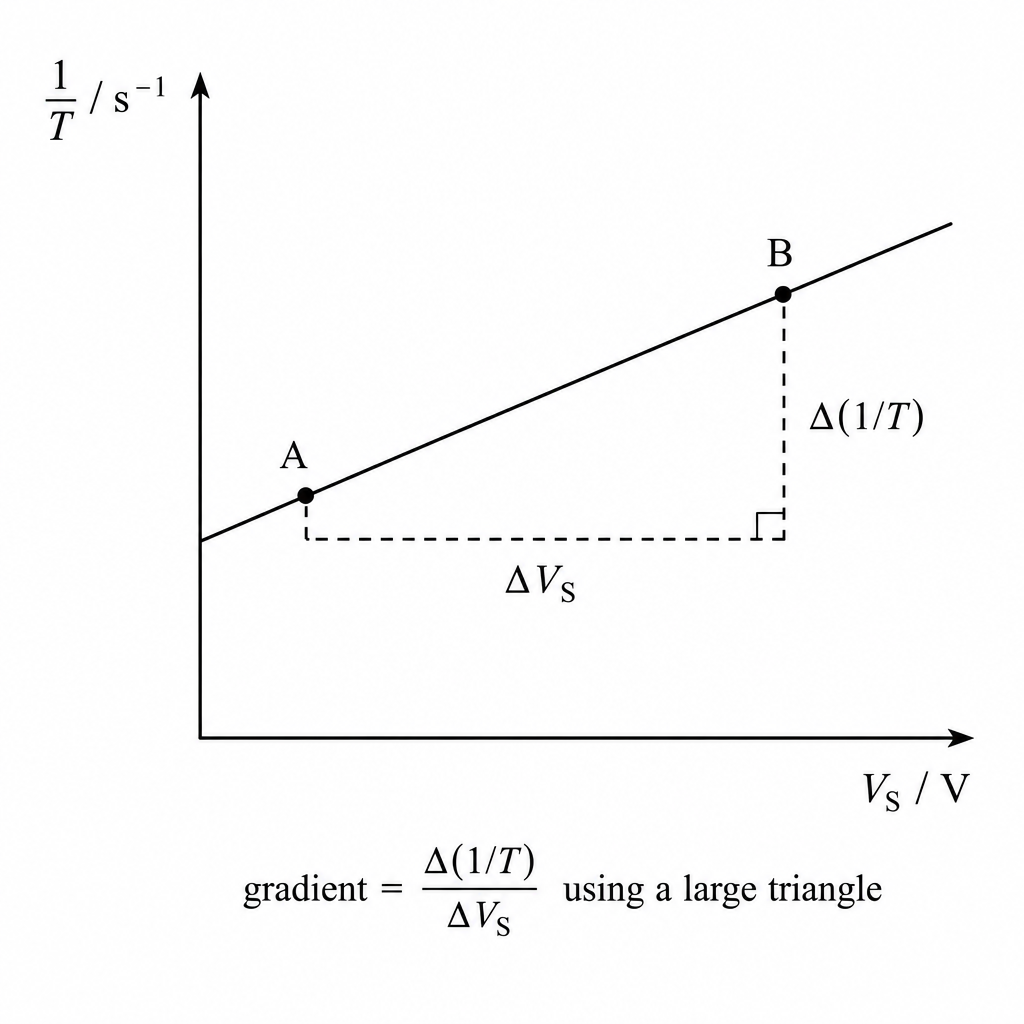
- Choose two points on the best-fit line (not necessarily measured points) that are far apart to reduce percentage uncertainty.
- Read their coordinates accurately.
- Compute gradient using .
- Find the intercept either by reading off at or by substituting one point into .
Step-by-Step Reasoning
- Pick two widely separated points on the line, e.g. at the left and right side of the plotted region.
- Read values to the same precision as your axis scale allows, and read values likewise.
- Compute changes:
- , unit
- , unit V
- Gradient:
So the unit is:
- Intercept:
- If the axis includes , read where the line crosses the -axis.
- If not, calculate using with one point.
The numerical example in the solution shows one valid method.
Key Takeaways
- Use a large triangle on the best-fit line to reduce uncertainty.
- Gradient must be , not .
- Always include units for gradient and intercept.
Common Mistakes
- Using two nearby points (gives a large percentage uncertainty in gradient).
- Using data points that are not on the line (instead of points on the drawn line).
- Calculating by mistake.
- Forgetting that the intercept has units of .
Things to Be Careful About
- Read coordinates from the line with care; small reading errors can strongly affect the gradient.
- Keep sufficient significant figures during the calculation, then round sensibly at the end.
- Make sure your line is thin; a thick line increases reading uncertainty.
It is suggested that the quantities and are related by the equation
where and are constants.
Using your answers in (c)(iii), determine the values of and .
Give appropriate units.
= ______
= ______
Working
Given
Comparing with for graph of against :
Units:
Answer
a = gradient (s^-1 V^-1), b = y-intercept (s^-1)
Background Concept
A straight-line graph is described by
If you plot against , then:
- gradient is the coefficient of ,
- intercept is the value of when .
Here the suggested relationship is
So it is already in straight-line form.
Understanding the Question
You have already obtained:
- gradient of the graph of vs ,
- -intercept of the same graph.
You must use these to state numerical values for and with appropriate units.
Approach
- Identify and for your plotted graph.
- Compare term-by-term with the given equation.
- Copy the gradient as and the intercept as .
- Work out units from the units of and .
Step-by-Step Reasoning
- Your graph uses:
- with unit ,
- with unit V.
- Compare
with
Therefore:
- corresponds to the gradient .
- corresponds to the intercept .
- Units:
- Since must have the same unit as ,
- Since is added directly to ,
- Substitute your measured gradient and intercept values (example shown in the solution).
Key Takeaways
- For a plot of against , gradient gives the coefficient of and intercept gives the constant term.
- Units of gradient come from .
Common Mistakes
- Giving the wrong unit (e.g. instead of ).
- Using the gradient of the wrong graph (e.g. if axes were swapped earlier).
- Confusing with the -intercept (it is the -intercept).
Things to Be Careful About
- Ensure you are using the gradient and intercept from the best-fit line, not from two raw data points.
- Quote and to sensible significant figures consistent with your graph-reading precision.
In this experiment, you will investigate the equilibrium of a wooden rod.
● Assemble the apparatus as shown in Fig. 2.1.
● Adjust the apparatus so that the wooden rod is parallel to the bench and the spring is vertical.
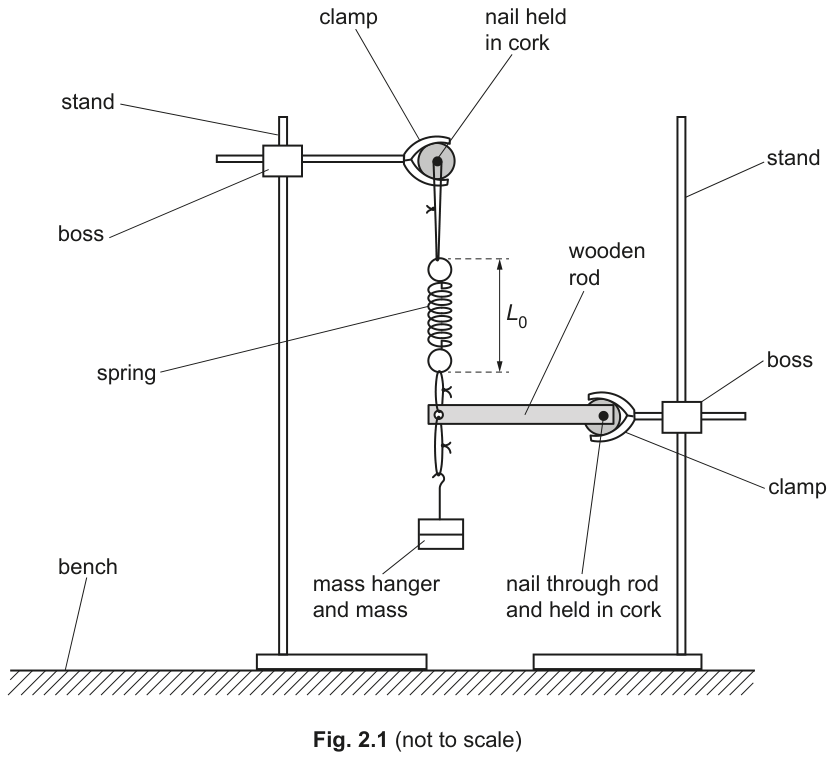
● The distance between the ends of the spring is , as shown in Fig. 2.1.
Measure and record .
= ______
Answer
Example measurement (student-dependent):
L0 ≈ 0.120 m (example; student-dependent)
Background Concept
A length measurement must be taken between two clearly defined reference points, using an instrument of known resolution (e.g. a metre rule). The recorded value should match the instrument precision (typically to the nearest mm, i.e. ).
Understanding the Question
You have a spring supporting one end of a rod. is the distance between the two ends of the spring when the spring is vertical and the rod is horizontal. You must measure and record in metres.
Approach
- Make sure the rod is parallel to the bench and the spring is vertical (as instructed).
- Use a metre rule to measure the separation between the top and bottom ends of the spring.
- Record in to a suitable number of decimal places.
Step-by-Step Reasoning
- Place the metre rule alongside the spring.
- Align the zero (or a clear scale mark) with one end of the spring, and read the position of the other end.
- Avoid parallax by viewing the scale perpendicularly.
- Convert to metres if necessary and record, e.g. .
Key Takeaways
- Measure between correct reference points.
- Record with a unit and appropriate precision.
Common Mistakes
- Measuring the spring along a slanted line (when it is not vertical) or using the wrong endpoints.
- Not giving a unit, or recording to an unrealistic precision (e.g. too many decimal places).
Things to Be Careful About
- Ensure the spring is vertical before measuring.
- Keep the metre rule parallel to the spring to reduce systematic error.
- Read at eye level to minimise parallax.
● Pull the mass hanger down a short distance and then release it. The mass hanger will oscillate.
● Take measurements to find the period of the oscillations.
= ______
Working
Time oscillations (repeat and average):
,
Mean time for oscillations:
Period:
Answer
T ≈ 0.630 s (example; student-dependent)
Background Concept
The period is the time for one complete oscillation. Using a stopwatch, reaction time makes timing a single oscillation inaccurate, so you time oscillations (with or ) and divide by :
Repeating timings and averaging reduces random uncertainty.
Understanding the Question
You pull the mass hanger down slightly and release it so it oscillates. You must obtain from measurements (not from theory), so the mark is for good technique: timing several oscillations, repeating, and calculating .
Approach
- Choose a clear reference point (e.g. the lowest point of motion).
- Time oscillations with a stopwatch.
- Repeat at least once.
- Average the times and divide by to get .
Step-by-Step Reasoning
- Start timing as the mass passes the reference point in a chosen direction.
- Count complete cycles and stop when the mass returns to the same point moving in the same direction.
- Example readings: and .
- Average: .
- Divide by :
Key Takeaways
- Time many oscillations, not one.
- Repeat and average to improve reliability.
Common Mistakes
- Timing only one oscillation (large percentage reaction-time error).
- Not counting complete oscillations correctly.
- Stopping at a different point in the cycle (e.g. not matching direction).
Things to Be Careful About
- Keep the amplitude small so the motion stays close to simple harmonic motion.
- Avoid pushing the mass sideways (which can introduce extra motion and affect timing).
- Use consistent significant figures for the stopwatch readings.
● Calculate the value of the spring constant using
where .
= ______
● Justify the number of significant figures that you have given for your value of .
Working
Using
with and :
Significant figures: is measured to (and is ), so quote to .
Answer
(to )
k ≈ 19.9 N m^-1 (example; student-dependent)
Background Concept
When a quantity is calculated from measurements, the result should be quoted to a sensible number of significant figures, usually based on the least precise measured quantity used in the calculation.
Here, is obtained from the given relationship:
where is provided and is measured.
Understanding the Question
You must (1) calculate using your measured , and (2) justify the significant figures in your value of . The justification is about measurement precision, not about “how many digits look nice”.
Approach
- Substitute and your measured into the given formula.
- Calculate and include units.
- Decide the significant figures by looking at the precision of (and ).
Step-by-Step Reasoning
- With and (example) :
- Numerically, and , so:
- Significant figures: if is recorded as then is , and is also , so quoting to is consistent.
Key Takeaways
- Use the provided equation exactly.
- Always include units.
- Significant figures should reflect measurement precision.
Common Mistakes
- Giving too many significant figures (implying unrealistic precision).
- Forgetting units for .
- Using for one oscillation timed poorly, leading to an unreliable .
Things to Be Careful About
- Because , any percentage uncertainty in roughly doubles in ; this is another reason not to over-quote digits.
- Ensure is in seconds before substitution.
● Move the stand supporting the spring away from the other stand and add the plumb line, as shown in Fig. 2.2.
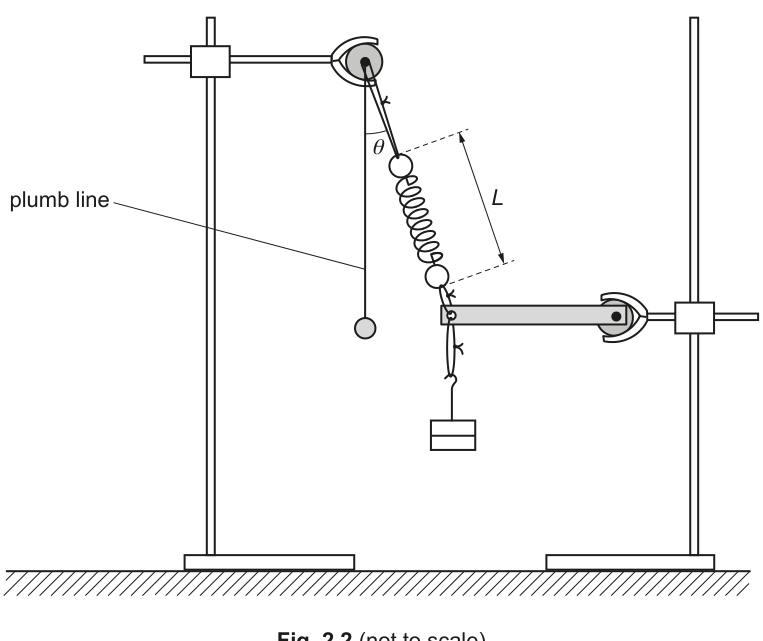
● Adjust the apparatus so that the angle between the spring and the vertical is approximately and the wooden rod is parallel to the bench, as shown in Fig. 2.2.
● The new distance between the ends of the spring is , as shown in Fig. 2.2.
Measure and record .
= ______
● Measure and record .
= ______
Answer
Example measurements (student-dependent):
L ≈ 0.135 m, θ ≈ 20° (example; student-dependent)
Background Concept
A plumb line gives a true vertical reference. The angle is the angle between the spring and the vertical, so it should be measured between the spring and the plumb line (not between the spring and the rod).
The spring length should be measured along the spring between its endpoints.
Understanding the Question
You move the stand so the spring is no longer vertical, then set while keeping the rod parallel to the bench. You must record:
- (new spring length)
- (angle between spring and vertical)
Approach
- Adjust stand position until the spring makes about to the vertical (use the plumb line).
- Re-adjust until the rod is horizontal.
- Measure along the spring, and measure with a protractor against the vertical reference.
Step-by-Step Reasoning
- Hang the plumb line from the top support so it hangs freely and is clearly visible.
- Place a protractor so its centre is at (or close to) the top end of the spring and align the line with the plumb line.
- Read the angle to the line of the spring (estimate to nearest degree).
- Measure with a metre rule by aligning along the spring and reading endpoint-to-endpoint.
- Example: , .
Key Takeaways
- Use the plumb line as the vertical reference.
- Measure along the spring, not as a horizontal or vertical separation.
Common Mistakes
- Measuring from the horizontal rod instead of the vertical.
- Measuring as a vertical drop rather than the spring’s actual length.
Things to Be Careful About
- Ensure the rod is parallel to the bench before taking readings.
- Reduce parallax when reading a protractor and ruler.
- Let the system settle (no oscillations) before measuring.
Estimate the percentage uncertainty in your value of . Show your working.
percentage uncertainty = ______
Working
Take angle reading uncertainty as .
For :
Answer
percentage uncertainty
5%
Background Concept
Percentage uncertainty is
For an angle measured with a typical protractor, a common estimate for absolute uncertainty is about (you may justify this from the smallest scale division and alignment limits).
Understanding the Question
You must estimate the percentage uncertainty in your measured (from part (b)(i)) and show working. The experiment uses a plumb line and protractor, so the limiting factor is usually reading/alignment to the nearest degree.
Approach
- Choose a sensible absolute uncertainty for (e.g. ).
- Substitute into the percentage-uncertainty formula using your measured .
Step-by-Step Reasoning
- Suppose the protractor reading is to the nearest degree, so absolute uncertainty is .
- If :
Key Takeaways
- Percentage uncertainty scales inversely with the size of the measured angle.
- Always show the formula and substitution.
Common Mistakes
- Using instead of .
- Dividing by the wrong value (e.g. using when the angle was ).
Things to Be Careful About
- Your chosen absolute uncertainty should match your instrument and reading method.
- Quote the final percentage uncertainty sensibly (often to 1 s.f. is acceptable).
Answer
Example measurements (student-dependent):
L ≈ 0.160 m, θ ≈ 45° (example; student-dependent)
Background Concept
Collecting data at more than one value of the independent variable (here, ) allows you to test whether a proposed relationship holds across a range.
Understanding the Question
You repeat the procedure of (b)(i), but now adjust the setup so that is approximately . You must measure and record the corresponding spring length and the angle .
Approach
- Move/adjust the stand so the spring makes about to the vertical (using the plumb line).
- Re-check the rod is parallel to the bench.
- Measure along the spring and record .
Step-by-Step Reasoning
- Adjust until is close to .
- Let oscillations die away.
- Measure between spring ends along the spring.
- Read between the spring and the plumb line.
- Example: , .
Key Takeaways
- Take measurements at a second, substantially different angle to test the model.
- Keep measurement precision consistent with earlier readings.
Common Mistakes
- Forgetting to keep the rod horizontal when changing .
- Recording as the angle to the horizontal rather than to the vertical.
Things to Be Careful About
- Ensure the plumb line is not swinging when you read the angle.
- Use the same precision for as before (e.g. if using a mm scale).
It is suggested that the relationship between and is
where and is a constant.
Using your data, calculate two values of .
first value of = ______
second value of = ______
Working
From
Using example data: , , .
For , :
For , :
Answer
first value of
second value of
D ≈ 2.16 N and 1.98 N (example; student-dependent)
Background Concept
When a relationship contains a constant (here ), you can test it by calculating from different sets of measurements. If the relationship is correct, the calculated values of should agree within experimental uncertainty.
Given:
You rearrange to make the subject:
Understanding the Question
You have measured and for two angles (about and ), and you already have and from part (a). You must use these to compute two values of the constant .
Approach
- Rearrange the given equation to .
- For each data set (each ), substitute , , , , and .
- Calculate twice.
Step-by-Step Reasoning
- Start from
- Multiply both sides by :
- Now use your measured values.
- Example using earlier sample numbers:
- , , .
- For , :
- For , :
(Your own values will differ because your measurements differ.)
Key Takeaways
- Rearranging correctly is crucial before substituting data.
- Comparing the computed constant from two trials is a basic consistency check.
Common Mistakes
- Using (incorrect rearrangement).
- Forgetting that uses in degrees on a calculator set to degree mode.
- Mixing units (e.g. using in cm while is in ).
Things to Be Careful About
- Convert all lengths to before using in .
- Keep consistent significant figures (your result cannot be more precise than your measured and ).
It is suggested that the percentage uncertainty in the values of is .
Using this uncertainty, explain whether your results support the relationship in (c).
Working
Example values: and .
Percentage difference:
Since , the two values agree within the stated uncertainty.
Answer
Yes. The calculated values of are consistent within , so the results support the relationship.
Supports the relationship (values agree within 10%).
Background Concept
To decide whether two experimental values agree, you compare their difference with the uncertainty. If the stated percentage uncertainty is , then results that differ by less than about are usually considered consistent (given the level of the uncertainty statement).
A convenient check is the percentage difference:
Understanding the Question
You have two values of from part (c). The question tells you the percentage uncertainty in the values of is . You must use this to state whether your results support the suggested relationship.
Approach
- Find how far apart and are (absolute difference).
- Convert that to a percentage difference (relative to a representative value, often the mean).
- If the percentage difference is , conclude the results support the relationship; otherwise they do not.
Step-by-Step Reasoning
- Using example values and :
- Mean value:
- Percentage difference:
- Since is less than the stated , the difference is within the uncertainty, so the data are consistent with the relationship.
Key Takeaways
- A model is supported if values calculated from different trials agree within experimental uncertainty.
Common Mistakes
- Comparing the absolute difference in directly to (different types of quantity).
- Using or without stating what you are doing; mean is the clearest.
Things to Be Careful About
- The uncertainty is itself an estimate; your conclusion should be phrased appropriately (e.g. “support” / “consistent with”, not “proves”).
Describe four sources of uncertainty or limitations of the procedure for this experiment.
For any uncertainties in measurement that you describe, you should state the quantity being measured and a reason for the uncertainty.
Answer
Any four, e.g.
- (and ) reading uncertainty: ends of the spring are not sharply defined / coils obscure exact endpoints, so length reading is uncertain.
- Parallax in (and ): metre rule and spring may not be in the same plane; eye not normal to scale gives a reading error.
- measurement uncertainty: difficult to align protractor with the plumb line and the spring; thickness of spring and plumb line makes the angle ambiguous.
- Timing : human reaction time starting/stopping stopwatch and deciding the exact same point in the oscillation causes random uncertainty (especially if damping occurs).
(Other valid limitations: rod not perfectly horizontal each time; pivot friction / movement at supports; oscillations not purely vertical.)
See working (four sources of uncertainty/limitations listed).
Background Concept
In practical exams, “uncertainty/limitations” marks are awarded for specific, physics-based issues that affect measurements. For measurement uncertainties you should:
- name the quantity (e.g. , , )
- state why it is uncertain (e.g. parallax, poor definition of reference points, reaction time)
A limitation is a feature of the method that restricts accuracy/validity (e.g. only two angles, difficulty maintaining equilibrium conditions).
Understanding the Question
You must give four sources of uncertainty or limitations in this procedure. For any measurement uncertainty, you must state the measured quantity and the reason.
Approach
Think through each measured quantity in the experiment:
- and (length measurements)
- (angle measurement)
- (timing)
Then add any procedural limitations (keeping rod horizontal, pivot friction, movement of supports).
Step-by-Step Reasoning
Examples of four good points:
- Uncertainty in and (endpoints): the “end of the spring” may be hard to define because the hooks/coils are curved and the attachment points are bulky, so the measured length depends on judgement.
- Parallax in and : if the metre rule is not in the same plane as the spring, or your eye is not perpendicular to the scale, the reading shifts.
- Uncertainty in : aligning the protractor with the plumb line and the axis of the spring is difficult; both have thickness so there is not a single precise line to measure from.
- Uncertainty in (stopwatch timing): reaction time and deciding the exact instant a cycle completes introduce random errors; damping can make the “same point” harder to judge.
Other acceptable limitations (if needed): keeping the rod exactly parallel to the bench for each reading is difficult; supports may slip; pivot friction may change the equilibrium slightly.
Key Takeaways
- State the quantity and the cause.
- Be specific (what is hard to see/align/judge).
Common Mistakes
- Writing vague phrases like “human error” without stating what measurement it affects.
- Repeating the same point in different words (e.g. parallax twice as two separate uncertainties without a genuinely different context).
Things to Be Careful About
- Each of the four points should be distinct.
- Focus on uncertainties that genuinely affect the measured values used later (, , , , hence and ).
Describe four improvements that could be made to this experiment. You may suggest the use of other apparatus or different procedures.
Answer
Any four, e.g.
- Improve timing of : use a light gate/data logger (or video analysis) to obtain the period automatically and remove reaction-time error.
- Improve and measurement: attach a pointer at each spring end and read against a fixed vertical scale (or use a set square to transfer positions to a ruler) to reduce parallax and define endpoints.
- Improve measurement: use a larger/digital protractor or angle sensor fixed at the top attachment so the angle to the vertical is read more precisely.
- Improve reliability/validity: take more than two values of (e.g. to ) with repeats, so can be checked over a wider range rather than just two points.
(Other valid improvements: use a spirit level to ensure rod horizontal; clamp supports more rigidly to prevent slipping.)
See working (four improvements listed).
Background Concept
An improvement should directly reduce a named uncertainty/limitation or increase the reliability of the conclusion. Strong improvements either:
- change the instrument (better resolution, remove subjective judgement), or
- change the method (more repeats, wider range, better control of variables).
Understanding the Question
You must describe four improvements. These can be new apparatus or altered procedures. The best answers clearly link each improvement to an uncertainty/limitation from (e)(i).
Approach
Match improvements to the main problem areas:
- timing
- measuring lengths
- measuring angle
- limited data / poor control of equilibrium conditions
Step-by-Step Reasoning
Four good improvements (with why they help):
- Light gate / data logger for : records times precisely and consistently, removing human reaction time and judgement of cycle completion.
- Fixed scale with pointers for and : if pointers mark the endpoints and a fixed scale is read, endpoints are clearer and parallax is reduced compared with holding a rule next to a spring.
- Better angle measurement: a large/digital protractor, or an angle sensor mounted at the top support, gives a clearer reference and finer resolution than estimating with a small handheld protractor.
- More angles and repeats: using several values of and repeating each measurement allows you to check whether is constant over a range and to average out random scatter.
Additional sensible improvements include using a spirit level to ensure the rod is horizontal and improving clamping to prevent slipping.
Key Takeaways
- Improvements should be practical and targeted.
- Link each to a specific uncertainty/limitation.
Common Mistakes
- Suggesting vague improvements like “be more careful” without stating what to change.
- Proposing unrealistic apparatus that does not measure the required quantity.
Things to Be Careful About
- Do not repeat the same improvement in different words.
- Ensure each improvement is feasible within a school laboratory context and clearly affects , , , or (and hence and ).