Physics 9702/31 — May/June 2024
Cambridge AS Level · Advanced Practical Skills · worked solutions for every part, with the mark scheme
Topics Manipulation, Measurement and Observation · Presentation of Data and Observations · Analysis, Conclusions and Evaluation
In this experiment, you will investigate an electrical circuit.
You have been provided with a metre rule with a wire attached. You have also been provided with six identical resistors. Four of the resistors are connected in series and attached to a wooden block. The other resistors are labelled X and Z.
● Set up the circuit shown in Fig. 1.1.
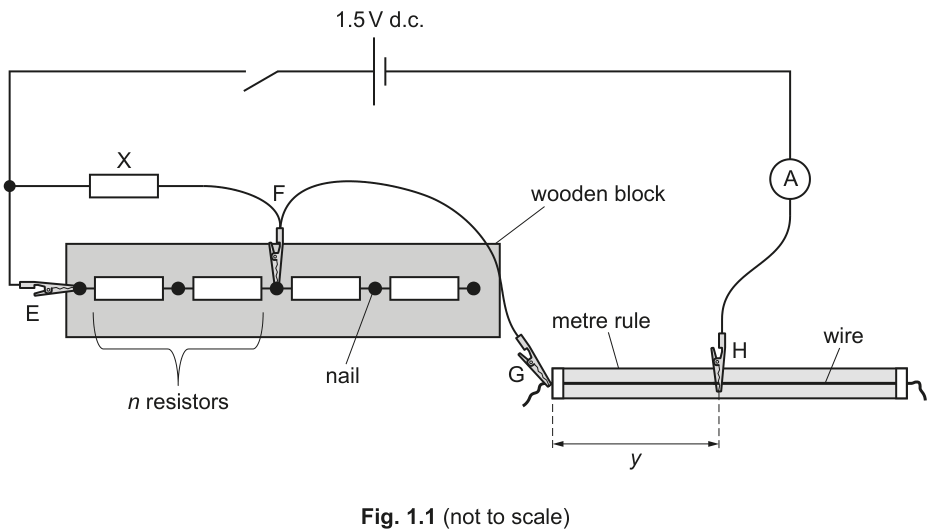
● E, F, G and H are crocodile clips.
resistors on the wooden block are connected in parallel with X. Connect F so that , as shown in Fig. 1.1.
● The distance between G and H is . Attach H to the wire so that is approximately .
● Close the switch.
● Record , and the ammeter reading .
= ______
= ______
= ______
● Open the switch.
Answer
(Example of acceptable recorded readings)
Example: n = 2, y = 48.0 cm, I = 0.130 A
Background Concept
In this practical you are adjusting a circuit and taking direct measurements:
- is the effective number of identical resistors on the block that are connected in parallel with resistor (set by the position of crocodile clip ).
- is the length of resistance wire between clips and , measured on the metre rule.
- is the circuit current measured by the ammeter in series.
Changing changes the effective resistance of one part of the circuit; changing changes the resistance of the wire section (longer wire (\Rightarrow) larger resistance). Both changes affect the total circuit resistance and therefore the current.
Understanding the Question
You are told exactly how to set up the circuit (Fig. 1.1), then to:
- fix using clip ,
- set by placing about half-way along the wire from ,
- close the switch and record , and the ammeter reading .
The marks are for taking sensible readings and recording them clearly, with appropriate precision.
Approach
- Build the circuit exactly as in the diagram.
- Ensure the ammeter is in series and reads steady.
- Measure directly on the metre rule between the positions of and .
- Record values neatly (and with consistent significant figures / decimal places for measured quantities).
Step-by-Step Reasoning
- Place clip at the position that makes (as indicated in Fig. 1.1: two resistors on the block are in parallel with ).
- Attach clip so that the distance from to along the wire is about .
- Close the switch and wait briefly for the current to stabilise.
- Read the ammeter to its available resolution (typically to 2–3 s.f., depending on the meter).
- Record:
- as an exact value (here, 2)
- to the nearest mm (or nearest 0.1 cm) if using a metre rule scale
- to the meter’s resolution.
Key Takeaways
- Follow circuit diagrams accurately.
- Length measurements should match the instrument resolution.
- Ammeter readings should be recorded with sensible significant figures.
Common Mistakes
- Measuring from the wrong reference point (not from to ).
- Recording with unrealistic precision (e.g. many decimal places from a metre rule).
- Forgetting to open the switch between adjustments, causing heating of the wire and drifting readings.
Things to Be Careful About
- Ensure crocodile clips make good contact; poor contact changes resistance and makes unstable.
- Avoid parallax error when reading on the metre rule.
- Keep close to for this first reading as instructed; do not optimise it yet.
● Connect Z as shown in Fig. 1.2.
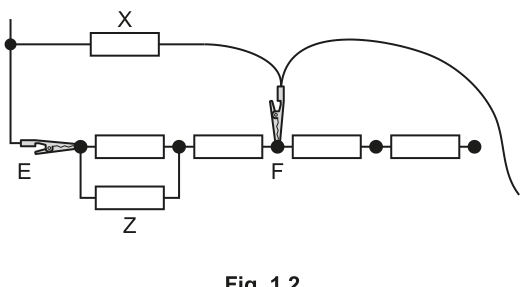
When Z is connected in parallel with the first of the resistors on the block, the total value of is reduced by 0.5.
For the arrangement in Fig. 1.2, the value of is 1.5.
● Close the switch.
● Change the position of H on the wire until the value of is as close as possible to your value in (a).
● Record and .
= ______
= ______
● Open the switch.
● Disconnect Z.
Answer
(Example of acceptable recorded readings)
Example: n = 1.5, y = 50.8 cm
Background Concept
If you want the current to be the same, then the total circuit resistance must be the same (since the supply p.d. is fixed). In this experiment you change part of the circuit (by adding resistor in parallel with the first resistor on the block), which changes the effective resistance of that section.
To restore the original current, you compensate by changing , which changes the resistance of the wire section.
Understanding the Question
You are instructed to connect resistor as in Fig. 1.2. This makes the effective value of smaller by 0.5 (because one identical resistor in parallel with another identical resistor halves that resistor’s resistance, i.e. it behaves like “half a resistor” in series-count terms).
For this arrangement, . You then move clip until the ammeter reading is as close as possible to your value in (a), and record and .
Approach
- Add exactly as shown.
- Close the switch.
- Slide along the wire, watching the ammeter, until matches the part (a) current.
- Record the final when the match is best.
Step-by-Step Reasoning
- Connect in parallel with the first resistor on the block (between the appropriate nodes shown).
- Set (given for this configuration).
- Close the switch and note whether is higher or lower than in (a).
- Move slightly:
- Increasing increases the wire resistance, tending to reduce .
- Decreasing decreases the wire resistance, tending to increase .
- Iterate until the ammeter reading is as close as possible to the part (a) value.
- Measure and record at this position.
Key Takeaways
- Matching a target current is done by adjusting the variable resistance (here, wire length).
- When a circuit is altered, you can compensate by changing another resistance to keep constant.
Common Mistakes
- Recording before the current is matched.
- Forgetting that changing affects resistance (and therefore current).
- Not disconnecting $Z afterwards (the instruction says to disconnect it for later parts).
Things to Be Careful About
- Heating of the wire can change its resistance; keep the switch closed only while adjusting.
- Make sure the “best match” is judged with a steady reading (wait for fluctuations to settle).
Vary by changing the position of F and connecting and disconnecting Z.
For each value of , change the position of H until the value of is as close as possible to your value in (a).
Repeat until you have six sets of values of and . Include your values from (a) and (b).
Record your results in a table. Include values of to two significant figures in your table.
Answer
(Example of a correctly formatted table with six sets of values)
Target current: (from part (a))
| (2 s.f.) | ||
|---|---|---|
| 0.5 | 62.0 | 0.33 |
| 1.0 | 55.0 | 0.50 |
| 1.5 | 50.8 | 0.60 |
| 2.0 | 48.0 | 0.67 |
| 2.5 | 46.0 | 0.71 |
| 3.0 | 44.5 | 0.75 |
See table (six sets of n, y and n/(n+1) to 2 s.f.).
Background Concept
A good results table in Paper 3 must:
- contain all results in one clear table,
- have correct column headings with quantity and unit (units only for quantities that have units),
- use consistent raw-data precision (e.g. to nearest 0.1 cm),
- include calculated quantities to the required significant figures.
Here, you are asked to calculate
for each row and give it to two significant figures.
Understanding the Question
You must obtain six pairs of values such that, for each chosen , you adjust until the current matches the value found in part (a). You then tabulate the results, including your part (a) and (b) readings.
So:
- Independent variable: (you choose by moving and adding/removing ).
- Dependent variable you record: (the length required to keep at the target).
- Control/target: kept the same as in (a).
Approach
- Pick a sensible spread of values (not all close together).
- For each , move until the ammeter matches the target current.
- Record each time.
- Calculate for each row and round to 2 s.f.
Step-by-Step Reasoning
- Decide on six settings. Typical available values are depending on clip positions and whether is connected.
- For each :
- connect/disconnect as required,
- set clip to the desired tap,
- close the switch,
- slide until matches the part (a) value,
- measure from to and record it.
- Calculate the derived column. Example for :
- Ensure table conventions:
- has no unit.
- has a unit (cm or m, but be consistent).
- has no unit.
- Use consistent decimal places within a column where appropriate.
Key Takeaways
- Collect a range of data points (six sets) for a reliable graph.
- Derived quantities must be calculated correctly and rounded as instructed.
- Tables must have clear headings and units.
Common Mistakes
- Forgetting to include the derived column or not using 2 s.f.
- Mixing units (some in cm, others in m) or not stating the unit in the heading.
- Using inconsistent precision (e.g. some values to 0.1 cm and others to 1 cm).
- Not actually matching to the target current before recording .
Things to Be Careful About
- Write values to 2 s.f. exactly as requested (e.g. , not ).
- Keep the switch closed only as long as needed to avoid heating (which changes resistances and shifts ).
Answer
Graph plotted with:
- -axis: (no unit)
- -axis:
- suitable scales using at least half the grid
- all six points plotted accurately.
Graph of y (y-axis) against n/(n+1) (x-axis) plotted.
Background Concept
A good experimental graph should:
- have axes labelled with quantity and unit (unit omitted if dimensionless),
- use a sensible linear scale (no awkward jumps),
- use at least half the graph paper in both directions,
- show plotted points clearly (small crosses or dots with circles),
- plot the dependent variable on the -axis and independent on the -axis.
Understanding the Question
You are told exactly what to plot:
- vertical axis: ,
- horizontal axis: .
So you must transfer your table values onto graph paper with correct presentation.
Approach
- Put the calculated values of on the -axis.
- Put the measured on the -axis (use the same unit as in your table).
- Pick scales that spread the data across the page.
Step-by-Step Reasoning
- Determine the range of your data:
- will lie between 0 and 1 (often around 0.3 to 0.8 in this experiment).
- will be around tens of cm.
- Choose axis limits slightly beyond your smallest and largest values, so all points fit comfortably.
- Mark equal intervals and write numbers at regular spacing.
- Plot each point from the table carefully.
Key Takeaways
- Correct axis labelling and sensible scales are essential for graph marks.
- Accuracy in plotting affects your later gradient/intercept.
Common Mistakes
- Swapping axes (plotting on the -axis).
- Missing units on the axis label.
- Choosing a scale that uses only a small corner of the grid.
- Plotting values with too much rounding beyond what you calculated.
Things to Be Careful About
- is dimensionless, so do not write a unit for that axis.
- Plot using your recorded precision; do not invent extra decimal places.
Answer
A single straight line of best fit drawn through the plotted points (balanced with roughly equal scatter above and below).
Straight line of best fit drawn.
Background Concept
A best-fit line represents the overall trend of the data, not a join-the-dots curve. For a relationship expected to be linear, you draw a straight line that:
- follows the general trend,
- has roughly equal numbers of points above and below,
- does not have to pass through every point.
Understanding the Question
You have plotted against and are told to draw the straight line of best fit. This prepares for finding the gradient and intercept.
Approach
Use a ruler and draw one straight line that best represents the data trend.
Step-by-Step Reasoning
- Visually assess the overall trend (here it should be approximately straight).
- Place a ruler so the line passes centrally through the cluster of points.
- Adjust so the vertical deviations are balanced (similar scatter above and below).
- Draw the line across most of the plotted range.
Key Takeaways
- Best-fit means representing the trend, not forcing the line through all points.
Common Mistakes
- Joining points with segments rather than drawing one best-fit line.
- Forcing the line through the origin when it is not required.
- Drawing a line only over a short section (it should extend across the data range).
Things to Be Careful About
- If one point is clearly anomalous, the best-fit line should not be pulled to pass through it; it should still represent the majority of points.
Determine the gradient and -intercept of this line.
gradient = ______
-intercept = ______
Working
Using two points on the best-fit line, e.g. and :
Answer
gradient
-intercept
gradient = −41.7 cm, y-intercept = 75.8 cm
Background Concept
For a straight-line graph,
- is the gradient (slope):
- is the -intercept: the value of when .
The best practice is to use two points on the drawn best-fit line that are far apart to reduce percentage reading error.
Understanding the Question
You have a graph of (vertical) against (horizontal). You must find:
- the gradient of your straight best-fit line,
- the -intercept of that line.
These will be used in the next part to find constants and .
Approach
- Pick two widely separated points that lie on the best-fit line (not necessarily actual plotted data points).
- Compute the gradient using .
- Find the intercept by either reading where the line crosses the -axis (if within range) or by substituting one point into .
Step-by-Step Reasoning
- Choose two points on the line far apart in to minimise uncertainty.
- Read their coordinates carefully using the graph scales.
- Compute changes:
- is the change in the vertical coordinate.
- is the change in the horizontal coordinate.
- Calculate
Keep units: since is dimensionless, the gradient has the same unit as (e.g. cm).
5) Determine :
- If the line crosses the -axis on your paper, read it directly.
- Otherwise use with a point on the line.
Key Takeaways
- Always use points on the best-fit line, and make them far apart.
- Gradient uses (not the other way around).
- Units: gradient has units of when is dimensionless.
Common Mistakes
- Using two actual plotted points instead of points on the best-fit line (can give a poorer estimate).
- Calculating by accident.
- Forgetting units for gradient and intercept.
- Reading intercept incorrectly if the line does not extend to .
Things to Be Careful About
- Use a large triangle (wide separation) for the gradient calculation.
- Keep enough significant figures during calculation, then round appropriately at the end.
It is suggested that the quantities and are related by the equation
where and are constants.
Using your answers in (d)(iii), determine the values of and .
Give appropriate units.
= ______
= ______
Working
Given
Let . Then
So gradient and intercept .
With and :
Answer
P = 41.7 cm, Q = 75.8 cm
Background Concept
A key practical skill is relating a straight-line graph to an equation.
If you plot against and obtain a straight line,
then the gradient is and the intercept is .
Here the suggested relationship is
which becomes linear if you define
Understanding the Question
You already found the gradient and intercept of the graph of against . You now use them to determine constants and , including their units.
Approach
- Rewrite the given equation in the form where .
- Compare term-by-term to identify and .
- Use your measured graph values for and to compute and .
Step-by-Step Reasoning
- Set . Then
- Compare with :
- so .
- .
- Units:
- is dimensionless.
- Therefore must have the same unit as .
- is an intercept on the -axis, so it also has the same unit as .
If was measured in cm, then and are in cm; if was measured in m, then and are in m.
Key Takeaways
- Linearising by defining makes the equation match .
- comes from the negative of the gradient; is the intercept.
Common Mistakes
- Forgetting the minus sign and writing .
- Giving and in different units.
- Adding inappropriate units to (it is unitless).
Things to Be Careful About
- Keep sign conventions consistent: if your gradient is negative, should come out positive.
- Use the same unit system as your graph when stating and .
Theory suggests that
where the resistance of resistor X is and is the resistance of the whole circuit.
Use your values in (e) to determine a value for .
= ______
Working
Given
So
With , , :
Answer
21.8 Ω
Background Concept
A theoretical link is provided:
where is known and is the total circuit resistance to be determined.
Because and have the same units, is dimensionless, matching (also dimensionless). This is a good quick unit-check.
Understanding the Question
You have found and from your graph, and you are told . You must calculate .
Approach
Rearrange the equation to make the subject, then substitute values.
Step-by-Step Reasoning
- Start with
- Cross-multiply:
- Solve for :
- Substitute your values. Since is a ratio, it does not matter whether and are in cm or m, as long as they are in the same unit.
- Quote in ohms.
Key Takeaways
- Rearrangement and substitution from experimental constants is a standard final step.
- Ratios like are unitless if both quantities share the same unit.
Common Mistakes
- Inverting the ratio and using .
- Mixing units for and (e.g. in cm and in m) which would make incorrect.
- Forgetting to state the unit for .
Things to Be Careful About
- Ensure you use your own experimental values of and from (e); the numerical value of is therefore student-dependent.
- Round sensibly (typically 2–3 significant figures, consistent with the precision of the graph-derived values).
In this experiment, you will investigate the oscillations of a rod.

Answer
L = 60.0 cm
Background Concept
A length measurement should be recorded with:
- a sensible unit (often or for bench measurements),
- a precision consistent with the instrument (e.g. a metre rule with smallest division allows readings to about ),
- and good technique to reduce parallax error.
Understanding the Question
You are asked to measure the rod length shown in the diagram (end-to-end of the rod) and write it down.
Approach
Use a ruler/metre rule:
- align the zero mark with one end of the rod,
- read the scale at the other end with your eye directly above the mark,
- record to the appropriate decimal place.
Step-by-Step Reasoning
- Place the rod alongside the metre rule.
- Ensure the rule is parallel to the rod and that the rod end is at the zero mark (or subtract two readings if the rod cannot be aligned with zero).
- Read the other end at eye level.
- Record the value including unit, to the nearest (typically written as ).
(Example shown in the answer: .)
Key Takeaways
- Record measured lengths with correct unit and appropriate resolution.
- Avoid parallax by reading at eye level.
Common Mistakes
- Omitting the unit.
- Recording too many decimal places (more precise than the instrument allows).
- Not starting at the zero mark and forgetting to subtract the offset.
Things to Be Careful About
- If the rod ends are not sharp, decide consistently where the “end” is.
- Keep the ruler straight and aligned with the rod to avoid systematic error.
Answer
M = 120.0 g
Background Concept
A mass measurement uses a balance (top-pan or digital). The reading should be recorded to the balance resolution (e.g. or ). Zeroing/taring the balance removes offsets.
Understanding the Question
You must measure the mass of the rod, labelled , and record it.
Approach
- Zero the balance.
- Place only the rod on the pan.
- Wait for a stable reading.
- Record with the correct unit and decimal places.
Step-by-Step Reasoning
- If the balance has a “tare” button, press it with the empty pan.
- Place the rod centrally on the pan.
- Read the display once it stabilises.
- Record with the balance precision.
(Example shown: .)
Key Takeaways
- Always zero the balance before measuring.
- Match recorded decimal places to balance resolution.
Common Mistakes
- Forgetting to tare/zero.
- Recording mass in without converting consistently later.
- Rounding inconsistently (e.g. writing fewer decimals than the balance provides).
Things to Be Careful About
- Make sure nothing else (wire, putty, masses) is on the pan when measuring the rod mass.
- Avoid touching the rod while reading (can affect the reading).
Working
Convert to SI:
Answer
S = 3.60 × 10^-3 kg m^2
Background Concept
When you calculate a new quantity from measured values, you must:
- use consistent units (SI is safest),
- substitute into the given equation correctly,
- and include the correct derived unit.
Here,
If is in and is in , then has units:
Understanding the Question
You measured (mass of rod) and (length of rod). You must calculate using the given formula.
Approach
- Convert and into SI units.
- Calculate .
- Multiply by .
- Divide by .
- Quote with unit .
Step-by-Step Reasoning
Using the example readings:
- Convert mass: (often rounded to to match sig figs).
- Convert length: .
- Square the length: .
- Multiply by : .
- Divide by : .
- Write in standard form if preferred: .
Key Takeaways
- Always use SI units before substituting.
- Check units to confirm the calculation is consistent.
Common Mistakes
- Using in grams and in metres (or vice versa) without correcting units.
- Forgetting to square .
- Missing the unit on .
Things to Be Careful About
- Keep enough guard digits during working, then round at the end.
- Ensure your final sig figs match what is justified by your measurements (part (iv)).
Answer
is calculated from .
was recorded to and was recorded to , so the limiting value is (3 s.f.).
Therefore is given to .
S is quoted to 3 significant figures (limited by L).
Background Concept
Significant figures (s.f.) reflect the precision of measurements. For quantities calculated by multiplication/division, the result should be quoted to the same number of significant figures as the least precise factor.
If
then depends on and (and is an exact number, not a measurement).
Understanding the Question
You must explain why you wrote your value of to a particular number of significant figures.
Approach
- Identify how many significant figures were used for and .
- Decide which is the limiting measurement (fewest s.f.).
- Quote to that number of s.f. (since is exact).
Step-by-Step Reasoning
- Suppose was measured as : this is .
- Suppose was measured as : this is .
- In , the precision is limited by because it has fewer s.f.
- Dividing by does not change the appropriate s.f. because is exact.
- Therefore, quote to (e.g. ).
Key Takeaways
- For multiplication/division: final s.f. = smallest s.f. among measured inputs.
- Exact constants (like ) do not limit s.f.
Common Mistakes
- Quoting to the same number of decimal places as or .
- Over-rounding midway through the calculation and losing accuracy.
Things to Be Careful About
- If is squared, its percentage uncertainty doubles, but the significant-figure rule still comes from the original recorded precision of .
- Keep working to extra digits, then round once at the end.
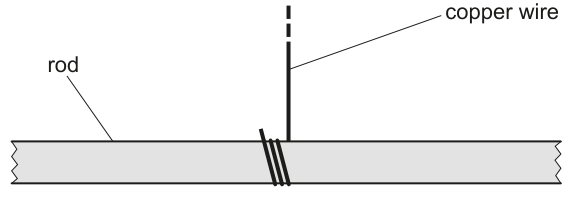
● Wrap one end of the copper wire tightly three times around the centre of the rod, as shown in Fig. 2.2.
● Slide a slotted mass onto each end of the rod.
● Record the mass on one end of the rod.
= ______
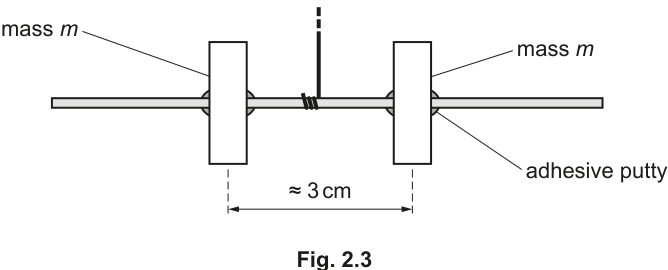
● Adjust the positions of the masses so that they are equally spaced from the centre of the rod and their centres are approximately apart, as shown in Fig. 2.3. You may need to use some of the adhesive putty to keep the masses in position.
● Set up the apparatus as shown in Fig. 2.4.
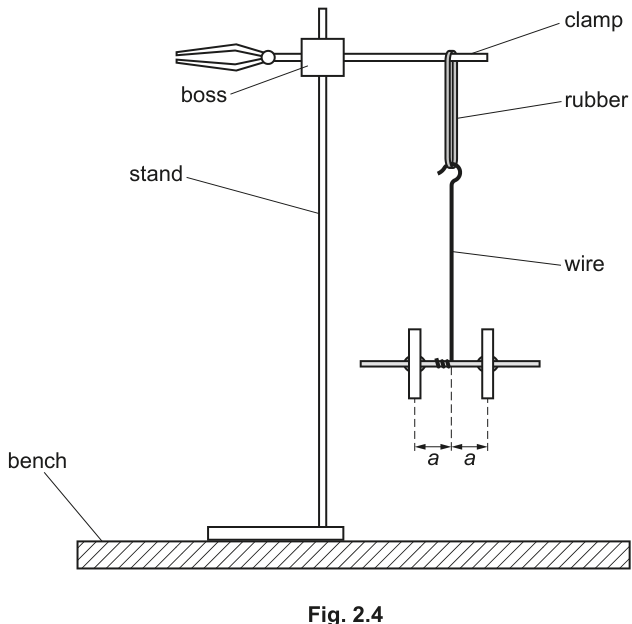
● Make a hook in the wire and place the hook on the rubber band.
● The distance between the centre of each mass and the wire is .
Adjust the position of the masses until the rod is parallel to the bench and each mass is the same distance from the wire.
● Measure and record .
= ______
Answer
m = 50.0 g, a = 1.50 cm
Background Concept
In practical work, distances like must be defined clearly (here: from the centre of each mass to the wire). To reduce systematic error:
- keep the rod horizontal,
- ensure both masses are the same distance from the centre,
- measure to the centre of the masses (not the edge).
Understanding the Question
You must:
- record the mass on one end of the rod (a single slotted mass),
- adjust the masses so the rod is horizontal and symmetric,
- measure and record , the distance from the wire (at the rod centre) to the centre of one mass.
Approach
- Use the label on the slotted mass set or a balance to determine .
- Use a ruler to measure from the wire position to the centre of a mass.
- Record with appropriate precision (e.g. nearest ).
Step-by-Step Reasoning
- Confirm each end has the same slotted mass and record one mass as .
- Adjust both masses so their centres are the same distance from the wire and the rod is parallel to the bench.
- Identify the centre of each mass (by geometry of the cylinder) and measure from the wire position (centre of rod) to that centre.
- Record the value with unit.
(Example readings recorded: and .)
Key Takeaways
- For distances involving objects, measure between well-defined reference points (centre-to-centre here).
- Symmetry (same on both sides) is essential to match the intended model.
Common Mistakes
- Measuring to the near edge of the mass instead of its centre.
- Measuring on only one side without ensuring the other side matches.
- Writing without units, or mixing and later.
Things to Be Careful About
- Parallax when reading the ruler.
- The wire at the centre may have thickness; choose a consistent reference line (e.g. the centre of the wire).
- Ensure the masses do not slide after measuring (use putty if needed).
Estimate the percentage uncertainty in your value of . Show your working.
percentage uncertainty = ______
Working
Using a ruler with divisions:
Answer
percentage uncertainty
3.3 %
Background Concept
Percentage uncertainty shows the fractional uncertainty of a measurement:
where is the measured value and is the absolute uncertainty.
For a ruler with smallest division , a common estimate is for one reading.
Understanding the Question
You measured in part (b)(i). Now you must estimate the percentage uncertainty in and show the working.
Approach
- Choose a sensible absolute uncertainty for based on the ruler resolution.
- Substitute into the percentage uncertainty formula.
- Quote the result as a percentage.
Step-by-Step Reasoning
- If the ruler has marks, the reading uncertainty is about half a division:
. - Convert to the same units as . If , then .
- Compute:
Key Takeaways
- Always express and in the same units before dividing.
- For rulers, is a typical absolute uncertainty per reading.
Common Mistakes
- Using instead of without justification.
- Mixing units (e.g. dividing by directly).
- Forgetting to multiply by .
Things to Be Careful About
- If is determined from two readings (e.g. position difference), the absolute uncertainty can be larger (sum of uncertainties). Decide based on how you actually measured .
● Rotate the rod horizontally through .
● Release the rod. The rod will oscillate.
● Take measurements to determine the period of these oscillations.
= ______
Working
Time oscillations twice:
Mean time for oscillations:
Period:
Answer
T = 1.25 s
Background Concept
The period is the time for one complete oscillation. Timing a single oscillation gives a large percentage uncertainty because reaction time is comparable to the measured time. A standard technique is:
- time oscillations (with or ),
- then divide by to get ,
- and repeat to find a mean.
Understanding the Question
You must take measurements to determine the oscillation period after rotating the rod through and releasing it.
Approach
- Choose a fixed reference point in the motion (e.g. when the rod passes through its central equilibrium position in the same direction each time).
- Use a stopwatch to time oscillations.
- Repeat the timing.
- Average the total times and divide by .
Step-by-Step Reasoning
- Start the stopwatch as the rod passes the reference point.
- Count full oscillations (returning to the same position and direction).
- Stop the watch after the 10th oscillation.
- Repeat for a second value to reduce random error.
- Average the two times for 10 oscillations, then divide by 10.
The example calculation shows how this produces .
Key Takeaways
- Timing many oscillations reduces percentage uncertainty.
- Repeats and averaging improve reliability.
Common Mistakes
- Timing half-oscillations by accident.
- Starting/stopping at different points in the cycle.
- Timing too few oscillations (large random uncertainty).
Things to Be Careful About
- Damping may reduce amplitude; still time using the same reference point.
- Ensure the rod is oscillating freely (masses not slipping, wire not rubbing).
● Remove the hook from the rubber band.
● Remove the masses from the rod.
● Place the masses on the rod so that their centres are approximately apart.
● Record .
= ______
● Place the hook on the rubber band.
● Adjust the position of the masses until the rod is parallel to the bench and each mass is the same distance from the wire.
● Measure and record .
= ______
● Repeat (c).
= ______
Answer
m = 10.0 g, a = 4.50 cm, T = 1.26 s
Background Concept
To compare two experimental conditions fairly, you must repeat the same measurement method with only the intended changes (here the masses used and their spacing).
Understanding the Question
You must:
- replace the masses with masses,
- set them roughly apart,
- measure and record the new and ,
- then repeat the period measurement from part (c) to obtain .
Approach
- Record (one of the masses).
- Adjust masses until rod is horizontal and symmetric; measure .
- Time oscillations (e.g. ) twice, average, and divide to get .
Step-by-Step Reasoning
- Ensure both masses are the same distance from the wire.
- Measure from the wire to the centre of one mass.
- Use the same reference point to time oscillations as before.
- Calculate from the mean time for oscillations.
(Example values recorded: , , .)
Key Takeaways
- Keep measurement technique consistent between trials.
- Only change the intended variables.
Common Mistakes
- Forgetting to re-measure after changing masses.
- Not ensuring symmetry (different on each side).
- Changing the timing method (different ) between trials.
Things to Be Careful About
- After moving masses, re-check that the rod is parallel to the bench.
- Make sure the masses are secure and do not slide during oscillation.
It is suggested that the relationship between , , and is
where is a constant.
Using your data, calculate two values of .
first value of = ______
second value of = ______
Working
From
so
Using .
First set: , ,
Second set: , ,
Answer
first value of
second value of
k1 = 4.33×10^2 s^2 kg^-1 m^-2; k2 = 4.39×10^2 s^2 kg^-1 m^-2
Background Concept
If a model suggests
then for each set of measurements you can compute
If the relationship is correct and the experiment is done well, should be (approximately) the same for different trials.
Units check:
- has units .
- has units .
So is in and has units:
Understanding the Question
You have two sets of data (from the and the configurations). You must calculate two values of using your measured , , and known .
Approach
For each trial:
- convert to and to ,
- compute ,
- compute ,
- add ,
- compute from .
Step-by-Step Reasoning
First trial (example numbers):
- Convert: , .
- .
- .
- Denominator: .
- Divide to find .
Second trial is identical method with the second set of .
Key Takeaways
- Always convert to SI before using a relationship with squared terms.
- If a constant is truly constant, computed values from different runs should agree within uncertainty.
Common Mistakes
- Using in inside (gives a error because vs ).
- Using in grams without converting to kilograms.
- Squaring incorrectly or forgetting to square it.
Things to Be Careful About
- Keep enough significant figures during intermediate steps.
- may dominate over depending on the values; rounding too aggressively can distort .
It is suggested that the percentage uncertainty in the values of is .
Using this uncertainty, explain whether your results support the relationship in (e).
Working
Since , the two values of agree within the stated uncertainty.
Answer
Yes, the results support the relationship because the values of are consistent within .
Yes; k values agree within 10%.
Background Concept
To decide whether results support a relationship that predicts a constant , you compare values of from different trials.
A common method is percentage difference:
If this percentage difference is less than (or comparable to) the stated percentage uncertainty, the results are considered consistent.
Understanding the Question
You are told the percentage uncertainty in is . You have two calculated values of . You must say whether the results support the suggested relationship.
Approach
- Compute the percentage difference between the two values of .
- Compare it with .
- State a clear conclusion.
Step-by-Step Reasoning
- Take the two calculated values, e.g. and .
- Find the absolute difference: .
- Divide by the mean of the two values and multiply by .
- If the result is less than , then the discrepancy is small enough to be explained by experimental uncertainty.
Key Takeaways
- “Supports the relationship” means the data are consistent with it within uncertainty.
- Use a quantitative comparison (percentage difference) rather than a vague statement.
Common Mistakes
- Comparing by subtraction only without converting to a percentage.
- Using as an absolute uncertainty instead of a percentage.
- Claiming the relationship is proved; in practical work you only say “supported” or “consistent within uncertainty”.
Things to Be Careful About
- If one value is close to the other but both have large uncertainties, agreement is expected; the uncertainty criterion is the key.
- Use sensible rounding so that the comparison isn’t distorted by premature rounding.
Describe four sources of uncertainty or limitations of the procedure for this experiment.
For any uncertainties in measurement that you describe, you should state the quantity being measured and a reason for the uncertainty.
Answer
- Measuring : difficult to judge the centre of each mass and the reference line of the wire, so has parallax/centre-position uncertainty.
- Timing : stopwatch reaction time when starting/stopping and difficulty deciding the exact instant the rod passes a reference position.
- Mass position: masses may slip/move on the rod during oscillations (putty deformation), changing during the run.
- Rod not exactly horizontal / unequal on each side: if the rod is not level or masses not symmetrically placed, the motion differs from the assumed arrangement and affects .
Four limitations listed (a measurement uncertainty, timing uncertainty, slippage, asymmetry/level error).
Background Concept
In oscillation experiments, uncertainty comes from:
- measurement resolution and judgement (lengths like ),
- human reaction time (timing ),
- changes during the oscillation (slipping masses, damping),
- and departures from the idealised setup assumed in the formula.
Good exam answers name the quantity affected and the reason the measurement/procedure is uncertain.
Understanding the Question
You must give four sources of uncertainty/limitations. For measurement uncertainties, you must state (i) what you are measuring and (ii) why it is uncertain.
Approach
Think through the steps that generate your data (, , and the stability of the arrangement). For each, ask: “What makes this hard to measure accurately or keep constant?” Then write each point explicitly.
Step-by-Step Reasoning
Creditable limitations include:
- Uncertainty in : you must measure from the wire to the centre of the mass. The centre is not a sharp point, and the wire has thickness; plus parallax can occur when reading the ruler.
- Uncertainty in from reaction time: start/stop timing depends on the observer’s judgement. This is especially significant if you time only a few oscillations.
- Difficulty identifying a consistent timing reference: torsional oscillations can have small amplitude changes, and deciding the “same point in the cycle” each time can vary.
- Masses may move: if the masses slide, or the putty deforms, then changes during oscillation, so the run does not correspond to one fixed value of .
- Rod not perfectly horizontal / symmetry not perfect: if the rod tilts or the masses are not exactly equal distances from the wire, the oscillation is not the intended symmetric system.
Any four well-explained points like these score.
Key Takeaways
- Link each limitation to a specific measured quantity or experimental assumption.
- Give a physical reason, not just “human error”.
Common Mistakes
- Writing vague statements like “parallax” without saying what was being measured.
- Giving improvements instead of limitations (that belongs in (g)(ii)).
- Repeating the same idea in different words (e.g. “reaction time” and “human error” as two separate points).
Things to Be Careful About
- Make sure each of the four points is distinct.
- If you mention an uncertainty, make it clear whether it is random (varies between repeats) or systematic (biases all readings).
Describe four improvements that could be made to this experiment. You may suggest the use of other apparatus or different procedures.
Answer
- Measure more precisely by marking the mass centres and using vernier calipers (or a set square/rule at eye level) to reduce centre/parallax uncertainty.
- Reduce timing uncertainty by timing a larger number of oscillations (e.g. ) and repeating several times, then averaging.
- Use video analysis/light sensor with a data logger to determine automatically (removes reaction time).
- Prevent masses moving by clamping them firmly (e.g. with a screw clamp/tape) so that stays constant during oscillations.
Four improvements given (better a measurement, more oscillations & repeats, automatic timing, secure masses).
Background Concept
An improvement should directly reduce a specific uncertainty or correct a limitation. The strongest answers:
- identify what is improved (e.g. or ),
- name the instrument/procedure,
- and explain how it reduces uncertainty.
Understanding the Question
You must suggest four improvements to the experiment (apparatus or procedure changes). These should be practical and aimed at improving accuracy/precision.
Approach
Take the limitations from (g)(i) and propose fixes:
- for measurement issues: better tools and clearer reference points,
- for timing: increase total timed interval, repeat, or automate,
- for instability: make the setup more secure and controlled.
Step-by-Step Reasoning
Examples of strong improvements:
- Improve measurement: mark the rod centre and mass centres; use vernier calipers or careful alignment tools to reduce judgement and parallax.
- Improve measurement precision: time more oscillations (larger ) so reaction time becomes a smaller fraction of the total time; repeat and average.
- Automate timing: use a motion sensor/photogate/video tracking to identify crossings of a reference position and compute objectively.
- Stop masses sliding: use stronger fixing (clamps, tape, or a mechanical stop) so remains constant during oscillation.
Other valid improvements could include shielding from drafts, ensuring the support is rigid, or using a pointer and scale to define the equilibrium position more clearly.
Key Takeaways
- Improvements should be specific and linked to an error source.
- Better instruments and better procedures both count.
Common Mistakes
- Saying “use more accurate equipment” without naming what or how.
- Suggesting changing the physics model (irrelevant) rather than improving measurement.
- Repeating the same improvement (e.g. “repeat readings” stated in multiple ways).
Things to Be Careful About
- Improvements must be realistic with typical lab equipment.
- Avoid suggesting changes that alter the defined variables (e.g. changing the wire material) unless justified as controlling a variable.