Physics 9702/36 — October/November 2023
Cambridge AS Level · Advanced Practical Skills · worked solutions for every part, with the mark scheme
Topics Manipulation, Measurement and Observation · Presentation of Data and Observations · Analysis, Conclusions and Evaluation
In this experiment, you will investigate an electrical circuit.
● Connect the circuit shown in Fig. 1.1.
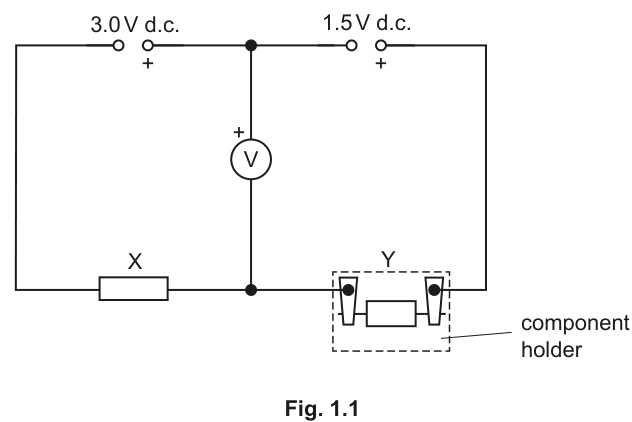
● Ensure that the polarities of the two power supplies and the voltmeter are as shown in Fig. 1.1.
● Connect one of the labelled resistors into the component holder as resistor Y, as shown in Fig. 1.1. Record the resistance of resistor Y.
= ______
● The voltmeter reading should be approximately 3V.
Record the voltmeter reading .
= ______
Answer
Record the labelled value of resistor as (in ) and record the voltmeter reading (in , approximately ).
Example (typical):
R and V recorded (student-dependent)
Background Concept
A voltmeter measures the potential difference (p.d.) between two points in a circuit. To obtain a meaningful reading, it must be connected in parallel with the part of the circuit whose p.d. is required, and its polarity must match the circuit polarity (positive terminal at the higher potential).
A resistor value may be given by its label (or colour code) or measured with an ohmmeter. In practical exams, you must record values with units and with sensible precision consistent with the instrument.
Understanding the Question
You are told to build the circuit in Fig. 1.1, ensuring the polarities of both power supplies and the voltmeter match the diagram. You then:
- place one labelled resistor into the holder as resistor ,
- record its resistance ,
- record the voltmeter reading (expected to be about ).
The actual numerical readings depend on which labelled resistor you choose and the real circuit components.
Approach
- Assemble the circuit exactly as shown (especially the + and − terminals).
- Insert one labelled resistor into the holder for .
- Record from the resistor label (or meter reading, if used).
- Switch on and allow the reading to settle.
- Record from the voltmeter scale/digital display with appropriate precision.
Step-by-Step Reasoning
- Correct polarity matters because reversing the voltmeter leads would give a negative reading (or a reversed needle deflection), and reversing a supply changes the potentials in the circuit.
- Record in ohms, . If the resistor is labelled, you copy the stated value; if measured, you quote the reading to the meter’s resolution.
- Record in volts, . For a digital meter, you copy all displayed digits; for an analogue meter, you estimate to about half a smallest division.
Key Takeaways
- Voltmeter in parallel, correct polarity.
- Record measured quantities with correct units and appropriate precision.
Common Mistakes
- Swapping polarities of a supply or the voltmeter, leading to incorrect/negative readings.
- Writing with no unit or writing in the wrong unit.
- Over-rounding a digital voltmeter reading (losing significant information).
Things to Be Careful About
- Ensure firm connections in the component holder; loose contacts cause fluctuating readings.
- Do not confuse (in ) with (in ), which is only needed later.
- If using an analogue voltmeter, choose the correct range so that readings are around mid-scale for best precision.
Change Y and record and . Repeat until you have six sets of values of and .
Record your results in a table. Include values of in your table.
Answer
Take six different resistors for . For each, record and the corresponding , then calculate .
Record in one table with headings (including units), e.g.
Calculate each value using
(using consistent s.f. in the column).
Example of one row:
Table of six values of R, V and 1/R (student-dependent)
Background Concept
In Paper 3, marks for tables are awarded for clear presentation and correct processing:
- all readings in one table,
- clear column headings with quantity and unit,
- consistent precision within a column,
- correct calculation of any derived quantity (here, ).
The quantity is often included because it allows a linear graph when the underlying relationship involves in the denominator.
Understanding the Question
You must replace resistor with different labelled resistors and obtain six pairs of readings . Then you must add a calculated column for .
So the table must contain three columns: measured , measured , and calculated .
Approach
- Choose six different resistors that give a good spread of values (not all similar).
- For each resistor:
- record and ,
- compute .
- Present everything in a single, clearly ruled table with proper headings and units.
Step-by-Step Reasoning
- Since is being changed, it is your independent variable. Using a wide range of values helps the graph cover a wide range of values, improving the gradient determination.
- Enter raw values of and directly from the instruments/labels.
- Compute the derived quantity for each row:
Example: if then
- Precision: it is common to quote to 3 significant figures (or consistent with how precisely is known). Keep the number of decimal places consistent down a column where appropriate.
Key Takeaways
- A good table is about structure: headings, units, consistent precision.
- Derived quantities must be calculated correctly and recorded for each set of readings.
Common Mistakes
- Missing units in headings (e.g. writing just instead of ).
- Writing with incorrect units (must be ).
- Inconsistent rounding (e.g. mixing 0.01, 0.0100, 0.010 in the same column without reason).
- Splitting results across multiple tables.
Things to Be Careful About
- Use the same resistor as for the whole measurement of each row; do not change anything else.
- Ensure the voltmeter reading is stable before recording.
- Avoid transcription errors when calculating (especially powers of ten for large ).
Plot a graph of on the -axis against on the -axis.
Answer
Plot a graph with:
- -axis:
- -axis:
Use a sensible scale and plot all six points accurately.
Graph of V (y) against 1/R (x) plotted
Background Concept
A graph is used to display how one quantity depends on another and to allow parameters (such as gradient) to be found. Good graph technique in Cambridge practical papers includes:
- correct axis choice (dependent variable on , independent on ),
- correct axis labels with units,
- scales that use a large fraction of the grid and are easy to read,
- accurate plotting.
Understanding the Question
You already have a results table containing and . This part asks you to plot against with on the vertical axis.
Approach
- Draw axes with enough space.
- Choose scales that cover the full range of your data and use at least half the grid in both directions.
- Label axes as and .
- Plot all six points using small, neat crosses.
Step-by-Step Reasoning
- The instruction “ on the -axis against on the -axis” fixes the variables. Do not swap them.
- Decide the minimum and maximum values of and from your table, then choose scale steps like 0.1 V, 0.2 V, or convenient multiples of .
- Plot each pair carefully. If you use crosses, the intersection is the exact point.
Key Takeaways
- Correct labels and scales are essential for graph marks.
- Accurate plotting is needed for a reliable best-fit line and gradient.
Common Mistakes
- Missing units or writing units incorrectly (e.g. writing in instead of ).
- Using awkward scales (e.g. 3 squares = 1 unit) or scales that use only a small part of the grid.
- Plotting blobs/dots too large to judge the line of best fit.
Things to Be Careful About
- If you use standard form on the axis (e.g. label in ), make it explicit on the axis label.
- Check each plotted point corresponds to the correct row (mixing rows is a common error).
Draw the straight line of best fit.
Answer
Draw a single straight line of best fit through the plotted points (balanced about the line).
Straight best-fit line drawn
Background Concept
A best-fit line represents the overall trend in data when you expect a linear relationship. It should not be forced through every point; instead, it should be positioned so that the scatter of points is roughly balanced above and below the line.
Understanding the Question
You have plotted six points of against . You must now draw the straight line that best represents the trend.
Approach
- Use a ruler.
- Place the line so that (approximately) the same number of points lie above and below it, and the deviations are of similar size.
Step-by-Step Reasoning
- Do not join points with a zig-zag; that is not a best-fit line.
- If one point is clearly anomalous compared with the general trend, you still draw the best-fit line through the main trend rather than bending the line to include it.
Key Takeaways
- Best-fit means “overall trend”, not “connect-the-dots”.
Common Mistakes
- Joining points sequentially.
- Forcing the line through the origin without evidence.
Things to Be Careful About
- Use a long line (extend across most of the plotted range) to make gradient/intercept readings more accurate.
Determine the gradient and -intercept of this line.
gradient = ______
-intercept = ______
Working
Choose two well-separated points on the best-fit line and find
Read the -intercept where .
Example (typical):
Answer
gradient (in )
y-intercept value of at (in )
Gradient and y-intercept obtained from best-fit line (student-dependent)
Background Concept
For a straight-line graph of the form
- the gradient is ,
- the -intercept is (the value of when ).
Here and . So the gradient has units
Understanding the Question
After plotting vs and drawing the best-fit line, you must extract two numerical values from the line:
- the gradient,
- the -intercept.
These will be used in part (d).
Approach
- Use a large triangle on the best-fit line to reduce percentage reading uncertainty.
- Compute gradient as .
- Find intercept by extending the best-fit line to meet the axis (where ).
Step-by-Step Reasoning
- Pick two points on the line, not necessarily measured data points. They should be far apart so that and are large.
- Read the coordinates carefully from the axes.
- Calculate
- Units: if is in volts and is in , then the gradient is in .
- For the intercept, go to on the -axis and read the value of where the best-fit line crosses the -axis.
Key Takeaways
- Use a large triangle: it is the main practical skill for reliable gradients.
- Always compute gradient as “change in divided by change in ”.
Common Mistakes
- Using a small triangle, giving a very uncertain gradient.
- Taking instead of .
- Using two experimental points that are not on the best-fit line.
- Quoting gradient without units.
Things to Be Careful About
- Make sure you read the axes correctly, especially if you used a scale factor like .
- Intercept may be outside the plotted region; extend the line neatly with a ruler to reach the axis.
It is suggested that the quantities and are related by the equation
where and are constants.
Using your answers in (c)(iii), determine the values of and .
Give appropriate units.
= ______
= ______
Working
Given
Let . Then
So gradient and -intercept .
Units:
Answer
a = gradient (V Ω), b = y-intercept (V)
Background Concept
Many practical investigations aim to test whether a relationship is linear. If you can rewrite an equation into the form
then plotting against produces a straight line where:
- is the gradient,
- is the -intercept.
Understanding the Question
You are told that the circuit may obey
You have already plotted against and found the gradient and intercept in part (c)(iii). This question asks you to use those graph values to determine and , including units.
Approach
- Identify what you used for the -axis: .
- Rewrite the given equation in terms of .
- Compare with .
- Read off and , then assign units from the axes units.
Step-by-Step Reasoning
Start with
Since your graph uses on the horizontal axis, define
Then
Comparing with :
- gradient ,
- intercept .
Units:
- The gradient unit is (unit of )/(unit of ):
so is in .
- The intercept is a voltage reading, so is in .
Key Takeaways
- If you plot the variables exactly as suggested by the equation, constants drop straight out as gradient and intercept.
- Units come directly from axis units.
Common Mistakes
- Saying (wrong for this linearisation).
- Giving in volts rather than .
- Confusing the resistor value with when matching to .
Things to Be Careful About
- Use your own gradient and intercept values from (c)(iii); do not recalculate them from raw data here.
- If your -axis used a scale factor (e.g. in ), ensure your gradient (and hence ) is adjusted accordingly.
The rest of this paper
1 more questions- Q2Manipulation, Measurement and Observation · Analysis, Conclusions and Evaluation · Presentation of Data and Observations17M