Physics 9702/31 — May/June 2021
Cambridge AS Level · Advanced Practical Skills · worked solutions for every part, with the mark scheme
Topics Manipulation, Measurement and Observation · Presentation of Data and Observations · Analysis, Conclusions and Evaluation
In this experiment, you will investigate the equilibrium of a metre rule.
● Use the adhesive putty to attach the mass to the metre rule as close as possible to the mark, as shown in Fig. 1.1.
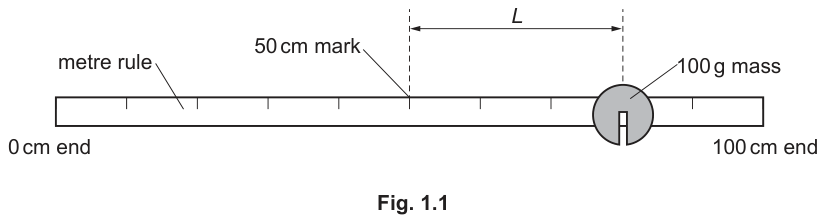
● The distance between the mark and the centre of the mass is .
Measure and record .
= ______
● Set up the apparatus as shown in Fig. 1.2.
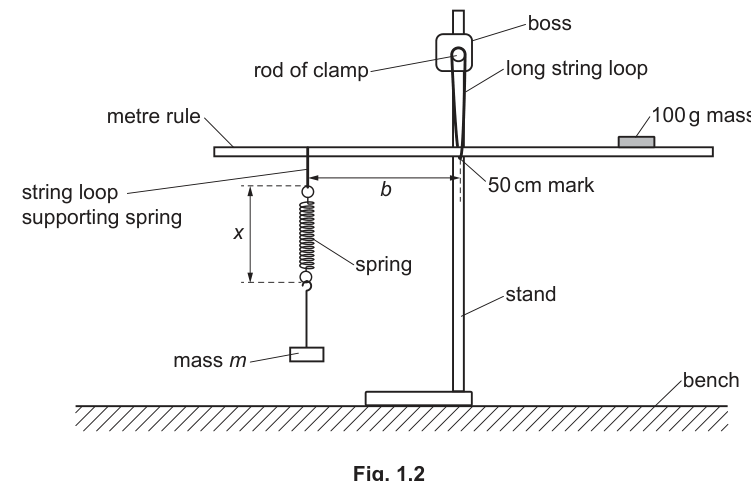
● Suspend the rule from the long string loop at the mark on the rule.
● Add the two masses to the mass hanger to make a total mass of . Suspend mass from the spring.
● Record .
= ______
● The distance between the string loop supporting the spring and the mark on the rule is .
The distance between the top of the top loop of the spring and the bottom of the bottom loop of the spring is , as shown in Fig. 1.2.
Adjust the position of the string loop supporting the spring until the rule is horizontal and in equilibrium.
● Measure and record and .
= ______
= ______
Repeat (b) with different values of until you have six sets of readings. Record , and . Include your values from (b).
Record your results in a table. Include values of in your table.
Plot a graph of on the -axis against on the -axis.
Draw the straight line of best fit.
Determine the gradient and -intercept of this line.
gradient = ______
y-intercept = ______
It is suggested that the quantities and are related by the equation
where and are constants.
Using your answers in (d)(iii), determine values for and . Give appropriate units.
= ______
= ______
A student repeats the experiment placing the mass closer to the mark on the rule.
Theory suggests that and are both inversely proportional to .
For this experiment, draw a second line on the graph to show the expected results. Label this line W.
The rest of this paper
1 more questions- Q2Manipulation, Measurement and Observation · Presentation of Data and Observations · Analysis, Conclusions and Evaluation20M