Physics 9702/33 — February/March 2020
Cambridge AS Level · Advanced Practical Skills · worked solutions for every part, with the mark scheme
Topics Manipulation, Measurement and Observation · Presentation of Data and Observations · Analysis, Conclusions and Evaluation
In this experiment you will investigate the oscillations of a rod.
• Assemble the apparatus as shown in Fig. 1.1.
• Adjust the apparatus until the two springs are approximately apart. Each spring should be vertical and the same distance from the middle of the rod. The rod should be parallel to the bench.
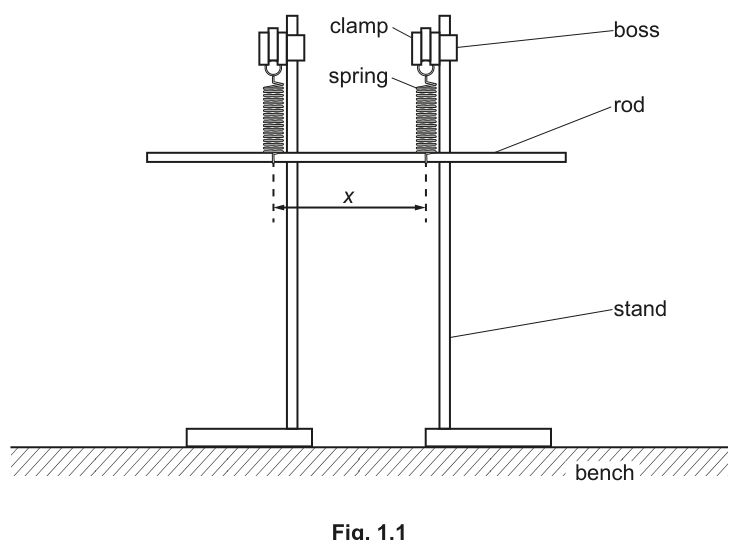
• The distance between the two springs where they support the rod is , as shown in Fig. 1.1. Measure and record .
= ______
Answer
Measure the separation between the two spring support points using a ruler and record to the nearest (e.g. ).
x ≈ 15.0 cm (example)
Background Concept
In practical work, a length measurement is only valid if (i) you measure the correct physical separation, (ii) you avoid parallax (eye not perpendicular to scale), and (iii) you record the reading to a precision consistent with the instrument (e.g. metre rule: typically to the nearest ).
Understanding the Question
You have a rod supported by two vertical springs. The variable is the distance between the two springs at the points where they support the rod (i.e. the separation of the support points along the rod). You must measure and record in .
Approach
- Identify the two support points on the rod directly above each spring.
- Use a ruler/metre rule aligned along the rod to measure the separation.
- Read the scale with your eye directly above the mark to avoid parallax.
- Record the value with unit and suitable precision.
Step-by-Step Reasoning
- Place the ruler so that its edge lies parallel to the rod, and its scale runs along the line joining the two support points.
- If possible, line up one support point with a clear scale mark (e.g. ). If not, take two readings (one at each support) and subtract.
- Read to the nearest for a mm-scale ruler.
- Record as, for example, .
Key Takeaways
- Measure between the correct physical points.
- Avoid parallax.
- Quote a realistic precision and always include units.
Common Mistakes
- Measuring between the stands rather than between the spring contact/support points.
- Recording an over-precise value (e.g. from a mm ruler).
- Omitting the unit.
Things to Be Careful About
- Ensure the springs are vertical and the rod is parallel to the bench before measuring, as instructed.
- If you subtract two readings, keep consistent precision (e.g. both to ).
• Lift one end of the rod a short distance and push the other end of the rod down a short distance. Release the rod so that it oscillates with a rocking motion, as shown in Fig. 1.2.

• Take measurements to determine the period of the oscillation.
= ______
Working
Time complete oscillations (e.g. ) using a stopwatch and compute
Repeat and average .
Example: if for oscillations,
Answer
(example, from timing 10 oscillations).
T ≈ 1.24 s (example)
Background Concept
The period is the time for one complete oscillation. Using a stopwatch, human reaction time (starting/stopping) creates a significant uncertainty if you time just one oscillation. Timing many oscillations reduces the percentage uncertainty because the reaction time is spread over a larger total time.
Understanding the Question
The rod rocks up and down at its ends. You must measure the period of this rocking oscillation. The question expects a practical method (not a theoretical calculation).
Approach
- Choose a clear reference position to define one complete oscillation (e.g. left end at its highest point).
- Time oscillations where is reasonably large (often to ).
- Calculate .
- Repeat the timing at least once and average the values of .
Step-by-Step Reasoning
- Start the oscillation with a small amplitude (so the motion stays regular and does not slip).
- Decide what counts as “one oscillation”: for example, left end goes from highest point back to highest point.
- Use a stopwatch to measure the total time for complete oscillations.
- Compute
- Repeat: obtain and calculate then average.
Key Takeaways
- Always time multiple oscillations.
- Define a consistent counting point.
- Repeats and averaging improve reliability.
Common Mistakes
- Timing only one oscillation (large percentage uncertainty).
- Miscounting oscillations (e.g. counting half-oscillations).
- Letting amplitude decay too much or the rod slip, making timing inconsistent.
Things to Be Careful About
- Use the same amplitude range each time (small, but visible).
- Count complete cycles only.
- Record times to the stopwatch resolution (e.g. ) but do not claim unrealistic precision in if your timings are inconsistent.
• Change by moving the stands. Adjust the apparatus until the springs are vertical and the rod is parallel to the bench. Measure and .
• Repeat until you have six sets of values of and .
• Record your results in a table. Include values of in your table.
Answer
Record six sets of and and include a calculated column for .
Example of a correctly formatted table (values illustrative):
| 12.0 | 1.47 | 0.083 |
| 14.0 | 1.37 | 0.071 |
| 16.0 | 1.30 | 0.062 |
| 18.0 | 1.24 | 0.056 |
| 20.0 | 1.20 | 0.050 |
| 22.0 | 1.16 | 0.045 |
(Consistent decimal places in each column; calculated for each .)
Table of six values of x, T, and 1/x (student-dependent)
Background Concept
A good results table in Paper 3 must:
- contain all readings in one clear table,
- have column headings as “quantity / unit”,
- use consistent precision (same decimal places) down a column,
- include any calculated quantities requested (here ).
Also, to test a relationship reliably, you need enough data points over a sensible range of the independent variable.
Understanding the Question
You must change the spring separation and measure the period for each value. You need six pairs , and you must calculate and include in the table.
Approach
- Choose a range of values (not all very close together), while keeping the springs vertical and symmetric about the rod’s midpoint.
- For each , measure using the “time oscillations then divide” method.
- Calculate for each row.
- Present in a single table with correct headings and consistent precision.
Step-by-Step Reasoning
- Decide values of (e.g. from about to , depending on what the apparatus allows). The key is that then changes noticeably.
- For each :
- Ensure the rod is level and springs vertical before starting oscillation.
- Measure (preferably from timing oscillations, repeated and averaged).
- Compute :
If is recorded in , then is in . Choose a sensible rounding for (often 2–3 significant figures) and keep it consistent.
- Construct the table with three columns: , , and .
Key Takeaways
- Six data points give a meaningful graph.
- A derived column must be calculated correctly and clearly labelled with units.
- Consistent precision and clear headings are essential for marks.
Common Mistakes
- Missing units in column headings.
- Inconsistent decimal places within a column.
- Only a narrow range of values (graph becomes unreliable).
- Calculating using mixed units (e.g. sometimes using in m, sometimes in cm).
Things to Be Careful About
- If you record in , keep it that way throughout so is .
- Re-check alignment each time you move the stands (springs vertical, rod level), otherwise may change for reasons unrelated to .
- Don’t round too aggressively before calculating ; calculate from your measured then round for the table.
Plot a graph of on the -axis against on the -axis.
Answer
Plot a graph with:
- -axis:
- -axis:
Use a sensible scale (at least half the grid in each direction) and plot all six points accurately.
Graph of T (y) against 1/x (x) with correct labels/units
Background Concept
A graph is used to show how one quantity depends on another. In Paper 3, marks are awarded for correct axis labels (quantity and unit), sensible scales, accurate plotting, and (in later parts) a correct best-fit line.
Understanding the Question
You have calculated and measured for six different values of . You are told to plot (vertical axis) against (horizontal axis). This means each point is .
Approach
- Put the independent variable on the -axis: .
- Put the dependent variable on the -axis: .
- Label each axis as “quantity / unit”.
- Pick scales that spread the data out.
- Plot each point carefully.
Step-by-Step Reasoning
- From your table, take each pair .
- Draw axes with enough room for labels.
- Label axes clearly, e.g. and .
- Choose scales:
- avoid awkward scales like 3 squares = 0.07,
- ensure points cover a large area (improves gradient accuracy).
- Plot points with small, neat crosses (or dots in small circles), not blobs.
Key Takeaways
- Always plot the variables specified in the question.
- Correct units in axis labels matter.
- Good scale choice improves accuracy of gradient/intercept.
Common Mistakes
- Swapping axes (plotting on and on ).
- Missing units, or writing only the unit without the quantity.
- Using a scale that compresses the points into a small region.
Things to Be Careful About
- If is in , then is in (not ).
- Use consistent rounding: plot using the values recorded in your table.
Draw the straight line of best fit.
Answer
Draw a straight line of best fit through the plotted points (balanced with approximately equal scatter above and below the line).
Straight line of best fit drawn
Background Concept
A best-fit line represents the overall trend of the data, not a point-to-point join. For a linear relationship, you draw a straight line that best represents all points, considering experimental scatter.
Understanding the Question
After plotting against , you must draw the straight line of best fit. The next part uses this line to calculate gradient and intercept, so the line must be carefully drawn.
Approach
- Use a ruler.
- Position the ruler so the line passes centrally through the cluster of points.
- Ensure the number of points above and below is roughly balanced.
Step-by-Step Reasoning
- Do not join the points.
- If one point is clearly off the trend (an anomaly), the best-fit line should still represent the majority of points.
- Draw the line thinly and extend it enough to read the intercept (where it crosses the -axis) clearly.
Key Takeaways
- Best-fit means “overall trend”, not “through every point”.
- A thin, well-placed line improves the accuracy of gradient and intercept.
Common Mistakes
- Forcing the line through the origin when not required.
- Drawing a line through the first and last point regardless of scatter.
- Drawing a thick line, making readings of intercept/gradient inaccurate.
Things to Be Careful About
- Use a long ruler and draw a single continuous straight line.
- Extend the line across the full range of the plotted data for a more reliable gradient triangle.
Determine the gradient and -intercept of this line.
gradient = ______
-intercept = ______
Working
Choose two well-separated points on the best-fit line and calculate
Example (from line): using points and ,
Read the -intercept where the line crosses the -axis (or calculate ). Example:
Answer
Gradient
-intercept (example values).
gradient ≈ 7.9 s cm, y-intercept ≈ 0.80 s (example)
Background Concept
For a straight-line graph of the form
- the gradient is ,
- the -intercept is (value of when ).
On a vs graph, the gradient unit is
and the intercept has unit .
Understanding the Question
You must find the gradient and the -intercept of your best-fit line on the graph of (vertical) against (horizontal). These will be used later to find constants in a suggested equation.
Approach
- Use a large triangle on the best-fit line (choose points far apart) to reduce reading error.
- Compute the gradient with .
- Find the intercept by reading where the line crosses the -axis, or calculate it using with a point on the line.
Step-by-Step Reasoning
- Pick two points on the drawn line (not necessarily actual data points), ideally near the ends of the plotted range.
- Read their coordinates carefully:
- -coordinate is in ,
- -coordinate is in .
- Calculate
- Quote the gradient with unit .
- For the intercept :
- either read directly at (where the line crosses the axis),
- or compute using one point on the line:
and quote in seconds.
Key Takeaways
- Gradient is always “change in over change in ”.
- Use a large triangle and points on the best-fit line.
- Units of gradient come from the axis units.
Common Mistakes
- Using instead of .
- Using two nearby points (gives large percentage uncertainty in the gradient).
- Forgetting that the -axis variable is , not .
- Missing or incorrect gradient units.
Things to Be Careful About
- Read coordinates from the line, not from the printed grid without checking scale.
- Keep enough significant figures in intermediate steps so rounding does not distort the intercept.
- If you calculate , use a point on the best-fit line (not a scattered experimental point).
It is suggested that the quantities and are related by the equation
where and are constants.
Use your answers in (d)(iii) to determine the values of and . Give appropriate units.
= ______
= ______
Working
Given
and plotting against gives
So is the gradient and is the -intercept.
Using (d)(iii) example values: gradient and intercept .
Answer
a = gradient (s cm), b = y-intercept (s)
Background Concept
If a graph is plotted with against and it is a straight line, it can be compared to
where is the gradient and is the -intercept.
Here the suggested relationship is
which can be rewritten as
So a plot of (vertical) against (horizontal) should be linear, with gradient and intercept .
Understanding the Question
You have already found the gradient and -intercept of the graph of against . You must now use those values to determine the constants and , including correct units.
Approach
- Rearrange the given equation to match .
- Identify which constant corresponds to the gradient and which corresponds to the intercept.
- Copy the numerical values from (d)(iii).
- Assign units based on the graph axes (or from dimensional reasoning).
Step-by-Step Reasoning
- Compare
with
Thus:
- Units:
- is in .
- is in .
- Therefore
and
- Substitute your measured gradient and intercept to obtain and .
Key Takeaways
- Linearising the equation tells you exactly what the gradient and intercept represent.
- Units come directly from axis units.
Common Mistakes
- Stating has units of (it does not).
- Using instead of when matching to .
- Mixing and units between table, graph, and final constants.
Things to Be Careful About
- If you plotted in , then must be in .
- Quote and to a sensible number of significant figures consistent with the precision of your graph reading (often 2–3 s.f.).
The rest of this paper
1 more questions- Q2Manipulation, Measurement and Observation · Analysis, Conclusions and Evaluation · Presentation of Data and Observations20M