Physics 9702/35 — May/June 2019
Cambridge AS Level · Advanced Practical Skills · worked solutions for every part, with the mark scheme
Topics Manipulation, Measurement and Observation · Presentation of Data and Observations · Analysis, Conclusions and Evaluation
In this experiment, you will investigate an electrical circuit.
You have been provided with two metre rules. One is labelled P and the other is labelled Q.
• Set up the circuit shown in Fig. 1.1.
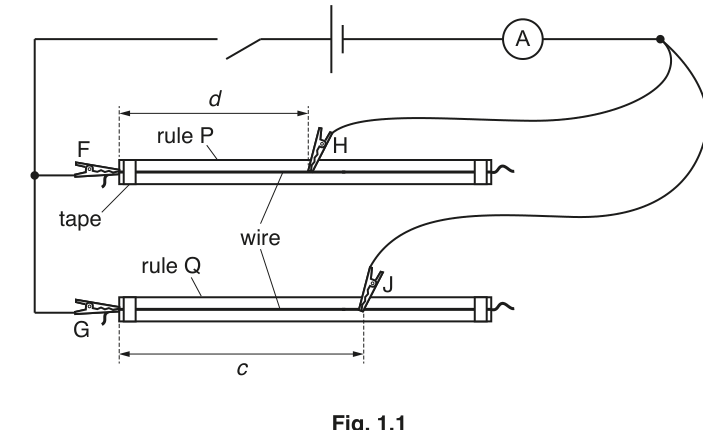
• F, G, H and J are crocodile clips.
Place H approximately half-way along the wire on rule P.
• The distance between F and H is , as shown in Fig. 1.1.
Record .
= ______
• Place J on the wire on rule Q so that the distance between G and J is approximately 60 cm. The distance between G and J is , as shown in Fig. 1.1.
• Record .
= ______
• Calculate , where .
= ______
• Close the switch.
• Record the ammeter reading .
= ______
• Open the switch.
Keeping constant, vary until you have six sets of readings of and . Do not use values of less than .
Record your results in a table. Include values of and in your table.
Plot a graph of on the -axis against on the -axis.
Draw the straight line of best fit.
Determine the gradient and -intercept of this line.
gradient = ______
-intercept = ______
It is suggested that the quantities and are related by the equation
where and are constants.
Using your answers in (c)(iii), determine values for and . Give appropriate units.
= ______
= ______
Theory suggests that is inversely proportional to and that is independent of . The experiment is repeated using the same equipment but a larger value of .
For this experiment, draw a second line on the graph to show the expected results. Label this line W.
The rest of this paper
1 more questions- Q2Manipulation, Measurement and Observation · Analysis, Conclusions and Evaluation · Presentation of Data and Observations20M