Physics 9702/31 — October/November 2016
Cambridge AS Level · Advanced Practical Skills · worked solutions for every part, with the mark scheme
Topics Manipulation, Measurement and Observation · Presentation of Data and Observations · Analysis, Conclusions and Evaluation
In this experiment, you will investigate the motion of a mass attached to a system of springs.
Set up the apparatus as shown in Fig. 1.1.
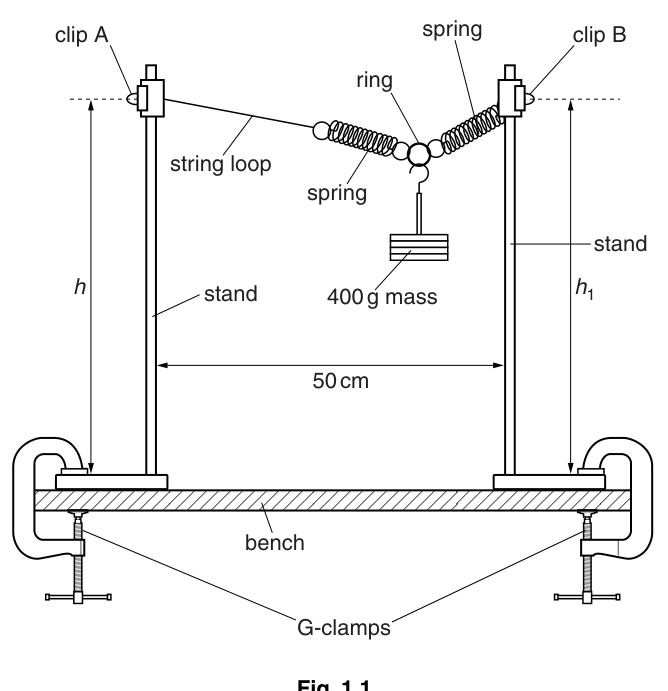
Slide the string loop over the rod of a stand and fix it in place near the top of the rod with one of the clips.
Slide the free loop of the spring over the other rod and fix it in place with the other clip.
The string loop in clip A is a height above the base of the stand and the spring loop in clip B is a height above the base of the stand. Adjust the apparatus until and are equal.
Measure and record .
= ______
Pull the 400 g mass down through a short distance.
Release the mass.
The mass will oscillate.
Determine the period of these oscillations.
= ______
The period of the oscillation of a mass attached to a system of springs is given by
where is the spring constant of the system.
The mass is 0.400 kg.
Using your answer in (b), calculate the corresponding value of .
Give your answer to an appropriate number of significant figures.
= ______
Slide the spring loop in clip B down by approximately 5 cm as shown in Fig. 1.2.
Do not move clip A.
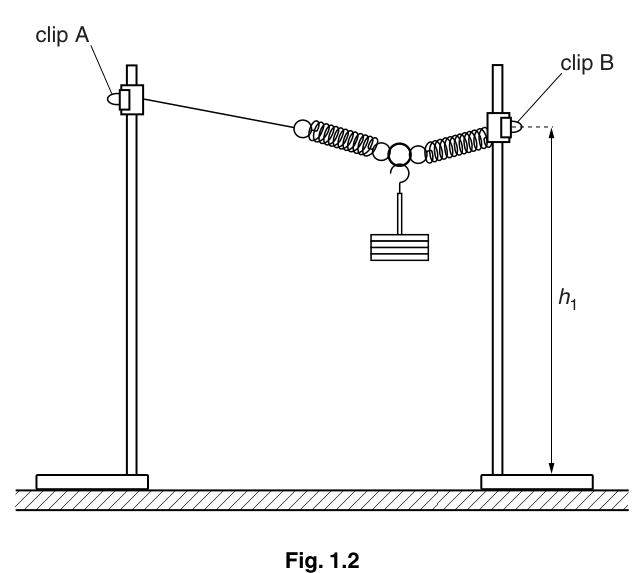
The spring loop in clip B is a height above the base of the stand.
Measure and record .
= ______
Calculate .
= ______
Repeat (b).
= ______
Vary and repeat (d)(ii), (d)(iii) and (b) until you have six sets of values of and . Do not move clip A.
Include in your table the two sets of values already taken.
Plot a graph of on the -axis against on the -axis.
Draw the straight line of best fit.
Determine the gradient and -intercept of this line.
gradient = ______
-intercept = ______
It is suggested that the quantities and are related by the equation
where and are constants.
Using your answers in (f)(iii), determine the values of and .
Give appropriate units.
= ______
= ______
The rest of this paper
1 more questions- Q2Manipulation, Measurement and Observation · Analysis, Conclusions and Evaluation · Presentation of Data and Observations20M