Physics 9702/33 — May/June 2015
Cambridge AS Level · Advanced Practical Skills · worked solutions for every part, with the mark scheme
Topics Manipulation, Measurement and Observation · Presentation of Data and Observations · Analysis, Conclusions and Evaluation
In this experiment, you will investigate how the position of a suspended card varies with the distribution of masses attached to it.
Use the nail to make two holes in the card as shown in Fig. 1.1 and Fig. 1.2.
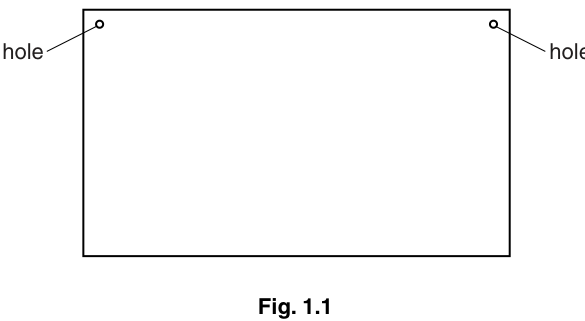
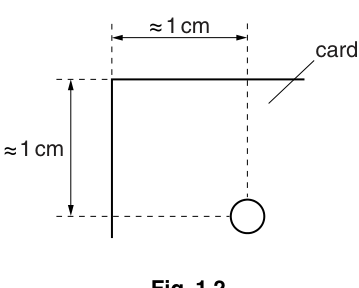
The holes should be approximately 1 cm from the edges of the card as shown in Fig. 1.2.
Each hole should be big enough for the card to swing freely when the nail is inserted in the hole.
Answer
Make two holes at the positions shown (about from each adjacent edge). Ensure each hole is large enough that the card swings freely on the nail.
Two holes made ~1 cm from edges; holes allow free swinging.
Background Concept
When an object is suspended from a point, it can rotate until its centre of mass lies vertically below the point of support. For this to happen reliably, the support point must act like a free pivot (minimal friction and no snagging), otherwise the card may stick and settle in an incorrect position.
Understanding the Question
You are being asked to prepare the card by making two suspension holes at specified positions. The exact positions matter because later you will draw plumb-line lines from each suspension point and find their intersection.
Approach
Use the diagram as a template to place the holes consistently: each is approximately from the top edge and from the side edge. Make the hole just big enough to rotate around the nail without rubbing.
Step-by-Step Reasoning
- Measure/estimate from the top edge and from the side edge for each of the two top corners, as in Fig. 1.2.
- Use the nail to pierce the card at each position.
- Enlarge each hole slightly (if needed) so that, when hung, the card can swing smoothly and does not jam on the nail.
Key Takeaways
- A good pivot (low friction) is essential for the card to align correctly under gravity.
- The position of the holes must match the diagram so the later geometry is consistent.
Common Mistakes
- Making the holes too small so the card catches on the nail and does not settle properly.
- Placing holes at noticeably different distances from the edges, leading to inconsistent results.
Things to Be Careful About
- Do not make the holes so large that the suspension point is ill-defined (this increases scatter in ).
- Avoid tearing the card around the hole; damage can change how the card hangs.
Record the mass of the card shown on the base of the stand.
= ______
Answer
(example, recorded to the balance resolution).
C = 12.4 g (example)
Background Concept
A balance measures mass. The key skill is recording the measurement with appropriate precision: you should not claim more precision than the instrument can provide.
Understanding the Question
You must record the mass of the card as shown on the base of the stand (i.e. the balance reading). This value will later be used in calculations such as .
Approach
Read the display carefully and copy it exactly, including the unit . Record the value to the number of decimal places shown by the balance.
Step-by-Step Reasoning
- Ensure the balance is stable and reading a steady value.
- Read directly from the display.
- Write it down with the unit .
Key Takeaways
- Precision comes from the instrument resolution.
- Always include units.
Common Mistakes
- Rounding incorrectly (e.g. writing when the balance reads ).
- Omitting the unit.
Things to Be Careful About
- If the display fluctuates, wait for it to stabilise or take a sensible average.
- Do not record extra decimal places that are not shown on the balance.
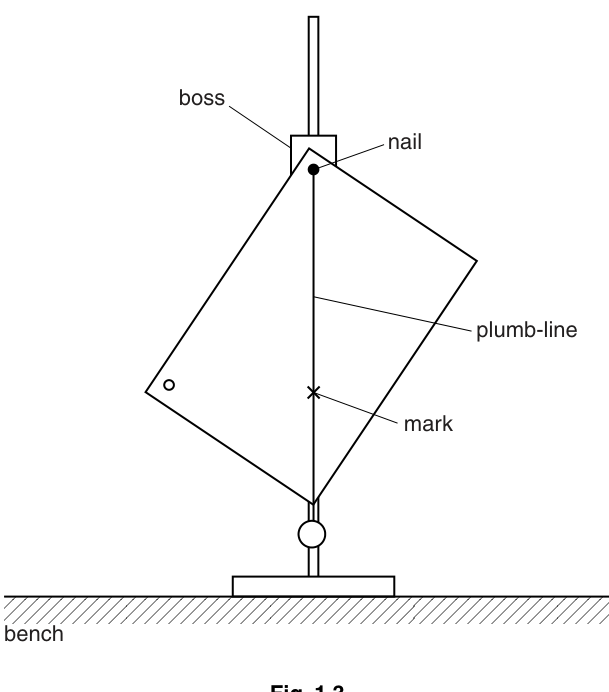
Set up the apparatus as shown in Fig. 1.3. Suspend the card from the nail through one of the holes. Hang the plumb-line from the nail. Mark the card at a point along the plumb-line as shown in Fig. 1.3.
Answer
Suspend the card from one hole on the nail, hang the plumb-line from the same nail, allow the card to come to rest, then mark the card at a point along the plumb-line.
Card suspended; plumb-line hung; mark made on card.
Background Concept
A plumb-line aligns itself with the gravitational field, so it shows the true vertical direction through the suspension point. When the card is at rest, the vertical line through the nail passes through the centre of mass.
Understanding the Question
You must set up the apparatus exactly as shown and create one mark on the card that lies on the vertical line (the plumb-line) passing through the suspension point.
Approach
Suspend the card freely so it can rotate, wait until it stops moving, then mark where the plumb-line lies against the card.
Step-by-Step Reasoning
- Put the nail through one hole and support it on the stand.
- Hang the plumb-line from the nail so it hangs beside/in front of the card.
- Wait until the card stops oscillating.
- Make a small clear mark on the card at a convenient point on the plumb-line.
Key Takeaways
- The plumb-line provides a reference vertical.
- Waiting for oscillations to die away improves accuracy.
Common Mistakes
- Marking while the card is still moving.
- Letting the plumb-line touch the card and be deflected sideways.
Things to Be Careful About
- Ensure the card can swing freely (no rubbing on the stand/boss).
- Make the mark fine (not thick), to reduce reading uncertainty later.
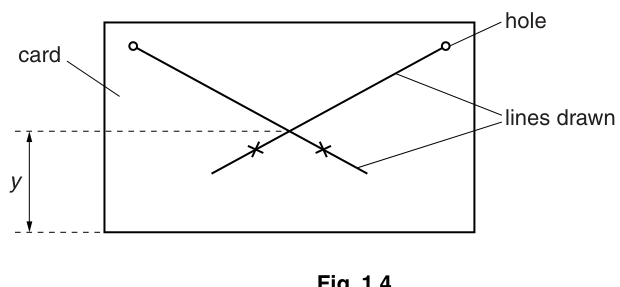
Remove the card. Draw a line on the card through the hole and the mark. This line should go just over half the length of the card as shown in Fig. 1.4.
Answer
Remove the card and draw a straight line through the hole and the mark. Extend the line to just over half the card length.
Line drawn through hole and mark; extended over half the card.
Background Concept
The line you draw represents the vertical line through the suspension point. Doing this for two different suspension points gives two verticals that should intersect at the centre of mass.
Understanding the Question
You must join the suspension hole and your plumb-line mark with a straight line, and extend it far enough that it will later cross the line from the second hole.
Approach
Use a ruler to draw a thin, accurate line through the two points, and extend it beyond the midpoint of the card so the intersection is clear.
Step-by-Step Reasoning
- Place the card on a flat surface.
- Align a ruler through the centre of the hole and the marked point.
- Draw a thin straight line and extend it to slightly more than half the card length.
Key Takeaways
- Two suspension positions give two vertical lines; their intersection locates the centre of mass.
Common Mistakes
- Drawing a short line so the intersection is hard to see.
- Drawing a thick line that makes the intersection position uncertain.
Things to Be Careful About
- Ensure the line passes through the centre of the hole (not the edge).
- Keep the card flat to avoid ruler slipping.
Repeat (b)(i) and (b)(ii) using the other hole in the card.
Answer
Repeat the suspension and plumb-line marking using the other hole, then draw the second straight line through that hole and its corresponding mark.
Procedure repeated with second hole; second line drawn.
Background Concept
One vertical line alone does not locate the centre of mass uniquely (it only tells you the centre of mass lies somewhere on that line). A second suspension point gives a second vertical; the centre of mass must lie on both lines, so it is at their intersection.
Understanding the Question
You must repeat parts (b)(i) and (b)(ii) using the other hole so you obtain a second line on the same card.
Approach
Perform the same careful suspension-and-marking procedure, then draw the second line accurately and ensure it crosses the first line.
Step-by-Step Reasoning
- Suspend the card from the second hole and hang the plumb-line from the nail.
- Wait for the card to come to rest, then make the mark.
- Remove the card and draw the second straight line through the second hole and its mark.
Key Takeaways
- Two lines are needed to determine a single point (intersection).
Common Mistakes
- Forgetting to wait for the card to settle, giving inconsistent lines.
- Mixing up marks (using the wrong mark with the wrong hole).
Things to Be Careful About
- Keep the marking method consistent (same type of mark and thickness).
- Ensure both lines are long enough to cross clearly.
Measure and record the distance as shown in Fig. 1.4.
= ______
Answer
Measure the vertical distance from the top edge of the card to the intersection of the two lines.
(example, to the nearest ).
y = 9.7 cm (example)
Background Concept
A measured length should be taken between clearly defined reference points. Here the reference points are: (1) the top edge of the card, and (2) the intersection of the two plumb-line lines.
Understanding the Question
You have drawn two lines on the card (one from each suspension hole). Where they cross is the determined position (centre of mass). You must measure , the vertical distance from the top edge down to that intersection point, as shown in Fig. 1.4.
Approach
Locate the intersection point accurately, then use a ruler to measure vertically from the top edge to that point. Record to the ruler resolution.
Step-by-Step Reasoning
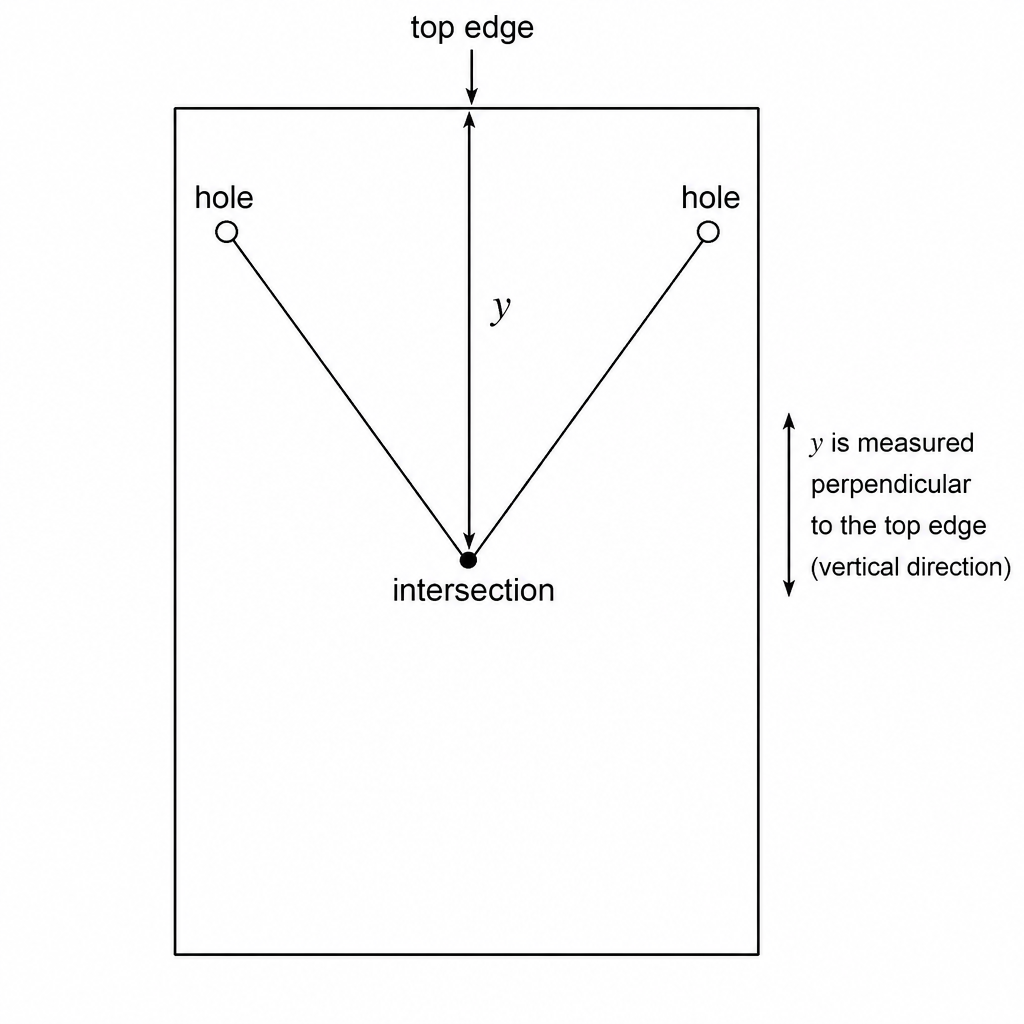
- Identify the point where the two drawn lines cross (use the centre of the crossing, not the edge of a thick line).
- Place a ruler with its zero aligned with the top edge of the card.
- Measure straight down (perpendicular to the top edge) to the intersection point.
- Record with unit (commonly ) and appropriate precision (e.g. nearest ).
Key Takeaways
- Use the correct reference: top edge to intersection point.
- Thin lines and careful reading reduce uncertainty.
Common Mistakes
- Measuring from the hole instead of from the top edge.
- Measuring along a slanted line rather than vertically.
- Recording without a unit.
Things to Be Careful About
- Avoid parallax: keep your eye directly above the ruler mark.
- If the intersection is a small region (due to thick pencil lines), estimate the centre.
- Record to a consistent precision to match later calculations.
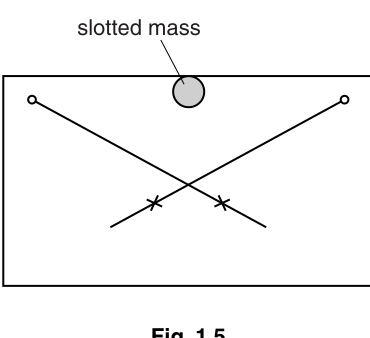
Using some Blu-Tack, attach one of the 10 g slotted masses to the card. The position of the slotted mass should be half-way along the edge of the card and touching the edge as shown in Fig. 1.5.
Answer
Attach one mass with Blu-Tack half-way along the edge of the card, touching the edge, as shown in Fig. 1.5.
10 g mass attached at midpoint of edge, touching the edge.
Background Concept
Changing where mass is located changes the centre of mass of the card–mass system. To study the relationship reliably, the mass must be placed in a consistent, repeatable position each time.
Understanding the Question
You must attach a single slotted mass at a specified location (half-way along the edge, touching the edge). This standardises the geometry so that only the total mass changes later.
Approach
Use Blu-Tack to hold the mass firmly, and align it carefully to the midpoint so its position does not vary between trials.
Step-by-Step Reasoning
- Find the midpoint of the specified edge of the card.
- Press a small amount of Blu-Tack onto the mass.
- Fix the mass so it is centred on the midpoint and touches the edge, as shown.
- Check it does not slip when the card is suspended.
Key Takeaways
- Keep the mass position constant so is the only variable changed in part (d).
Common Mistakes
- Placing the mass off-centre or not touching the edge.
- Using too little Blu-Tack so the mass moves during suspension.
Things to Be Careful About
- Ensure the mass is fixed at the same position when adding additional masses (stack directly above/behind).
Repeat (b) using the card with the mass attached.
= ______
Answer
Repeat (b) with the mass attached and measure .
(example).
y = 12.1 cm (example)
Background Concept
Adding a mass at the edge shifts the combined centre of mass, so the intersection point of the two vertical lines (and hence ) changes.
Understanding the Question
With one mass attached (so ), you repeat the same suspension-and-line procedure to find the new value.
Approach
Do exactly what you did in part (b), but ensure the added mass does not move and the card still swings freely. Then measure from the top edge to the new intersection.
Step-by-Step Reasoning
- Suspend the card from the first hole, hang the plumb-line, and mark.
- Draw the line through the first hole and mark.
- Repeat for the second hole to get the second line.
- Measure from the top edge to the intersection.
Key Takeaways
- Consistency of method between trials is crucial for a meaningful graph later.
Common Mistakes
- Forgetting to redraw/identify the correct intersection for the new setup.
- Allowing the mass to shift position between suspensions.
Things to Be Careful About
- Use the same units and precision for all values.
- Ensure the plumb-line is not obstructed by the attached mass.
The mass attached to the card is . Increase by fixing another 10 g slotted mass on top of, or behind, the first mass.
Record and repeat (b) until you have six sets of readings of and . Include your results from (b) and (c).
Include values of in your table.
Answer
Obtain 6 readings including and , then increase in steps up to ; measure each time and calculate .
Example table (using ):
(Values shown are examples; candidates use their own readings.)
Six sets of m, y with calculated y(C+m) in one table (student-dependent).
Background Concept
In practical work you must present results clearly so patterns can be analysed. A good table:
- has clear column headings with quantity and unit,
- has a sensible range and number of readings,
- shows consistent precision,
- includes any derived quantity required (here ).
Understanding the Question
You must increase the attached mass by adding masses until you have six pairs of , including the earlier cases with no added mass (from part (b), so ) and one mass (from part (c), so ). You also must calculate for each row and include it in the same table.
Approach
Use as the independent variable. Choose six values: (or similar). For each :
- measure using the same method,
- compute ,
- compute , and record with appropriate units and s.f.
Step-by-Step Reasoning
- Start with (no slotted mass attached) and record your measured .
- Attach one mass () and record .
- Add additional masses one at a time, keeping them stacked in the same position so only changes.
- For each row calculate
using your measured and your measured .
5. Record all values in one table with headings such as , , and .
Key Takeaways
- Six readings across a range improve the reliability of the graph.
- Derived quantities must be calculated correctly and consistently.
Common Mistakes
- Forgetting to include the data from (b) or the data from (c).
- Splitting results into multiple tables.
- Missing units in headings, or writing headings like “m (g)” incorrectly without the quantity symbol.
- Calculating incorrectly (e.g. ).
Things to Be Careful About
- Use consistent precision for across all rows (e.g. all to ).
- Use the same unit for all masses (g) and do not mix g and kg.
- When multiplying, the unit becomes (or if you used mm consistently).
Plot a graph of on the -axis against on the -axis.
Answer
Plot on the -axis against on the -axis.
- Label axes: and .
- Use a suitable scale (at least half the grid in each direction).
- Plot all six points with small, neat crosses.
Graph of y(C+m) vs m plotted (student-dependent).
Background Concept
A graph reveals the relationship between variables. Good graph technique includes correct axis labels with units, an appropriate scale (not cramped), accurate plotting, and clear points.
Understanding the Question
You must plot a graph with:
- horizontal axis:
- vertical axis:
using your tabulated values from (d).
Approach
Decide axis ranges that cover all your data with some margin, choose scales that use most of the grid, label with quantity/unit, then plot each data point.
Step-by-Step Reasoning
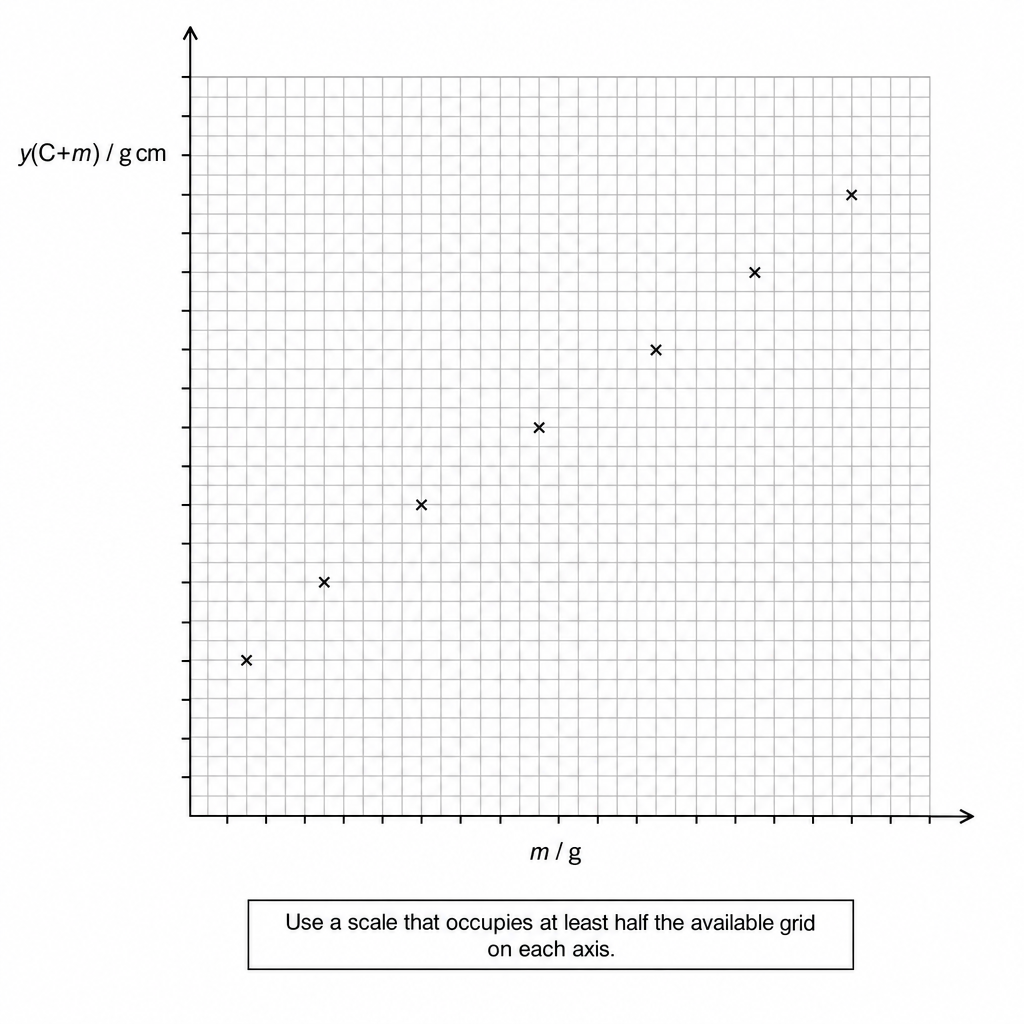
- On the -axis write and mark a scale covering your minimum to maximum .
- On the -axis write and choose a scale covering your computed values.
- Plot each pair as a small cross.
- Check for any obvious mis-plotted point by comparing with the expected trend.
Key Takeaways
- Axes must be labelled with quantity and unit.
- A good scale improves the precision of gradients and intercepts.
Common Mistakes
- Swapping axes (plotting on the -axis).
- Writing units incorrectly or missing them.
- Using awkward scales (e.g. 3 squares = 7 units) that reduce accuracy.
Things to Be Careful About
- Keep the same derived-unit convention throughout (e.g. if in cm, then in ).
- Plot with sharp pencil; large blobs reduce accuracy for best-fit lines.
Draw the straight line of best fit.
Answer
Draw a single straight line of best fit (not dot-to-dot), with roughly equal scatter of points above and below the line, extended across the full range of the plotted data.
Straight line of best fit drawn.
Background Concept
When theory suggests a linear relationship, experimental points may scatter due to random uncertainties. A best-fit line represents the underlying trend rather than connecting every point.
Understanding the Question
After plotting your points, you must draw the best straight line representing the trend of against .
Approach
Use a ruler to draw one straight line that is a good compromise: the points should be distributed fairly evenly above and below.
Step-by-Step Reasoning
- Visually judge the overall trend of the points.
- Place a ruler so that the line passes through the central tendency of the points.
- Draw the straight line and extend it across the main cluster (and usually slightly beyond the extreme points).
Key Takeaways
- Best-fit is about balance, not passing through every point.
Common Mistakes
- Joining points dot-to-dot.
- Forcing the line through the origin when it does not match the data.
Things to Be Careful About
- Do not let one outlier point dominate the line position.
- Use a thin pencil line to make later gradient/intercept readings more accurate.
Determine the gradient and -intercept of this line.
gradient = ______
-intercept = ______
Working
Use two well-separated points on the best-fit line.
From the best-fit line (example):
-intercept (example):
Answer
gradient
-intercept
gradient = 15.0 cm, y-intercept = 120 g cm (example)
Background Concept
For a straight-line graph, the gradient is the rate of change of with :
The -intercept is the value of when (where the line crosses the -axis). Units come from the axes: here has units and has units , so the gradient has units .
Understanding the Question
You must find numerical values for:
- the gradient of your best-fit line on the graph of against ,
- the -intercept of that best-fit line.
Approach
Pick two points that lie on the drawn best-fit line (not necessarily measured points), far apart to reduce percentage reading error. Compute gradient using changes in coordinates. Then read the intercept where the line crosses the -axis.
Step-by-Step Reasoning
- Choose two well-separated points on the line (e.g. near the left and right ends of the plotted range).
- Read their coordinates: and where .
- Calculate
- Determine the intercept by reading the value of at (the crossing with the -axis).
- Quote units: gradient in and intercept in .
Key Takeaways
- Use two points on the best-fit line, far apart.
- Always compute gradient as .
- Units of gradient come from axis units.
Common Mistakes
- Using two experimental points that are close together, leading to a large gradient uncertainty.
- Doing by mistake.
- Giving gradient with the wrong unit (e.g. ).
Things to Be Careful About
- Do not use the small triangle between adjacent grid lines; use a large triangle.
- Read values carefully; a small intercept reading error can propagate into part (f).
It is suggested that the quantities , and are related by the equation
where and are constants.
Use your answers in (e)(iii) to determine the values of and . Give appropriate units.
= ______
= ______
Working
Given
Comparing with for a graph of against :
So
Using gradient and intercept (example):
Answer
A = 15.0 cm, B = 16.0 g (example)
Background Concept
If experimental data follow a linear form
then the gradient of a graph of against is , and the -intercept is .
Here the suggested relationship is
which is already in linear form if we define and .
Understanding the Question
You have already plotted against and found the gradient and -intercept. You must now use those two graph features to determine the constants and , including their units.
Approach
- Identify what corresponds to the gradient and intercept by comparing directly with .
- Use the intercept expression to solve for .
- Determine units from the equation: has units .
Step-by-Step Reasoning
Let
and . Then
So:
- gradient
- intercept
Rearrange the intercept to find :
Units:
- is in and is in , so gradient has units , hence is in .
- Intercept is , so has units ; since is , must be .
Key Takeaways
- Matching to is a powerful way to extract constants.
- Always check units as a consistency test.
Common Mistakes
- Swapping and (thinking is the gradient).
- Using instead of for the intercept.
- Giving incorrect units (e.g. in cm).
Things to Be Careful About
- Use your own measured gradient and intercept, not the example values.
- Keep consistent units for (cm or mm) throughout; units of and the intercept follow from that choice.
The rest of this paper
1 more questions- Q2Manipulation, Measurement and Observation · Analysis, Conclusions and Evaluation · Presentation of Data and Observations20M