Physics 9702/35 — May/June 2014
Cambridge AS Level · Advanced Practical Skills · worked solutions for every part, with the mark scheme
Topics Manipulation, Measurement and Observation · Presentation of Data and Observations · Analysis, Conclusions and Evaluation
In this experiment, you will investigate a system in equilibrium due to several forces.
You have been provided with a wooden beam with 11 holes.
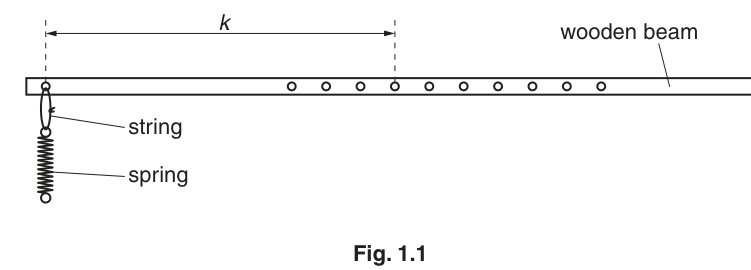
Measure and record the distance along the wooden beam between the centres of hole 1 and hole 5 as shown in Fig. 1.1.
= ______
Answer
Measure between the centres of holes 1 and 5 using a rule.
12.0 cm
Background Concept
In Paper 3, marks for a simple measurement mainly come from good technique and appropriate recording. A length measured with a metre rule should be:
- read with the eye normal to the scale (to avoid parallax),
- taken between the correct reference points (here, the centres of the holes),
- recorded to the precision allowed by the scale (typically to the nearest , i.e. ).
Understanding the Question
You are asked to measure the distance along the beam between the centre of hole 1 and the centre of hole 5 (as indicated by the diagram). The answer space expects a single numerical value with a unit.
Approach
- Place the rule along the beam.
- Identify the centres of holes 1 and 5.
- Read the scale at each centre and subtract (or align one centre with zero and read directly).
- Record with a unit and suitable precision.
Step-by-Step Reasoning
- Align the rule so that its scale is parallel to the beam.
- Either:
- put the mark at the centre of hole 1 and read the position of the centre of hole 5, or
- read both positions and calculate the difference.
- Record in cm to (or in mm), for example .
Key Takeaways
- Measure between the correct points (centres).
- Avoid parallax.
- Record with appropriate precision and a unit.
Common Mistakes
- Measuring from the edge of a hole instead of its centre.
- Not aligning the rule with the beam (introduces systematic error).
- Recording without a unit.
Things to Be Careful About
- If the end of the rule is worn, it is better to measure using two readings and subtract.
- Make sure the hole centres are judged consistently (use the same reference method each time).
Set up the apparatus as shown in Fig. 1.2 with the nail through hole 6 of the wooden beam.
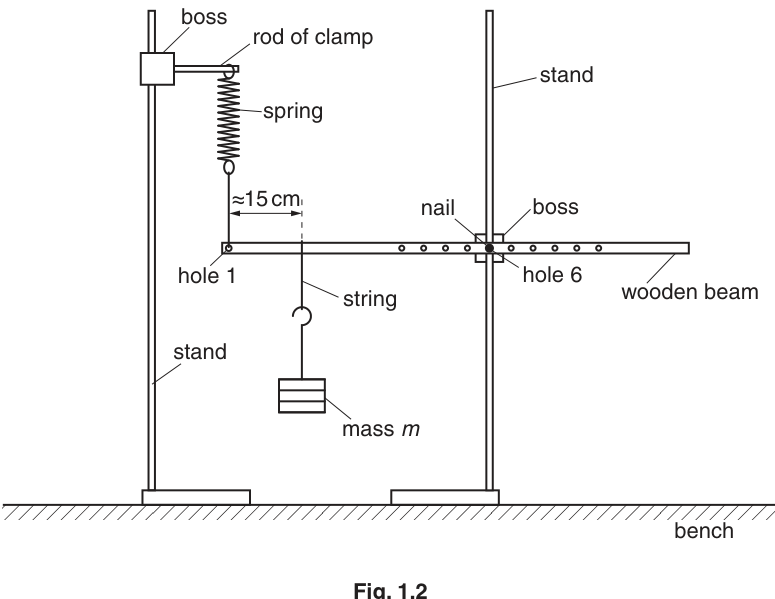
The mass is . Position the mass approximately from hole 1.
Answer
Set up the beam and supports as in Fig. 1.2 with the nail through hole 6.
Hang the mass so it is approximately from hole 1.
Apparatus set up as Fig. 1.2; 300 g hung about 15 cm from hole 1.
Background Concept
In equilibrium practicals, the apparatus must be stable and reproducible. The main experimental skill here is correct assembly: ensuring the pivot (nail), beam, spring, and mass are connected exactly as intended.
Understanding the Question
You are instructed to set up the equipment like Fig. 1.2, specifically:
- the nail passes through hole 6,
- the mass is ,
- the mass is initially placed about from hole 1.
Approach
- Reproduce the diagram: pivot at hole 6, spring-string at hole 1, mass hanging from the beam.
- Ensure all clamps are tight and the beam is supported securely.
Step-by-Step Reasoning
- Place the beam on the nail through hole 6, held by the clamp stand.
- Attach the spring vertically to its support.
- Connect the bottom of the spring to the string and attach the string to hole 1 of the beam.
- Hang the mass from the beam at a point roughly from hole 1 (this is just an initial position; it will be adjusted later).
Key Takeaways
- Practical marks come from setting up the correct geometry.
- Initial positioning only needs to be approximate if later adjusted.
Common Mistakes
- Putting the nail through the wrong hole.
- Attaching the spring string to the wrong hole.
- Allowing the beam to rub against the clamp (adds friction and affects equilibrium).
Things to Be Careful About
- Make sure the mass hangs freely and does not touch the bench.
- Check that strings are taut and not snagged on the beam.
Adjust the apparatus so that the spring is vertical and the wooden beam is horizontal.
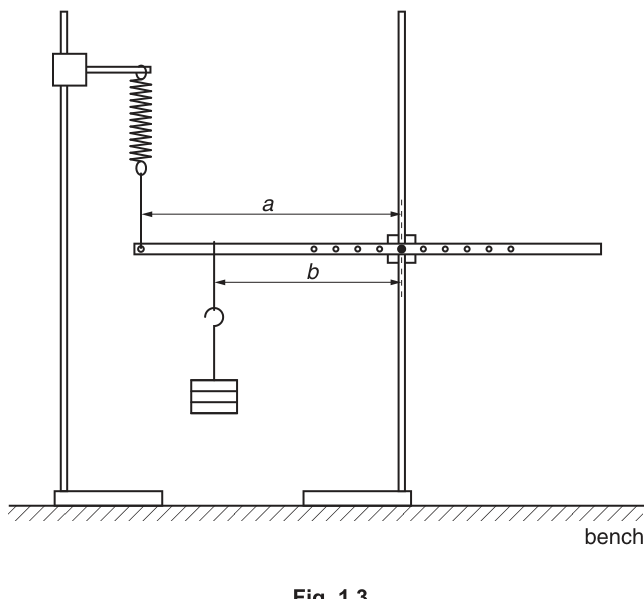
The distance is the distance between the nail and the string attached to the spring.
The distance is the distance between the nail and the string attached to the mass as shown in Fig. 1.3.
Answer
Adjust until:
- the spring is vertical
- the wooden beam is horizontal.
Spring vertical; beam horizontal.
Background Concept
For equilibrium measurements, the geometry matters. If the spring is not vertical or the beam is not horizontal:
- distances and are no longer the intended perpendicular lever arms,
- extra components of force and unwanted torques can appear,
- repeatability is reduced.
Understanding the Question
You must adjust the apparatus so that the spring is vertical and the beam is horizontal before measuring distances.
Approach
- Move the positions of clamps/stands and (later) the hanging mass to achieve the required orientation.
- Re-check alignment after each adjustment.
Step-by-Step Reasoning
- View the spring against a vertical reference (e.g. a retort stand) and adjust until it hangs straight down.
- View the beam and adjust the mass position or supports until the beam is level.
- Ensure nothing is moving and the beam is at rest before taking readings.
Key Takeaways
- Correct alignment reduces systematic errors.
- Always align first, then measure.
Common Mistakes
- Measuring and while the beam is slightly tilted.
- Assuming the spring is vertical without checking (it can be pulled sideways by the string).
Things to Be Careful About
- After moving the mass or nail, the system may rotate slightly; re-check vertical/horizontal each time.
- Make sure the spring is not twisting or caught, which can pull it away from vertical.
Measure and record and .
= ______
= ______
Answer
Measure distances on the horizontal beam.
a = 15.8 cm, b = 26.3 cm
Background Concept
Distances such as and are measured along the beam and are used later to form derived quantities ( and ). Small errors in or can noticeably affect a graph because is sensitive to changes in .
Understanding the Question
You must measure:
- : the distance from the nail (pivot) to the string attached to the spring,
- : the distance from the nail (pivot) to the string attached to the mass,
as shown in Fig. 1.3.
Approach
- Ensure the beam is horizontal and at rest.
- Use a rule to measure along the beam between the correct points.
- Record both values with consistent precision.
Step-by-Step Reasoning
- Identify the pivot position (nail through the beam).
- Identify the vertical line of the spring-string attachment point and the vertical line of the mass-string attachment point.
- Measure the horizontal distances from the pivot to each point.
- Record, for example: and (to if using a mm scale).
Key Takeaways
- Measure between the correct reference points.
- Use consistent units and precision.
Common Mistakes
- Measuring from the wrong side of the nail (using an incorrect reference point).
- Measuring diagonally instead of along the beam.
- Recording and to different precisions.
Things to Be Careful About
- If the string has thickness, measure to its centre line for consistency.
- Re-check that the beam has not moved while measuring.
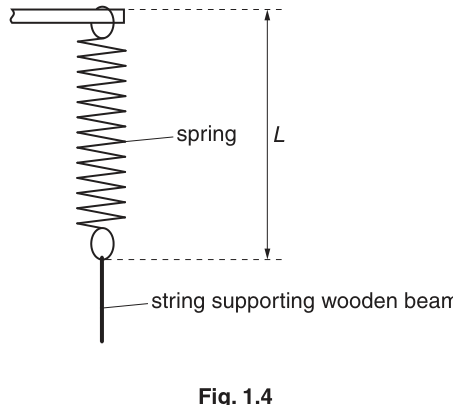
Measure and record the length of the stretched spring as shown in Fig. 1.4.
= ______
Answer
Measure the length of the coiled part of the stretched spring.
8.5 cm
Background Concept
When a spring is stretched, its length (or extension) is linked to the force it provides. In this experiment, later readings are taken while keeping the same, so that the spring force is kept (approximately) constant.
Understanding the Question
You must measure , the length of the coiled part of the stretched spring (as indicated in Fig. 1.4), and record it.
Approach
- Read the spring length between the two indicated endpoints.
- Record to a sensible precision.
Step-by-Step Reasoning
- Identify the top and bottom of the coiled section (not including hooks if the diagram indicates coil-only).
- Place the rule close to the spring and read at eye level.
- Record, for example, .
Key Takeaways
- Measure exactly what the diagram defines as .
- Keep the same definition of endpoints throughout.
Common Mistakes
- Measuring including the hook when is defined for the coiled section only.
- Allowing the rule to be at an angle to the spring.
Things to Be Careful About
- Make sure the spring is vertical; otherwise the measured length can be misleading.
- Avoid parallax when reading the scale.
Vary by moving the nail to a different hole.
Adjust until the value of is the same as in (b)(iv).
Ensure that the spring is vertical and the beam is horizontal.
Measure and record and .
= ______
= ______
Answer
Move the nail to a different hole to change .
Adjust the position of the mass until is the same as in (b)(iv).
Ensure spring vertical and beam horizontal.
Record, e.g.
Example: a = 9.5 cm, b = 23.8 cm (with L kept the same)
Background Concept
To investigate a relationship between two distances, you must vary one variable systematically while controlling others. Here, you change (by moving the nail) and then adjust so that stays constant. Keeping constant helps keep the spring force the same from run to run.
Understanding the Question
You must:
- change by choosing a different hole for the nail,
- then adjust until the spring length matches the earlier value,
- then measure and record the new and .
Approach
- Move nail to a new hole (new pivot position) → changes.
- Slide the mass along the beam until the spring length returns to the original .
- Re-check spring vertical and beam horizontal.
- Measure and and record with units.
Step-by-Step Reasoning
- After moving the nail, the beam will not be in equilibrium immediately; adjust the mass position.
- Compare the spring length to the previous reading; adjust until it matches.
- Once stable, measure and along the beam.
- Record a pair of readings (example values shown in the solution).
Key Takeaways
- Vary systematically.
- Keep constant as a control condition.
- Measure only once the system is stationary and aligned.
Common Mistakes
- Not returning to the original value before measuring and .
- Forgetting to re-level the beam and re-verticalise the spring after adjustments.
Things to Be Careful About
- Judge consistently (same endpoints and same viewing angle each time).
- Small changes in may significantly change equilibrium; adjust gently and allow oscillations to stop.
Repeat (c) until you have six sets of readings of and .
Include values of and in your table.
Answer
Take six sets of readings of and (with unchanged), and calculate and .
Example of a suitable table:
| / | / | / | |
|---|---|---|---|
| 4.4 | 21.7 | 0.0461 | 0.202 |
| 9.5 | 23.8 | 0.0420 | 0.399 |
| 15.8 | 26.3 | 0.0380 | 0.601 |
| 23.5 | 29.4 | 0.0340 | 0.799 |
| 33.3 | 33.3 | 0.0300 | 1.00 |
| 46.2 | 38.5 | 0.0260 | 1.20 |
Table of 6 readings of a and b with calculated 1/b and a/b (see working).
Background Concept
A good practical table must allow someone else to understand and use your data. The required derived quantities here are:
and
If and are measured in cm, then has unit , while is dimensionless.
Understanding the Question
You must repeat part (c) until you have six sets of readings. You then need one clear table containing:
- measured and ,
- calculated ,
- calculated .
Approach
- Choose at least six different nail positions to vary over a reasonable range.
- For each, adjust the mass position until the spring length matches the original value.
- Measure and , then compute and .
- Present all values in one table with correct headings and units.
Step-by-Step Reasoning
- Collect six readings:
- Each run: new (new nail hole) → adjust until matches → measure and .
- Calculate columns for each row:
and
- Presentation requirements:
- Put the unit in the heading, e.g. .
- Keep consistent precision for and (e.g. to ).
- Quote to a sensible number of significant figures (often 3 s.f.).
Key Takeaways
- A complete table has quantity, symbol, and unit in headings.
- Derived quantities must be calculated correctly with correct units.
- Use a good range of values to improve graph reliability.
Common Mistakes
- Missing units in the headings (e.g. writing just "" instead of "").
- Writing without unit.
- Inconsistent decimal places within a column.
- Calculating incorrectly (e.g. ).
Things to Be Careful About
- Since is a reciprocal, small errors in can affect noticeably; measure carefully.
- Ensure is genuinely the same in every run; otherwise the relationship you graph may not be linear.
Plot a graph of on the -axis against on the -axis.
Answer
Plot () against .
- Label axes: -axis (no unit), -axis .
- Use a suitable scale (at least half the grid in both directions).
- Plot all six points accurately.
Graph of 1/b (y) against a/b (x) plotted with correct labels and scales.
Background Concept
Graph marks in Paper 3 depend on:
- correct choice of variables on each axis,
- correct axis labels with units,
- sensible scales (not cramped; not awkward like 3 squares = 1 unit),
- accurate plotting (small, neat crosses/dots).
Understanding the Question
You must plot a graph with:
- -axis: ,
- -axis: .
You will use your table from (d).
Approach
- Compute each pair from the table.
- Choose axis ranges that include all points.
- Label with correct units.
- Plot each point carefully.
Step-by-Step Reasoning
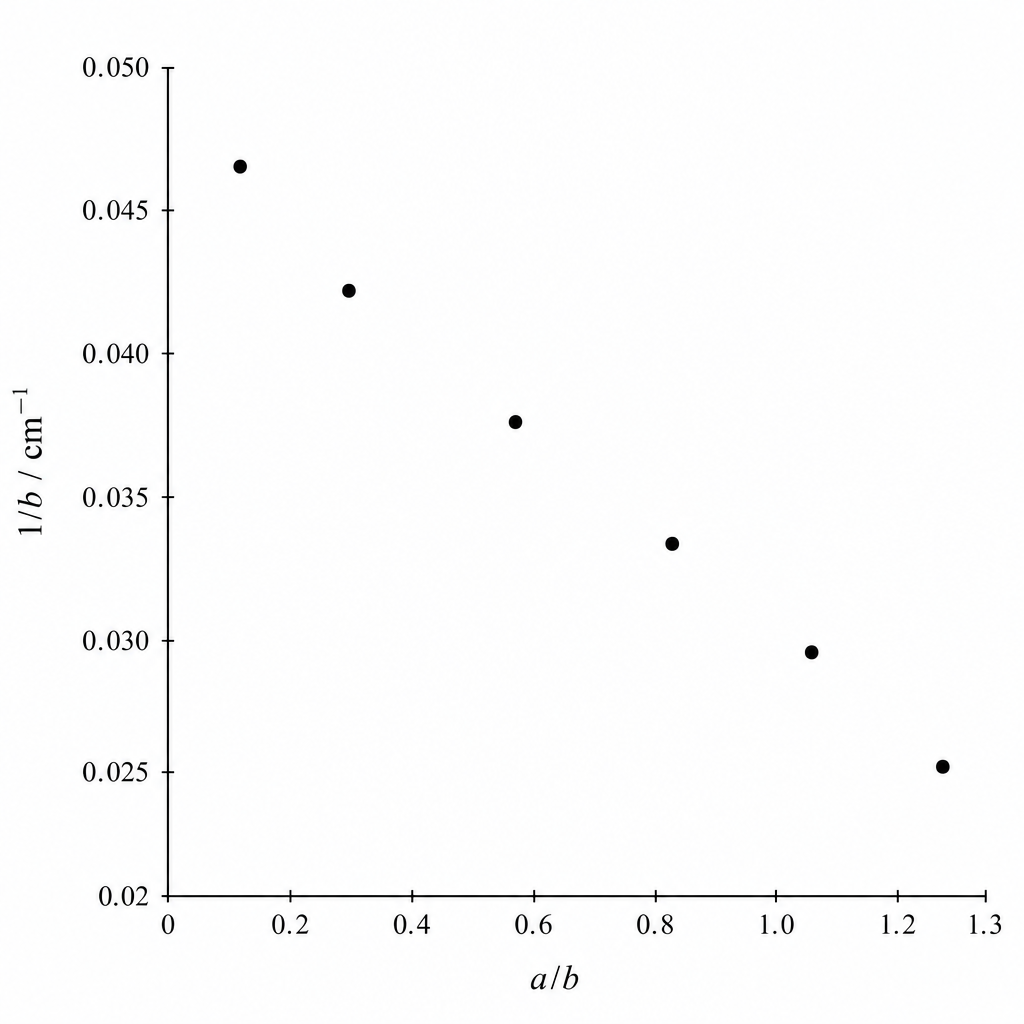
- is dimensionless, so label the -axis as .
- If is in cm then is in , so label the -axis as .
- Use a scale that spreads the data out (typically using at least half the graph paper in each direction).
- Plot all six points from your table.
Key Takeaways
- Put the unit in the axis label for .
- Use good scales and neat plotting to gain full marks.
Common Mistakes
- Swapping axes (plotting on the -axis).
- Missing the unit on .
- Using a poor scale so points occupy only a small corner.
Things to Be Careful About
- Plotting accuracy: use a sharp pencil and small crosses.
- Make sure you plot each row from your table correctly; one transposed value can spoil linearity.
Draw the straight line of best fit.
Answer
Draw a single straight line of best fit through the plotted points (approximately equal scatter of points on either side).
Straight line of best fit drawn.
Background Concept
A best-fit line is not drawn point-to-point. For experimental scatter, the best-fit line should represent the overall trend so that points are roughly balanced above and below the line.
Understanding the Question
After plotting the points, you must draw the straight line that best represents the relationship.
Approach
- Use a ruler.
- Place the line so the total scatter is balanced.
- Extend the line over the full range of plotted points.
Step-by-Step Reasoning
- Visually judge the trend (here it should be a straight line with negative gradient).
- Position the ruler and draw one thin straight line.
- Do not force the line through every point; allow for random scatter.
Key Takeaways
- One straight, thin best-fit line.
- Balanced scatter.
Common Mistakes
- Joining dots.
- Forcing the line through an outlier when most points follow a different trend.
Things to Be Careful About
- The line should be long enough to allow accurate gradient/intercept reading later.
- Keep the line thin; thick lines reduce reading accuracy.
Determine the gradient and -intercept of this line.
gradient = ______
-intercept = ______
Working
Using two well-separated points on the best-fit line, e.g.
and .
-intercept from line (at ):
Answer
gradient
-intercept
gradient = −0.020 cm⁻¹, y-intercept = 0.050 cm⁻¹
Background Concept
For a straight-line graph of the form:
the gradient is:
and the y-intercept is , the value of when .
Units:
- Here, is a ratio of lengths, so it has no unit.
- has unit of reciprocal length, e.g. (or if using metres).
So the gradient has the same unit as .
Understanding the Question
You must find two numerical quantities from your drawn best-fit line:
- the gradient,
- the y-intercept.
These will be used later to calculate constants.
Approach
- Use a large triangle on the best-fit line (choose two points far apart to reduce percentage reading error).
- Compute and and divide.
- Read (or calculate) the y-intercept at .
Step-by-Step Reasoning
- Pick two points on the line (not necessarily measured points) that lie exactly on grid intersections if possible.
- Read their coordinates carefully.
- Calculate:
- Because the line slopes downwards, the gradient should be negative.
- For the y-intercept, extend the line to meet the y-axis and read the value at .
Key Takeaways
- Gradient is always , using two well-separated points.
- Intercept is read where the best-fit line crosses the y-axis.
- Include correct units for gradient and intercept.
Common Mistakes
- Using (inverting the gradient).
- Using two points that are too close together (large percentage uncertainty).
- Finding the intercept from a data point rather than from the best-fit line.
- Forgetting the negative sign on a downward-sloping graph.
Things to Be Careful About
- Use consistent units: if is in cm, keep in throughout.
- Read values to a sensible precision based on your graph scale (do not overstate precision).
The quantities and are related by the equation
where and are constants.
Use your answers in (e)(iii) to determine the values of and .
Give appropriate units.
= ______
= ______
Working
Given
Let and :
So gradient and y-intercept .
Answer
P = 0.020 cm⁻¹, Q = 0.050 cm⁻¹
Background Concept
Most Paper 3 graph analysis is about recognising the straight-line form:
and matching your plotted variables to and so you can identify:
- gradient ,
- intercept ,
then relate these to physical constants.
Understanding the Question
You are given:
You have already plotted against , and you have found the gradient and y-intercept. You must now use those graph values to find and and give units.
Approach
- Rewrite the given equation so it looks exactly like .
- Identify which symbol corresponds to the gradient and which corresponds to the intercept.
- Use the sign carefully: the gradient equals .
- Work out units from the fact that is dimensionless and has unit of reciprocal length.
Step-by-Step Reasoning
- Define the plotted variables:
- Substitute into the given equation:
- Compare with :
- Hence:
and
- Units:
- has no unit.
- has unit (or ).
Therefore both and have unit , and so does .
Key Takeaways
- Always rewrite into using the variables you actually graphed.
- The negative sign matters: here is the negative of the gradient.
- Units come from the axis units.
Common Mistakes
- Taking equal to the gradient instead of the negative of the gradient.
- Giving no unit (it does have units here).
- Mixing cm and m without converting (e.g. using in with in m).
Things to Be Careful About
- If your gradient is negative (as expected), should come out positive.
- Use a consistent unit system for later calculations (especially part (g)).
The mass of the wooden beam is given by
Use values in (a), (b)(i) and (f) to determine the value of .
Include a unit for .
= ______
Working
Answer
0.500 kg
Background Concept
When a formula involves experimental constants (here from a graph and from a measurement), full marks depend on:
- correct substitution,
- consistent units,
- a final answer with the correct unit.
Understanding the Question
You are given:
You must use:
- (given in the instructions),
- your measured from (a),
- your value of from (f),
to calculate .
Approach
- Convert all quantities to a consistent unit system (preferably SI: kg, m, ).
- Substitute into the formula.
- Check units: is dimensionless because has unit m and has unit .
Step-by-Step Reasoning
- Write the formula clearly:
- Convert units:
- : .
- : if measured in cm, convert to m by dividing by 100.
- : if in , convert to by multiplying by 100 (because ).
- Substitute and calculate.
- Quote with unit kg (or g if you stayed consistently in g and cm).
Key Takeaways
- Convert carefully: reciprocal units can be tricky.
- Check that your final unit is a mass unit.
Common Mistakes
- Using in cm while using in (or vice versa).
- Converting to the wrong way round.
- Omitting the unit for .
Things to Be Careful About
- If you keep everything in cm and g, that is fine provided you keep it consistent:
- in g, in cm, in gives in g.
- Do not over-round intermediate values; round at the end to an appropriate number of significant figures.
The rest of this paper
1 more questions- Q2Manipulation, Measurement and Observation · Analysis, Conclusions and Evaluation · Presentation of Data and Observations20M