Physics 9702/33 — May/June 2014
Cambridge AS Level · Advanced Practical Skills · worked solutions for every part, with the mark scheme
Topics Manipulation, Measurement and Observation · Presentation of Data and Observations · Analysis, Conclusions and Evaluation
In this experiment, you will investigate how the current in a circuit varies as the resistance of the circuit is changed.
Measure and record the length of wire between the crocodile clips on the wire labelled F.
= ______
Answer
Measure on the metre rule to the nearest (or ).
Example (typical):
L = 50.0 cm (example)
Background Concept
A metre rule gives a length by reading positions on a scale. The length between two points is the difference between the two position readings. The main measurement issues are (i) parallax (reading from an angle) and (ii) using an appropriate resolution (typically ).
Understanding the Question
You are asked to find , the length of wire F between its two crocodile clips. This value is later used in calculated quantities such as , so must be recorded clearly with a unit.
Approach
Place the crocodile clips so their contact points are against the metre rule scale. Read the position of each clip contact point, then subtract to get . Record to the same precision as the scale permits.
Step-by-Step Reasoning
- Align the wire (or the clip contact points) along the metre rule.
- Read the scale at the first clip contact point (not the outer edge of the clip casing).
- Read the scale at the second clip contact point.
- Calculate .
- Record with unit (e.g. ) and appropriate dp (e.g. if measuring to ).
Key Takeaways
- Length should be obtained from two position readings.
- Always quote a unit and match the precision to the instrument.
Common Mistakes
- Reading the wrong reference point on the crocodile clip (gives systematic error).
- Writing no unit.
- Recording too many decimal places (false precision).
Things to Be Careful About
- Eye must be directly above the scale marking to avoid parallax.
- If later using in , keep in as well (consistent units in formulas).
Set up the circuit as shown in Fig. 1.1.
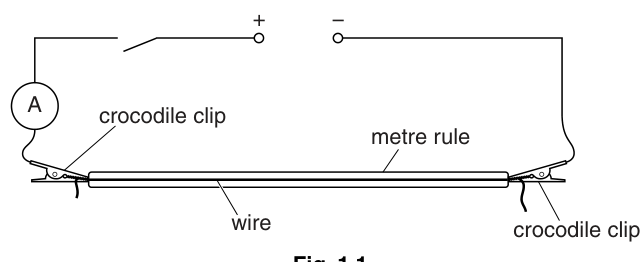
Answer
Circuit connected as in Fig. 1.1 with the ammeter in series, crocodile clips making firm contact, and the switch initially open.
Circuit set up as in Fig. 1.1
Background Concept
In a d.c. circuit, the current is measured by an ammeter. An ammeter must be connected in series so that the same current passes through it as through the component being tested. Incorrect connection (e.g. across the supply) can give wrong readings and may damage the meter.
Understanding the Question
You are instructed to build the circuit shown. This is essential context for later measurements of current when the effective resistance is changed.
Approach
Follow the diagram exactly: power supply → switch → ammeter → wire on metre rule → back to power supply. Ensure crocodile clips contact the wire properly.
Step-by-Step Reasoning
- Connect the power supply terminals to the circuit as shown.
- Put the switch in series so it controls the whole circuit.
- Place the ammeter in series (not in parallel) and select a suitable range.
- Connect crocodile clips firmly onto the wire on the metre rule; poor contact increases resistance unpredictably.
- Keep the switch open until ready to take readings.
Key Takeaways
- Ammeter must be in series.
- Good electrical contact is crucial for reliable results.
Common Mistakes
- Connecting the ammeter in parallel.
- Leaving the switch closed while adjusting clips (heating changes resistance).
Things to Be Careful About
- Ensure the ammeter range is appropriate to avoid overload.
- Check for loose leads; intermittent contact gives fluctuating current.
Attach wire F to the wire on the metre rule as shown in Fig. 1.2.
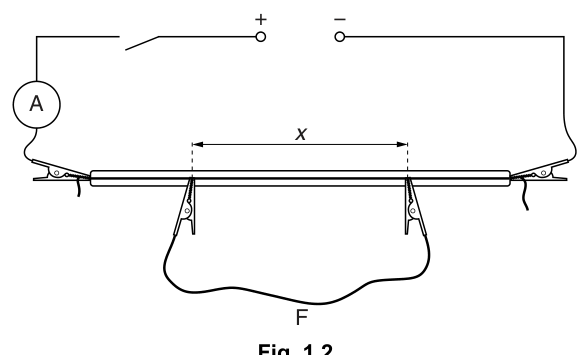
The distance between the crocodile clips should be approximately 50 cm.
Answer
Attach wire F as shown in Fig. 1.2 so that the distance between the two crocodile clips on the metre-rule wire is approximately
Wire F attached; x ≈ 50 cm
Background Concept
Crocodile clips make electrical contact at specific points on the wire. The separation between these contact points sets the length of wire involved and therefore affects the circuit resistance. Good practice is to start near the middle of the metre rule to allow movement in both directions for later readings.
Understanding the Question
You must connect wire F to two points on the wire on the metre rule, creating a separation (the variable you will later change). The initial should be about .
Approach
Use the metre rule to position the two clips so their contact points are about apart. Ensure both clips clamp firmly onto the same wire.
Step-by-Step Reasoning
- Identify the two connection points shown in Fig. 1.2.
- Clip one end of wire F to the metre-rule wire at a chosen position.
- Clip the other end of wire F to the metre-rule wire at a second position roughly away.
- Check that refers to the distance between the two contact points (not between ends of the clip bodies).
Key Takeaways
- is defined by the contact points of the clips.
- Start at to allow a good range of later values.
Common Mistakes
- Measuring between the wrong points on the crocodile clips.
- Placing clips too close to the ends of the wire, limiting the available range.
Things to Be Careful About
- Keep the switch open while repositioning clips to reduce heating.
- Ensure clips do not slip during readings (this changes unknowingly).
Measure and record .
= ______
Answer
Measure between the two crocodile-clip contact points on the metre-rule wire.
Example (typical):
x = 50.0 cm (example)
Background Concept
A length on a metre rule is best found from two position readings: . This avoids needing one clip exactly at zero and reduces systematic offset errors.
Understanding the Question
You must record , the distance between the two crocodile clips (contact points) on the metre-rule wire. This is your independent variable and will be changed for multiple readings.
Approach
Read the metre rule at each clip contact point, subtract to obtain , then record with unit and appropriate dp.
Step-by-Step Reasoning
- Read the position of the first clip contact point on the scale.
- Read the position of the second clip contact point.
- Compute as the difference.
- Record to the instrument resolution (e.g. ).
Key Takeaways
- Use two readings and subtraction.
- Record consistently each time (same reference points).
Common Mistakes
- Measuring from the wrong part of the clip.
- Mixing units (e.g. in cm but later using in m).
Things to Be Careful About
- Avoid parallax and ensure the wire is straight along the metre rule.
Close the switch.
Answer
Switch closed (briefly) to allow current to flow and the ammeter reading to be taken.
Switch closed
Background Concept
Closing the switch completes the circuit so current flows. For experimental reliability, current should only flow while taking readings to minimise heating of the wire (which would change its resistance).
Understanding the Question
This step is required before you can record the ammeter reading .
Approach
Close the switch, wait for the reading to settle, then record in the next step.
Step-by-Step Reasoning
- Close the switch to complete the circuit.
- Observe the ammeter and allow any brief fluctuation to settle.
Key Takeaways
- Switch closed only when measuring helps keep resistance approximately constant.
Common Mistakes
- Leaving the switch closed for a long time, causing heating and drifting readings.
Things to Be Careful About
- If the ammeter reading is off-scale, open the switch immediately and change range.
Record the ammeter reading .
= ______
Answer
Record the current from the ammeter.
Example (typical for ):
I = 0.57 A (example)
Background Concept
Current is measured in amperes (A). Digital meters typically display to a fixed resolution; analogue meters require careful interpolation and viewing to avoid parallax.
Understanding the Question
With the circuit closed, you must read and write down the ammeter value for the current value of .
Approach
Choose an ammeter range that gives a clear reading without overload, then record once steady.
Step-by-Step Reasoning
- Confirm the ammeter is in series.
- Ensure the range is not exceeded.
- Read the displayed value when stable.
- Record with unit and consistent dp across the table (e.g. ).
Key Takeaways
- Correct range selection and stable reading improve data quality.
Common Mistakes
- Forgetting the unit A.
- Recording different decimal places for different readings without reason.
Things to Be Careful About
- Heating can cause to drift: record promptly after closing the switch.
Open the switch.
Answer
Switch opened after the reading is taken.
Switch opened
Background Concept
When current flows through a wire, it heats up. The resistance of metal wire increases with temperature, which would affect the relationship being investigated. Opening the switch reduces heating and keeps conditions more constant.
Understanding the Question
You are instructed to open the switch after recording .
Approach
Open the switch immediately after each measurement, especially before moving crocodile clips.
Step-by-Step Reasoning
- After recording , open the switch to break the circuit.
- Allow the wire to cool briefly if it has warmed.
Key Takeaways
- Minimising heating helps produce more consistent data.
Common Mistakes
- Leaving the circuit closed while adjusting .
Things to Be Careful About
- If readings were taken too slowly, later readings may be affected by accumulated heating.
Change and repeat (c)(ii) and (d) until you have six sets of readings of and .
Include values of and in your table.
Answer
Take six different values of (wide range) and record each time. Include calculated columns for and .
Example table (with ):
See table (example values shown)
Background Concept
Good experimental data needs:
- enough readings (here six sets) to establish a trend;
- a wide range of the independent variable (here );
- clear presentation in a single table with headings and units;
- calculated quantities written with sensible significant figures.
The question asks you to calculate two derived quantities:
- (this has units of length, since it is length/length),
- (units ).
Understanding the Question
You must vary , and for each measure the current . You then compute and record the two extra columns. The aim is to prepare data suitable for plotting a straight-line graph later.
Approach
- Choose six values spanning as much of the metre-rule wire as practical.
- For each : close switch briefly, record , open switch.
- In the same table, calculate using the measured and the measured constant .
- Calculate .
Step-by-Step Reasoning
- Decide a sequence like (any sensible spread is fine).
- For each row:
- measure from the metre rule;
- measure on the ammeter;
- compute
- compute
- Presentation rules that typically earn marks:
- one table only (not separate tables);
- headings include quantity and unit (e.g. , not just “x”);
- consistent dp in each column: e.g. all to , all to .
Key Takeaways
- Collect a range of data, not clustered values.
- Derived columns must be calculated from your measurements and presented clearly.
Common Mistakes
- Fewer than six sets of readings.
- Missing units or unclear headings.
- Inconsistent rounding (e.g. some values to 1 dp and others to 0 dp).
- Forgetting to open the switch between readings, causing heating drift.
Things to Be Careful About
- Keep and in the same units when calculating .
- If is small, becomes large; avoid rounding too coarsely or becomes inaccurate.
- If readings fluctuate, repeat and take a mean (and note it).
Plot a graph of on the -axis against on the -axis.
Answer
Plot on the -axis (unit ) against on the -axis (unit of length, e.g. if and are in ).
Use a suitable scale (at least half the grid in each direction) and plot all six points.
Graph of 1/I (y) against x^2/(x+L) (x) plotted
Background Concept
Graphing experimental data is a way to test for relationships and determine constants. Marks are typically awarded for:
- correct axes (dependent variable on -axis, independent on -axis);
- correct labels with units;
- sensible scale (not cramped; not awkward like 3 squares = 1 unit);
- accurate plotting.
Understanding the Question
You must produce a graph with:
- ,
- ,
using the table from part (e).
Approach
From each row of the table, take the pair and plot it. Ensure axes are labelled with both symbols and units.
Step-by-Step Reasoning
- Draw axes and choose a scale that spreads the data across the paper.
- Label axes clearly:
- vertical: ,
- horizontal: (or if you used metres).
- Plot each point carefully using small crosses.
- Check for obvious plotting errors by verifying the trend is roughly linear.
Key Takeaways
- Axes must include units.
- Scale choice matters for accuracy of gradient/intercept.
Common Mistakes
- Plotting instead of .
- Forgetting units on axes.
- Using a scale that only occupies a small part of the grid.
Things to Be Careful About
- If you used and in cm in the table, keep that for the graph x-axis (do not silently switch to metres without converting all values).
Draw the straight line of best fit.
Answer
Draw a single straight line of best fit through the plotted points with roughly equal scatter on either side of the line.
Straight line of best fit drawn
Background Concept
A best-fit line represents the overall trend of data with random uncertainties. It should not be drawn by joining dots. For approximately linear data, a straight line is used.
Understanding the Question
After plotting the points, you must draw the best straight line that represents the relationship between and .
Approach
Use a ruler to draw a straight line that leaves roughly the same number of points above as below (balanced scatter). The line should pass close to as many points as possible.
Step-by-Step Reasoning
- Visually judge the trend.
- Place the ruler so the line runs centrally through the cluster.
- Draw a thin, continuous straight line across the full data range.
Key Takeaways
- Best-fit line is about the overall trend, not perfect agreement with every point.
Common Mistakes
- Joining points with segments.
- Forcing the line through the origin without evidence.
Things to Be Careful About
- Do not let one outlier dominate the line position unless you have reason to reject it.
Determine the gradient and -intercept of this line.
gradient = ______
-intercept = ______
Working
Use two well-separated points on the best-fit line.
Example:
Read off the intercept at :
Answer
gradient
-intercept
gradient = −3.0×10^−2 A^−1 cm^−1, y-intercept = 2.50 A^−1 (example)
Background Concept
For a straight-line graph, the gradient and intercept come from
Gradient is calculated from two points on the best-fit line (not necessarily measured points):
The -intercept is the value of when (where the line crosses the -axis).
Understanding the Question
You have plotted against . You now need the numerical gradient and the -intercept of your best-fit line, including units.
Approach
- Pick two points far apart on the drawn best-fit line to reduce percentage uncertainty.
- Compute and , then take .
- Read the intercept directly where the line crosses the -axis.
Step-by-Step Reasoning
- Choose two points on the line, preferably near the ends of the plotted range.
- Read their coordinates carefully using the graph scale.
- Calculate:
- Determine the -intercept by extending the line to meet the -axis and reading the value.
- Units:
- has units ,
- has units of length (e.g. ),
so gradient has units (or if -axis is in metres).
Key Takeaways
- Use a large triangle for gradient.
- Always include units for gradient and intercept.
Common Mistakes
- Using two adjacent points (large uncertainty in gradient).
- Calculating instead of .
- Using coordinates of plotted points instead of points on the best-fit line.
Things to Be Careful About
- Ensure you read from the line, not from the scatter.
- Be consistent: if the x-axis is in cm, the gradient unit must include .
The quantities , and are related by the equation
where and are constants.
Using your answers in (f)(iii), determine values for and .
Give appropriate units.
= ______
= ______
Working
Given
Comparing with for the graph of against :
So
Answer
P = 3.0×10^−2 A^−1 cm^−1, Q = 2.50 A^−1 (example)
Background Concept
If you plot a graph of against and the relationship is linear, it can be written as
where:
- is the gradient,
- is the -intercept.
Here, the equation is already in a linear form when you choose
Understanding the Question
You are given:
and you have found the gradient and intercept from part (f)(iii). You must use these to determine and and include appropriate units.
Approach
Compare the experimental straight-line form to .
- The coefficient of the plotted variable is the gradient.
- The constant term is the intercept.
Then use the sign carefully: gradient corresponds to .
Step-by-Step Reasoning
Write the given relation in terms of the plotted variables:
So
- gradient ,
- intercept .
Units:
- has units ,
- has units of length (e.g. cm),
so
Key Takeaways
- Matching to is the quickest way to extract constants.
- Units come from the axes of the graph.
Common Mistakes
- Taking equal to the gradient instead of the negative of it.
- Giving the wrong unit (it must match ).
Things to Be Careful About
- If you plotted in metres instead of cm, the numerical value of changes by a factor of and the unit must be .
The rest of this paper
1 more questions- Q2Manipulation, Measurement and Observation · Analysis, Conclusions and Evaluation · Presentation of Data and Observations20M