Physics 9702/36 — October/November 2013
Cambridge AS Level · Advanced Practical Skills · worked solutions for every part, with the mark scheme
Topics Manipulation, Measurement and Observation · Presentation of Data and Observations · Analysis, Conclusions and Evaluation
In this experiment, you will investigate the potential difference between two points in a circuit.
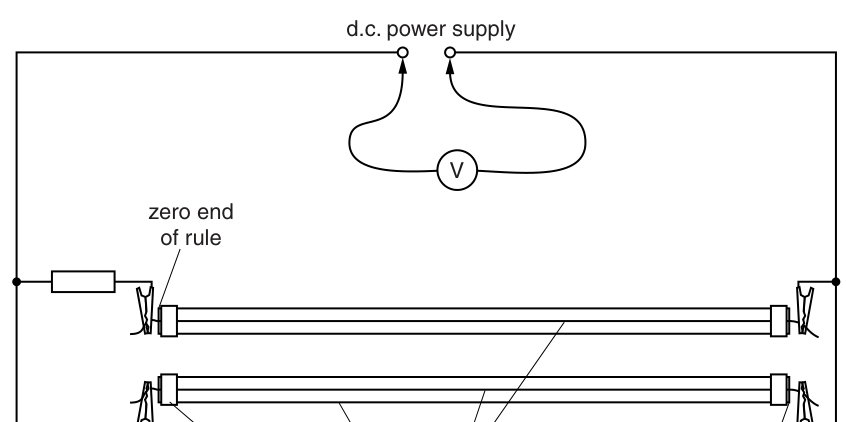
Assemble the circuit of Fig. 1.1.
Answer
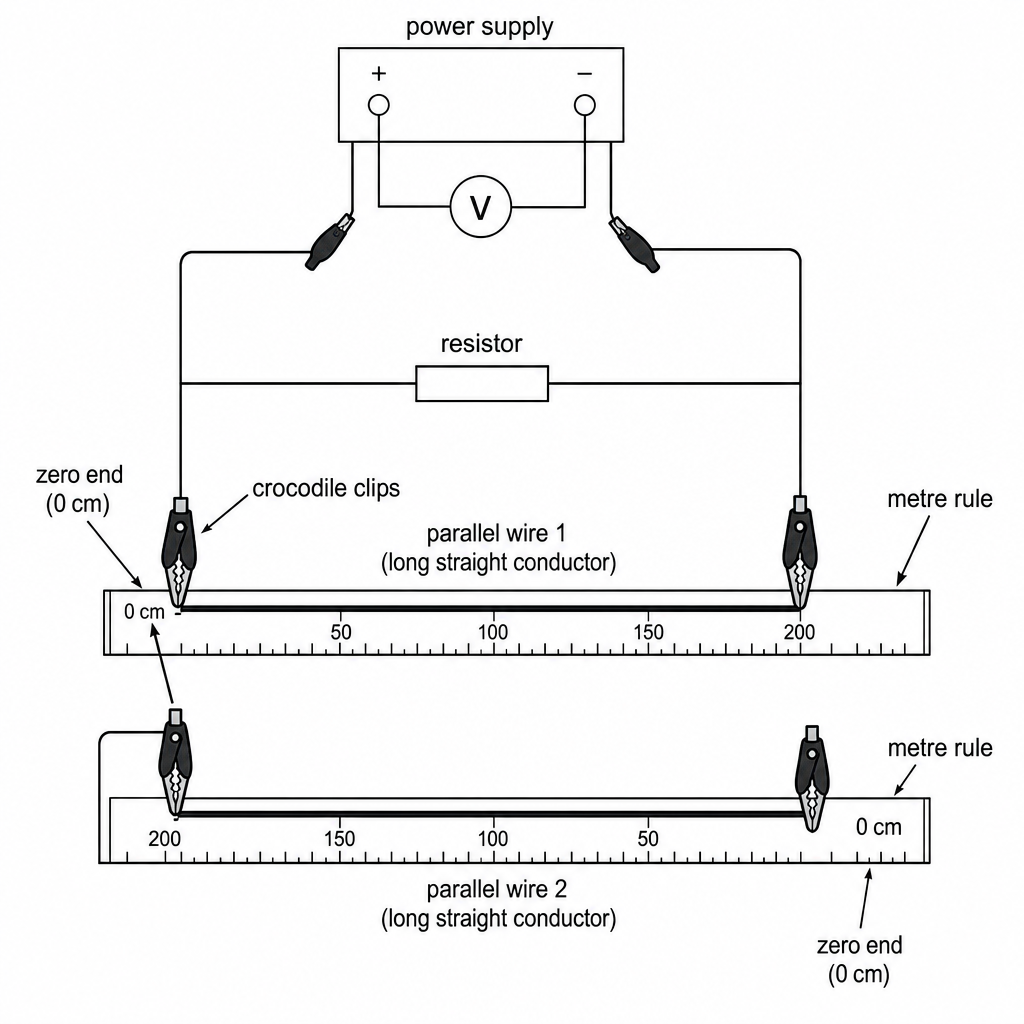
Circuit assembled as in Fig. 1.1 with secure connections: d.c. supply connected to the resistor and the two parallel wires (on metre rules) using crocodile clips, and with the voltmeter available for connection in parallel across the required two points.
Circuit assembled (see diagram/description).
Background Concept
In circuit practical work, the key ideas are:
- Potential difference (p.d.) is measured between two points and must be measured with a voltmeter connected in parallel with those two points.
- Good experimental results require correct circuit assembly, secure electrical contact, and correct placement of measuring instruments.
Understanding the Question
You are given a circuit diagram (Fig. 1.1) showing a d.c. supply, a resistor, and two parallel wires mounted along metre rules. Crocodile clips make electrical contact to the wires. You must build exactly this arrangement so that later parts (measuring , then measuring at different positions ) are possible.
Approach
- Identify the main series loop (supply, resistor, wire path).
- Identify where the voltmeter will be connected (always across two points, not in series).
- Assemble with secure connections and ensure the metre rules are oriented so the zero ends are opposite as shown.
Step-by-Step Reasoning
- Connect the d.c. supply terminals to the circuit as shown.
- Ensure the resistor is in the correct part of the circuit (as in the diagram).
- Connect each wire (mounted on a metre rule) into the circuit using crocodile clips so that the current passes through the intended wire sections.
- Check the metre rule orientation: the top wire’s zero end and the bottom wire’s zero end are at opposite ends (this matters because later is measured from each wire’s own zero end).
- Keep the voltmeter ready to be placed across either the power supply or across two points on the wires in later steps.
Key Takeaways
- Voltmeters measure p.d. and must be connected in parallel.
- Correct physical layout (including which end is the “zero” on each rule) is essential for meaningful position measurements.
Common Mistakes
- Connecting the voltmeter in series (gives incorrect readings and can affect the circuit).
- Using loose crocodile clips (intermittent contact causes fluctuating readings).
- Mixing up the zero ends of the metre rules (makes inconsistent).
Things to Be Careful About
- Confirm the voltmeter is on the correct d.c. voltage range before connecting.
- Avoid short circuits when moving clips.
- Ensure the wires are not touching each other electrically unless intended.
Connect the voltmeter across the power supply.
Record the voltmeter reading .
= ______
Answer
Voltmeter connected across the power supply.
Example reading (to appropriate resolution):
E = 2.00 V
Background Concept
The electromotive force (e.m.f.)/supply potential difference is measured using a voltmeter connected across the two terminals of the supply.
- A voltmeter has a high resistance and is designed to be connected in parallel.
- The reading should be recorded to the instrument’s resolution (e.g. 0.01 V for a digital meter on a 2 V/20 V range, or to the smallest division for an analogue meter).
Understanding the Question
You are asked to connect the voltmeter across the power supply and record the reading . This value will later be used to compute the ratio .
Approach
- Put the voltmeter on a suitable d.c. voltage range.
- Connect it directly across the supply terminals (parallel connection).
- Wait for a steady reading and record with unit and appropriate decimal places.
Step-by-Step Reasoning
- Ensure the voltmeter is set to measure d.c. voltage.
- Choose a range that prevents over-ranging but gives good resolution.
- Connect the red lead to the positive terminal and the black lead to the negative terminal.
- Read the value and record it as in volts.
Key Takeaways
- Voltmeters are connected in parallel.
- Record values with sensible precision and include units.
Common Mistakes
- Connecting the voltmeter in series.
- Using the wrong meter setting (a.c. instead of d.c., or wrong range).
- Omitting the unit or recording too many/few decimal places.
Things to Be Careful About
- If the reading fluctuates, check for loose connections.
- If the meter shows a negative sign, the leads are reversed; swap them for a positive reading of .
Disconnect the voltmeter from the power supply.
Answer
Disconnect the voltmeter leads from the power supply terminals.
Voltmeter disconnected from the power supply.
Background Concept
In multi-step circuit experiments, the same voltmeter is moved to measure different potential differences. The voltmeter must only be connected where you intend to measure, otherwise it may:
- give the wrong measurement for the next step, or
- unintentionally provide an additional current path.
Understanding the Question
After measuring across the supply, you must remove the voltmeter from the supply because the next measurements require the voltmeter to be connected to the wires at positions .
Approach
Carefully remove the voltmeter connections from the supply terminals while leaving the rest of the circuit intact.
Step-by-Step Reasoning
- Remove one voltmeter lead from the supply terminal.
- Remove the second lead.
- Keep the supply and other circuit connections unchanged.
Key Takeaways
- Always connect the voltmeter across the two points of interest only.
Common Mistakes
- Leaving one voltmeter lead attached to the supply while moving the other lead elsewhere (this changes what p.d. is being measured).
Things to Be Careful About
- Avoid shorting the supply terminals with meter leads or crocodile clips while disconnecting.
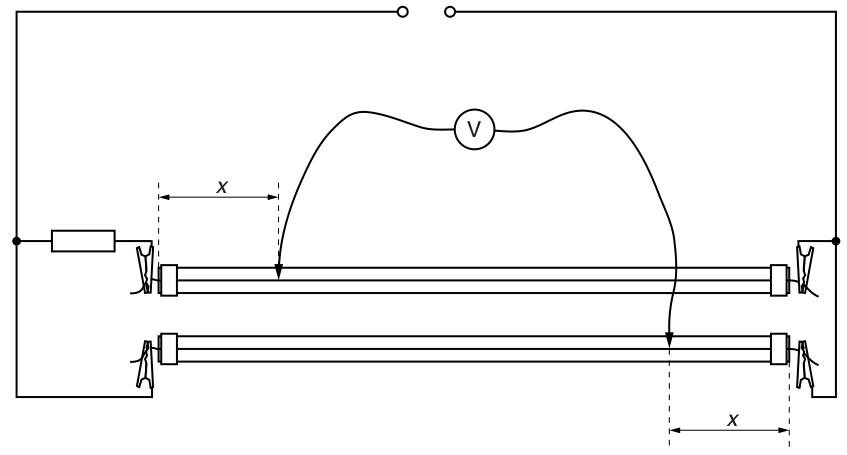
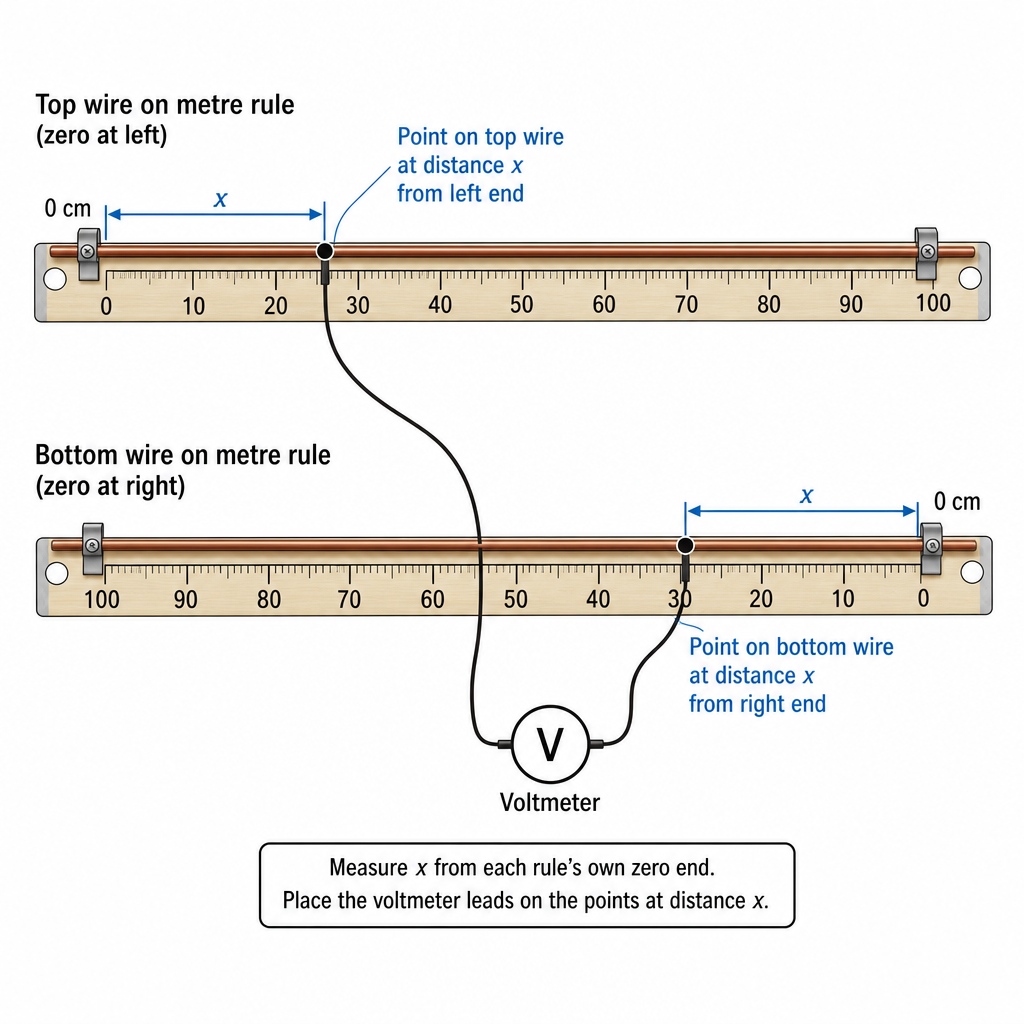
Position the voltmeter leads on the wires at distance from the zero ends of both rules as shown in Fig. 1.2, where is approximately 20 cm.
Answer
Place the two voltmeter contacts on the wires so that each contact is at a distance from the zero end of its own rule (with the zeros at opposite ends as shown).
Voltmeter contacts positioned at x ≈ 20 cm from each rule’s zero end.
Background Concept
A potential difference can be measured between any two points in a circuit by connecting a voltmeter between those points. In this experiment, the points are chosen by placing contacts on two wires.
Because each wire is mounted on a separate metre rule whose zero ends are at opposite ends, “distance from the zero end” means:
- measure from the left on one rule, but
- measure from the right on the other rule (if its zero is at the right).
Understanding the Question
You must put the voltmeter leads onto the two wires at positions that correspond to the same distance from each wire’s zero end, with about . Fig. 1.2 shows the intended geometry.
Approach
- Identify the zero end on each metre rule.
- Use the scale to locate from each zero end.
- Place the voltmeter lead contacts exactly at those positions.
Step-by-Step Reasoning
- Look for the “0 cm” marking on each metre rule; note they are at opposite ends.
- On the first rule, measure from its 0 end and place the contact.
- On the second rule, measure from its 0 end (which is at the opposite end) and place the other contact.
- Ensure the contacts press firmly onto the wire (poor contact causes unstable voltmeter readings).
Key Takeaways
- Position measurements depend on the defined zero; when zeros are opposite, you must measure from different physical ends.
Common Mistakes
- Measuring from the same physical end on both rules even though the zero ends are opposite.
- Touching the contact to tape/insulation rather than the conducting wire.
Things to Be Careful About
- Read the metre rule at eye level to reduce parallax (especially for analogue scales).
- Keep the contacts perpendicular and consistent to avoid changing contact resistance.
Record and record the voltmeter reading .
Include the sign (+ or ) of .
= ______
= ______
Answer
Example (appropriate precision):
x = 20.0 cm, V = +0.40 V
Background Concept
- is a position measured along each metre rule from its zero end.
- is the potential difference between the two chosen points; voltmeters display a sign depending on which lead is at the higher potential.
If the voltmeter shows a negative reading, it means the voltmeter’s “positive” terminal is at a lower potential than the “negative” terminal for that connection.
Understanding the Question
You must record:
- the value of used (around 20 cm for this first set), and
- the voltmeter reading , including whether it is or .
Approach
- Read from the metre rule scale (to the nearest mm or 0.1 cm, depending on how you record).
- Read the voltmeter value and keep the sign.
- Record both with units.
Step-by-Step Reasoning
- Use the rule markings to determine from the appropriate zero end.
- Record with consistent precision (e.g. if using 0.1 cm resolution).
- Observe the voltmeter display:
- if it shows a minus sign, record as negative.
- otherwise record it as positive.
- Include units: in cm (or m) and in volts.
Key Takeaways
- The sign of contains information about which point is at higher potential.
- Consistent precision helps later processing and graph plotting.
Common Mistakes
- Omitting the sign of .
- Writing without units.
- Recording to inconsistent decimal places across repeated readings.
Things to Be Careful About
- Ensure contacts are on the metal wire, not the tape.
- Let the voltmeter reading settle before recording.
By moving both contacts, change until the voltmeter reads zero.
Record .
= ______
Answer
Move both contacts together until the voltmeter reads .
Example recorded value:
x = 50.0 cm (at V = 0)
Background Concept
A null method is used when you adjust a variable until a measured quantity becomes zero. It is often accurate because you are looking for a zero reading rather than estimating a non-zero value.
Here, you adjust until the p.d. between the two contact points is zero, meaning both points are at the same potential.
Understanding the Question
You must slide both voltmeter contacts to new positions (keeping them at the same distance from each wire’s zero end) until the voltmeter reads zero, then record the corresponding .
Approach
- Move the contacts in small steps.
- Watch the voltmeter reading change sign (if it does).
- Find the position where the reading is as close to as possible.
- Record .
Step-by-Step Reasoning
- Start from the initial and move both contacts by the same amount.
- If is positive, move in the direction that reduces the magnitude; if it becomes negative, you have passed the balance point.
- Narrow down by smaller adjustments around the point where changes sign.
- Record at the best null you can achieve.
Key Takeaways
- Adjusting for can give a well-defined reference point for the later graph.
Common Mistakes
- Moving only one contact (then the two points no longer correspond to the same definition).
- Recording when is small but not actually zero (when a better null is achievable).
Things to Be Careful About
- Contact resistance can cause unstable readings; keep the contact pressure consistent.
- Record to a precision consistent with the metre rule scale.
Repeat (c)(i) and (c)(ii) with different values of until you have six sets of values of and .
Include values of in your table.
Answer
Record six sets of and signed values and calculate for each.
Example of a suitable single table (headings include units):
(using example ; calculated for each row).
Six sets of x and V recorded with a V/E column (see table).
Background Concept
In Paper 3, marks for tables are usually awarded for:
- Sufficient number of readings (here: six sets)
- Appropriate range of the independent variable ()
- Clear, single table with correct headings and units
- Consistent precision within a column
- Correct calculation of any derived quantity (here , which is dimensionless)
Understanding the Question
You must repeat the measurement of at different positions until you have six pairs . You must also include the calculated ratio for each set.
The independent variable is and the dependent variable is (and then ).
Approach
- Choose at least six values of spanning a sensible range (not all clustered together).
- For each , measure (including sign).
- Compute using the previously measured :
- Present all data in one clear table with headings and units.
Step-by-Step Reasoning
- Select values of (e.g. in steps of 10 cm) and include values on both sides of the balance point where if possible.
- For each :
- Place both contacts at that from their respective zero ends.
- Read and record including sign.
- Calculate for each row:
- Example: if and then
- Ensure the derived column has a consistent number of decimal places or significant figures.
Key Takeaways
- A good table is about communication: clear headings, units, consistent precision.
- Derived quantities must be calculated correctly for every row.
Common Mistakes
- Not collecting six complete pairs of .
- Leaving out the sign of .
- Missing units in headings (e.g. writing just instead of ).
- Calculating instead of .
Things to Be Careful About
- is dimensionless: do not add a unit to that column.
- Use the same value consistently for all calculations.
- Avoid mixing units (cm in one row, m in another).
Plot a graph of on the -axis against on the -axis.
Answer
Plot (dimensionless) on the -axis against on the -axis.
- Label axes: (or ) and .
- Use a sensible scale (at least half the grid in each direction).
- Plot all six points accurately.
Graph of V/E (y) against x (x) plotted with correct labels and scales.
Background Concept
Graph marks typically come from:
- Correct choice of variables for axes
- Correct axis labels (quantity and unit)
- Sensible scales (not cramped; not awkward like 3, 6, 9 per big square)
- Accurate plotting (small, neat points)
Here, is a ratio of voltages, so it is dimensionless.
Understanding the Question
You must plot a graph with:
- horizontal axis:
- vertical axis:
using the six data sets from your table.
Approach
- Decide whether you will use in cm or m (either is acceptable as long as you are consistent).
- Choose axis limits that comfortably include all your data.
- Choose scales that use most of the graph paper.
- Plot each point carefully.
Step-by-Step Reasoning
- Put on the horizontal axis and label it (or ).
- Put on the vertical axis and label it (no unit).
- Choose a scale so that the smallest and largest values of and are well spread.
- Plot points using fine crosses or small dots.
Key Takeaways
- Always label axes with quantity and unit (except dimensionless quantities).
- Good scales and accurate points are essential for reliable gradients/intercepts.
Common Mistakes
- Swapping axes (plotting on -axis).
- Writing an incorrect label such as .
- Using a poor scale that uses only a small part of the grid.
Things to Be Careful About
- If includes negative values, include negative y-values on the axis.
- Keep plotting precision consistent (use a ruler for reading coordinates).
Draw the straight line of best fit.
Answer
Draw a single straight line of best fit with an approximately equal distribution of points on either side (do not join dot-to-dot).
Straight line of best fit drawn.
Background Concept
A straight line of best fit represents the trend of experimental data when the relationship is expected to be linear. It should reflect overall trend, not pass through every point.
Understanding the Question
You have plotted against . You must now draw the best-fit straight line that represents the data trend.
Approach
Use a ruler to draw one straight line that:
- goes through the middle of the spread of points,
- has roughly equal numbers of points above and below,
- is not forced through an outlier.
Step-by-Step Reasoning
- Visually estimate the trend.
- Place the ruler to balance the scatter.
- Draw a single thin line across the full range of the data.
Key Takeaways
- Best fit is about the overall trend, not connecting points.
Common Mistakes
- Dot-to-dot joining.
- Forcing the line through the origin when not justified by data.
- Drawing a line that only spans a small section of the plotted range.
Things to Be Careful About
- If there is an obvious anomalous point, do not bend the line to include it; keep the best fit for the main cluster.
Determine the gradient and -intercept of this line.
gradient = ______
-intercept = ______
Working
Using two well-separated points on the best-fit line, e.g.
At ,
Answer
gradient
-intercept
gradient = −1.0×10^−2 cm^−1, y-intercept = 0.50
Background Concept
For a straight-line graph of against :
- is the gradient:
- is the y-intercept (value of when )
On a graph, the gradient should be found using a large triangle to reduce percentage reading error.
Understanding the Question
You have drawn a best-fit straight line on a graph of (y-axis) against (x-axis). You must now determine:
- the gradient of this line, and
- the y-intercept.
Approach
- Choose two points on the line (not necessarily plotted points) that are far apart.
- Read their coordinates accurately.
- Compute and , then calculate the gradient.
- Read the intercept where the line crosses the y-axis (), or extrapolate if necessary.
Step-by-Step Reasoning
- Select two widely separated points on the best-fit line.
- Calculate:
- Keep track of sign: if the line slopes downward as increases, the gradient is negative.
- Find the y-intercept by reading the line at .
Units:
- is dimensionless.
- If is in cm, gradient has units .
- If is in m, gradient has units .
Key Takeaways
- Use a large triangle for gradient.
- Intercept comes from .
- Units of gradient depend on the x-axis unit; intercept is dimensionless here.
Common Mistakes
- Using two plotted data points instead of points on the best-fit line (more affected by scatter).
- Calculating instead of .
- Forgetting the gradient’s unit.
Things to Be Careful About
- Read coordinates from the graph scale correctly.
- Do not round intermediate readings too aggressively before calculating the gradient.
The quantities , and are related by the equation
where and are constants.
Use your answers from (e)(iii) to determine the values of and .
Give appropriate units.
= ______
= ______
Working
Given
Comparing with for a graph of against :
Using (e)(iii):
Answer
a = −1.0×10^−2 cm^−1, b = 0.50
Background Concept
If an equation has the form
and you plot (vertical axis) against (horizontal axis), then:
- the gradient of the straight line is
- the y-intercept is
Here the relationship is
So we identify , , , and .
Understanding the Question
You already found the gradient and y-intercept from your graph in part (e)(iii). Now you must use these to state the constants and , and give the correct units.
Approach
- Match the equation to the straight-line form.
- Set equal to the gradient and equal to the y-intercept.
- Determine units:
- is dimensionless
- therefore is dimensionless
- must have units of (e.g. or depending on your graph)
Step-by-Step Reasoning
- From the plotted graph of against :
- gradient
- intercept
- Units:
- If you used in cm, then is in .
- If you used in m, then is in .
- has no unit.
Key Takeaways
- Constants in a linear relationship come directly from gradient and intercept.
- Always infer units from what is plotted.
Common Mistakes
- Giving a unit (it is dimensionless here).
- Using the reciprocal of the gradient.
- Quoting in when was plotted in cm (or vice versa) without conversion.
Things to Be Careful About
- State units exactly as implied by your axis label.
- Keep the sign of (negative gradient means negative ).
The rest of this paper
1 more questions- Q2Manipulation, Measurement and Observation · Presentation of Data and Observations · Analysis, Conclusions and Evaluation20M