Physics 9702/31 — October/November 2013
Cambridge AS Level · Advanced Practical Skills · worked solutions for every part, with the mark scheme
Topics Manipulation, Measurement and Observation · Presentation of Data and Observations · Analysis, Conclusions and Evaluation
In this experiment, you will determine the resistivity of a metal in the form of a wire.
Measure and record the diameter of the short sample of wire that is attached to the card. You may remove the wire from the card.
= ______
Answer
Measure diameter with a micrometer (check zero error) and take several readings along the wire; mean diameter (example):
d = 0.32 mm (example)
Background Concept
For a cylindrical wire, the diameter is typically very small (fractions of a millimetre), so a micrometer screw gauge is used rather than a ruler. A micrometer has a much smaller least count (often ), allowing more precise measurements.
Because a wire may not be perfectly uniform, measuring at several positions and averaging improves reliability (random errors reduce).
Understanding the Question
You are asked to measure and record the diameter of a short sample of wire. This value will later be used to calculate the cross-sectional area in , so the measurement must be careful and recorded with sensible precision.
Approach
- Use a micrometer to measure the wire diameter.
- Check for zero error and correct if necessary.
- Take repeat readings at different positions and average.
- Record to the micrometer resolution (typically ).
Step-by-Step Reasoning
- Close the micrometer gently to check if it reads . If not, note the zero error.
- Place the wire between the anvil and spindle.
- Tighten using the ratchet (so the contact force is consistent).
- Read the main scale and thimble scale; apply any zero correction.
- Repeat at several points along the wire (and/or rotate the wire) to reduce the effect of ovality.
- Calculate the mean and record it, e.g. .
Key Takeaways
- Small diameters require a micrometer for adequate precision.
- Repeats and averaging improve data quality.
- Record to the instrument resolution.
Common Mistakes
- Not checking/allowing for zero error.
- Overtightening without the ratchet, flattening the wire and giving a diameter that is too small.
- Taking only one reading on a possibly non-uniform wire.
- Recording too many decimal places (false precision) or too few (loss of precision).
Things to Be Careful About
- Keep units clear: micrometers commonly read in , but later calculations need in .
- Do not include insulation (if any) in the diameter measurement—measure the metal only.
Calculate the cross-sectional area of the wire, in , using the formula
= ______
Working
Convert to metres (example):
Answer
8.0 × 10^-8 m^2 (example)
Background Concept
For a circular cross-section, area is
If you measure diameter instead of radius, then and
Because resistivity calculations use SI units, must be in , so must be converted to metres before squaring.
Understanding the Question
You are given the formula
and asked to calculate in using your measured diameter .
Approach
- Convert into metres.
- Substitute into .
- Round to a sensible number of significant figures consistent with .
Step-by-Step Reasoning
Using an example measurement :
- Convert to metres:
- Substitute:
- Square the diameter:
- Multiply by :
Key Takeaways
- Always convert to metres before squaring.
- The area depends on , so small percentage errors in double in .
Common Mistakes
- Squaring while still in and then writing .
- Using (forgetting the factor ).
- Over-rounding early and losing accuracy.
Things to Be Careful About
- Keep track of powers of ten when squaring.
- Quote to an appropriate number of significant figures (usually matching the significant figures in ).
Use the wire attached to the metre rule, one of the voltmeters and one of the resistors to set up the partial circuit shown in Fig. 1.1.
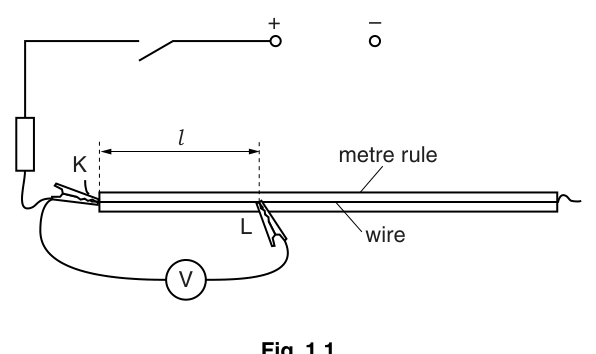
There are two crocodile clips, one labelled K and the other labelled L.
Place K and L so that the distance between them is approximately .
Answer
Set up the partial circuit as in Fig. 1.1: resistor in series with the supply and switch; connect the voltmeter in parallel across the wire between clips K and L. Place K and L so that along the metre rule.
Partial circuit set up with voltmeter across KL and l ≈ 0.30 m.
Background Concept
A potential divider arrangement can be created by having a long resistance wire in the circuit. A voltmeter must always be connected in parallel with the component/section whose potential difference is being measured.
Crocodile clips act as movable contacts that select a particular length of wire; changing the length changes that section's resistance.
Understanding the Question
You must build the circuit in Fig. 1.1 using the resistance wire on the metre rule, one resistor, and one voltmeter. You then place two crocodile clips (K and L) so the separation along the wire is about .
Approach
- Put the fixed resistor in series with the supply (so it limits current).
- Use K and L to define the wire section to be measured.
- Connect the voltmeter across K and L (parallel).
- Choose an initial length near to start your dataset.
Step-by-Step Reasoning
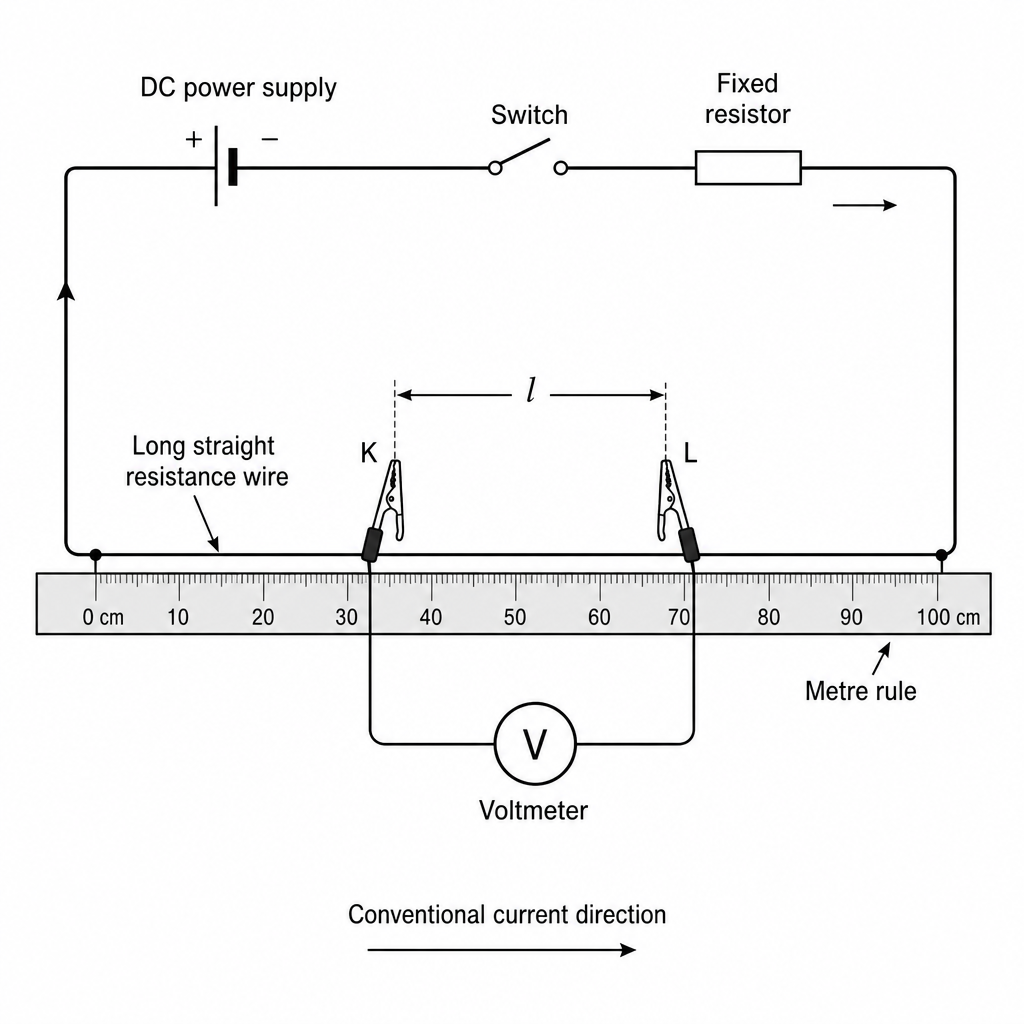
- Connect the power supply, switch, and resistor in series with the resistance wire.
- Attach crocodile clip K to one point on the wire.
- Attach crocodile clip L to a point about away (use the metre rule scale).
- Connect the voltmeter leads to K and L so it reads the p.d. across the length .
- Ensure the voltmeter is on an appropriate voltage range before switching on later.
Key Takeaways
- Voltmeter in parallel; resistor and wire in series.
- Clips define the length of wire under test.
Common Mistakes
- Putting the voltmeter in series (gives incorrect readings and may stop the circuit working properly).
- Measuring as a straight-line distance rather than along the metre rule scale.
- Poor contact at clips (intermittent readings).
Things to Be Careful About
- Place clips firmly and on clean wire to reduce contact resistance changes.
- Avoid very small (tiny voltages) and very large (wire heating, larger resistance causing large p.d. changes).
Measure and record the distance between K and L.
= ______
Answer
Measure the positions of K and L on the metre rule and subtract to find (example):
l = 0.300 m (example)
Background Concept
A metre rule is read by aligning the eye perpendicular to the scale to avoid parallax. The length between two points is found by taking two position readings and subtracting.
Understanding the Question
You must measure the separation between crocodile clips K and L along the wire and record it in metres.
Approach
- Read the metre-rule positions of K and L.
- Subtract to get .
- Convert to metres and record with suitable precision (typically to the nearest , i.e. ).
Step-by-Step Reasoning
- Suppose K is at and L is at .
- Then
Key Takeaways
- Use two readings and subtraction to reduce zero/endpoint errors.
- Record in metres for later graphing.
Common Mistakes
- Recording but writing unit .
- Measuring from the ends of the wire rather than between the clip contact points.
- Parallax error when reading the scale.
Things to Be Careful About
- Ensure both clip contact points correspond to the measured positions.
- Keep the same resolution for all readings in the table.
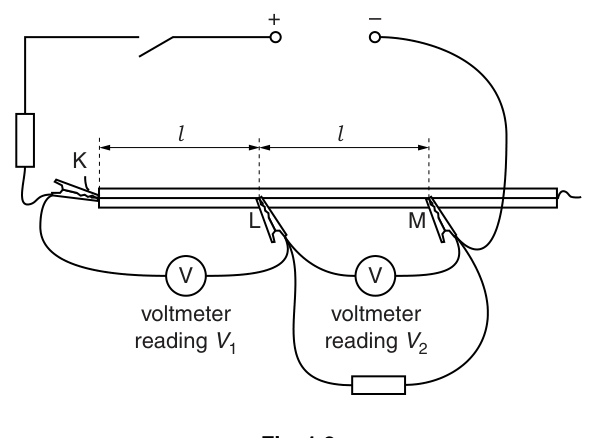
Use the other resistor and the other voltmeter to complete the circuit shown in Fig. 1.2.
Answer
Switch off the power supply.
Power supply switched off.
Background Concept
Resistive heating increases the temperature of the wire and can change its resistance, introducing systematic error. Switching off between readings limits heating and improves repeatability.
Understanding the Question
After recording and , you are instructed to switch off the supply.
Approach
Turn off the supply promptly after measurements.
Step-by-Step Reasoning
- Open the switch / turn off the power supply.
- Allow the wire to cool if it feels warm before moving clips for the next length.
Key Takeaways
- Minimising heating improves data quality.
- Good practice: power off when not actively measuring.
Common Mistakes
- Leaving the circuit powered while adjusting clips (sparks, heating, drifting readings).
Things to Be Careful About
- If the wire has noticeably warmed, wait for it to return to room temperature before the next reading.
Place the crocodile clip M at a distance from L.
The value of should be the same as in (b)(ii).
Answer
Position M so that the distance and is the same value as for (e.g. if , then set ).
Set LM = l (same as KL).
Background Concept
If two wire segments have equal length and uniform cross-sectional area, their resistances are proportional to length. Setting ensures you are comparing like with like; this is essential for the intended relationship between and .
Understanding the Question
You must place crocodile clip M so that the length from L to M is exactly the same as the measured length from K to L.
Approach
- Use metre-rule position readings: if L is at position , then place M at (in the same units).
Step-by-Step Reasoning
- If you measured , then .
- If L is at , place M at .
- Re-check by subtracting positions.
Key Takeaways
- Equal lengths are vital for the ratio method.
- Use position subtraction rather than trying to measure between clip bodies.
Common Mistakes
- Setting M approximately rather than carefully matching .
- Measuring from K to M instead of from L to M.
Things to Be Careful About
- Ensure M is placed along the wire in the same direction from L (do not accidentally place it on the other side of L).
Switch on the power supply.
Answer
Switch on the power supply (after checking connections and meter ranges).
Power supply switched on.
Background Concept
When current flows through a resistance wire, it can heat up. Heating changes the wire’s resistance and can affect voltage readings, so the circuit should be powered only when ready to take readings, and readings should be taken promptly.
Understanding the Question
This step instructs you to switch on the supply so that the voltmeters show and .
Approach
- Before switching on: confirm correct wiring and appropriate voltmeter range.
- Switch on briefly to take readings.
Step-by-Step Reasoning
- Ensure both voltmeters are connected in parallel to the correct segments.
- Set voltmeters to a range that will not overload.
- Close the switch and allow readings to stabilise.
Key Takeaways
- Good practical work includes checking before energising a circuit.
- Minimise heating effects by not leaving the current on unnecessarily.
Common Mistakes
- Leaving the power on for long periods, causing drift in readings.
- Switching on with incorrect meter settings (over-range).
Things to Be Careful About
- If the wire warms, allow it to cool before repeating measurements for consistency.
Record the voltmeter readings and as shown in Fig. 1.2.
= ______
= ______
Answer
Record voltmeter readings (example):
V1 = 0.44 V, V2 = 0.40 V (example)
Background Concept
Voltmeters measure potential difference and should have high resistance, so they do not significantly change the circuit. Readings should be recorded consistently (same decimal places) to reflect instrument resolution.
Understanding the Question
With the circuit connected as in Fig. 1.2, voltmeter 1 gives across K–L and voltmeter 2 gives across L–M. You must write both values down with units.
Approach
- Wait for the readings to settle.
- Read and record each voltmeter value with the correct unit (V) and appropriate resolution.
Step-by-Step Reasoning
- Observe voltmeter 1 across K–L and record .
- Observe voltmeter 2 across L–M and record .
- Example set: and .
Key Takeaways
- Record units and consistent decimal places.
- Take readings quickly to reduce heating drift.
Common Mistakes
- Swapping and .
- Missing units.
- Inconsistent decimal places between readings.
Things to Be Careful About
- If readings fluctuate, check clip contacts and ensure the wire is not moving.
Switch off the power supply.
Answer
Switch off the power supply.
Power supply switched off.
Background Concept
Resistive heating increases the temperature of the wire and can change its resistance, introducing systematic error. Switching off between readings limits heating and improves repeatability.
Understanding the Question
After recording and , you are instructed to switch off the supply.
Approach
Turn off the supply promptly after measurements.
Step-by-Step Reasoning
- Open the switch / turn off the power supply.
- Allow the wire to cool if it feels warm before moving clips for the next length.
Key Takeaways
- Minimising heating improves data quality.
- Good practice: power off when not actively measuring.
Common Mistakes
- Leaving the circuit powered while adjusting clips (sparks, heating, drifting readings).
Things to Be Careful About
- If the wire has noticeably warmed, wait for it to return to room temperature before the next reading.
Change and repeat (b)(ii), (b)(iv) and (c) until you have six sets of readings of , and . For each set of readings, distances KL and LM should both be .
Include values of in your table.
Answer
Obtain six sets of readings with each time, and tabulate , , and in one table (example shown).
| / | / | / | |
|---|---|---|---|
| 0.100 | 0.28 | 0.40 | 0.700 |
| 0.150 | 0.32 | 0.40 | 0.800 |
| 0.200 | 0.36 | 0.40 | 0.900 |
| 0.300 | 0.44 | 0.40 | 1.10 |
| 0.400 | 0.52 | 0.40 | 1.30 |
| 0.500 | 0.60 | 0.40 | 1.50 |
Table of six readings of l, V1, V2 and V1/V2 (example shown).
Background Concept
In Paper 3, marks for a results table typically come from good experimental design and presentation:
- enough readings (here six sets)
- a sensible range and spread of the independent variable (here )
- clear headings with quantities and units
- consistent precision within each column
- correctly calculated derived quantities (here )
Understanding the Question
You must change and repeat the measurement procedure until you have six sets of , and , ensuring both lengths and are equal to each time. You must also include in your table.
Approach
- Choose six values of that cover a wide range (not clustered).
- For each , set and .
- Switch on, read and , switch off.
- Calculate and record in the same row.
Step-by-Step Reasoning
- Pick values such as to in steps that give a spread of points.
- Record typically to (metre rule to nearest mm).
- Record voltages to the voltmeter resolution (often ).
- For each row compute
For example, if and then
Key Takeaways
- A single clear table with units is essential.
- Derived quantities must be calculated correctly and recorded consistently.
- A good range of improves the quality of the graph and gradient.
Common Mistakes
- Missing units in headings (e.g. writing without ).
- Using inconsistent decimal places (suggests poor measurement technique).
- Forgetting to include .
- Not keeping and equal to the same .
Things to Be Careful About
- Do not round too aggressively; keep 3 s.f. (or consistent dp) so the graph is not degraded.
- If the wire heats, readings may drift; take readings quickly and switch off between sets.
Plot a graph of on the -axis against on the -axis.
Answer
Plot on the -axis against on the -axis.
- Axes labels: and (no unit).
- Use a sensible scale occupying at least half the grid in each direction.
- Plot all six points accurately.
Graph of V1/V2 (y) against l (x) plotted.
Background Concept
A good graph makes it easy to see the relationship between two variables and to determine the gradient and intercept. In Cambridge practical papers, marks are awarded for:
- correct choice of axes
- correct labels (quantity and unit)
- sensible scales (not cramped, not awkward)
- accurate plotting
Understanding the Question
You must produce a graph with and . This is designed to test the linear relationship
Approach
- Put the independent variable on the horizontal axis.
- Put the dependent variable on the vertical axis.
- Select scales so your points fill the graph area.
Step-by-Step Reasoning
- Decide the range of values from your table and set the -axis scale accordingly.
- Decide the range of values and set the -axis scale accordingly.
- Label axes clearly: and .
- Plot each point as a small cross; ensure points are not thick blobs.
Key Takeaways
- Correct axes and scales are as important as the plotted points.
- is dimensionless, so no unit on the -axis.
Common Mistakes
- Swapping axes (plotting on ).
- Forgetting units on the -axis.
- Using a scale that wastes most of the grid.
Things to Be Careful About
- Keep plotting accuracy high: use a ruler to read coordinates, and plot neat crosses.
- If two points are close, ensure they are still distinguishable.
Draw the straight line of best fit.
Answer
Draw a single straight line of best fit through the plotted points (do not join point-to-point).
Straight line of best fit drawn.
Background Concept
A best-fit line represents the overall trend of the data. For a linear relationship, it should be a straight line that balances the scatter: roughly equal numbers of points above and below the line.
Understanding the Question
After plotting against , you must draw the straight line of best fit.
Approach
Use a ruler and draw one thin straight line that best represents the trend.
Step-by-Step Reasoning
- Visually judge the trend.
- Place the ruler so the line passes through the middle of the data scatter.
- Draw a thin straight line across the full span of the plotted data (not just between two points).
Key Takeaways
- Best-fit means balancing scatter, not forcing the line through every point.
Common Mistakes
- Joining dots with a zig-zag line.
- Forcing the line through the origin when the data do not support it.
Things to Be Careful About
- Use a sharp pencil and ruler so the line thickness does not introduce reading error for gradient/intercept.
Determine the gradient and -intercept of this line.
gradient = ______
-intercept = ______
Working
Using two well-separated points on the best-fit line (example):
-intercept (at ) from the line (example): .
Answer
gradient
-intercept
gradient = 2.0 m^-1, y-intercept = 0.50 (example)
Background Concept
For a straight-line graph of the form
- the gradient is
- the -intercept is the value of when .
Here (dimensionless) and (in m), so the gradient must have units .
Understanding the Question
You must find the gradient and the -intercept of your best-fit line on the graph of against .
Approach
- Choose two points far apart on the best-fit line (not necessarily data points).
- Calculate gradient using .
- Read the intercept by extending the line to .
Step-by-Step Reasoning
- Select two convenient points on the line, e.g. and .
- Compute changes:
- Gradient:
- Intercept: extend the line back to and read there, giving (example) .
Key Takeaways
- Use a large triangle to reduce percentage uncertainty in the gradient.
- Gradient units come from units divided by units.
Common Mistakes
- Using instead of .
- Using two nearby points, causing a large gradient uncertainty.
- Reading the intercept from a data point rather than from the best-fit line.
Things to Be Careful About
- Read from the line, not from plotted crosses.
- Keep enough significant figures in gradient and intercept consistent with graph-reading precision.
The quantities , and are related by the equation
where and are constants.
Use your answers in (e)(iii) to determine values for and .
= ______
= ______
Answer
From
is the gradient and is the -intercept.
(example) , .
P = gradient, Q = y-intercept (e.g. P = 2.0 m^-1, Q = 0.50).
Background Concept
Any straight-line graph follows
Comparing with
we identify:
Since is dimensionless, must have units of so that is dimensionless.
Understanding the Question
You have already obtained the gradient and intercept from the graph in part (e)(iii). You now convert those into the constants and .
Approach
- Set gradient.
- Set -intercept.
Step-by-Step Reasoning
If (example) your graph gave:
- gradient
- intercept
Then
Key Takeaways
- Comparing equations is a fast way to identify constants.
- Check units to confirm you have matched correctly.
Common Mistakes
- Swapping and .
- Giving a unit (it is dimensionless here).
Things to Be Careful About
- Ensure the gradient unit is written as because the -axis was in metres.
The resistivity of the material of the wire, in , can be found using the relationship
where .
Use your answers in (a)(ii) and (f)(i) to calculate a value for .
= ______
Working
Using
with and example values , :
Answer
1.6 × 10^-6 Ω m (example)
Background Concept
Resistivity is a material property that links resistance to geometry:
In this practical, a rearranged relationship is provided:
where comes from the graph, is the cross-sectional area from the diameter, and is given.
Unit check:
- in
- in
- in
So has units , as required.
Understanding the Question
You must use your value of from (a)(ii) and your value of from (f)(i), together with , to calculate the resistivity .
Approach
- Substitute directly into .
- Keep everything in SI units.
- Quote the result to sensible significant figures.
Step-by-Step Reasoning
Using example values:
Substitute:
Multiply the numbers and powers of ten:
Key Takeaways
- Resistivity calculations depend strongly on accurate diameter because .
- Always check units: must be .
Common Mistakes
- Using in or instead of .
- Forgetting or using the wrong resistor value.
- Using instead of in the resistivity formula.
Things to Be Careful About
- Use your own measured and graph-derived (your final is student-dependent).
- Keep appropriate significant figures; don’t claim more precision than your measurements justify.
The rest of this paper
1 more questions- Q2Manipulation, Measurement and Observation · Analysis, Conclusions and Evaluation · Presentation of Data and Observations20M