Physics 9702/35 — May/June 2012
Cambridge AS Level · Advanced Practical Skills · worked solutions for every part, with the mark scheme
Topics Manipulation, Measurement and Observation · Presentation of Data and Observations · Analysis, Conclusions and Evaluation
You may not need to use all of the materials provided.
In this experiment, you will investigate how the current in a circuit depends on the resistance of the circuit.
Set up the circuit as shown in Fig. 1.1. The crocodile clip should be positioned so that three of the resistors from the chain are included in the circuit.
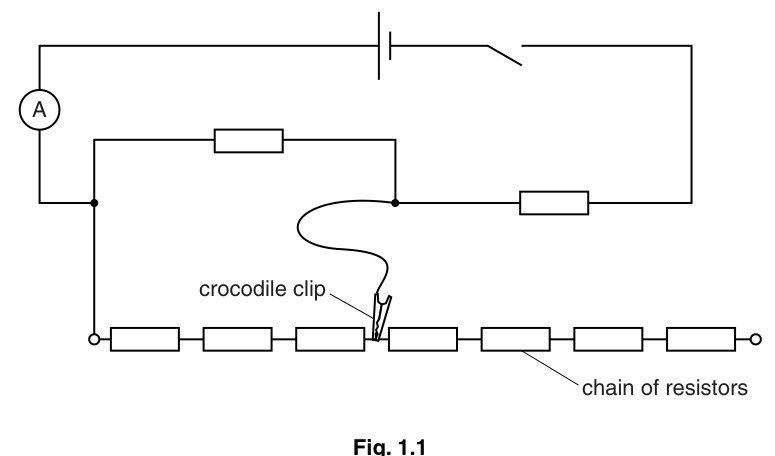
All the resistors have the same value of resistance .
Answer
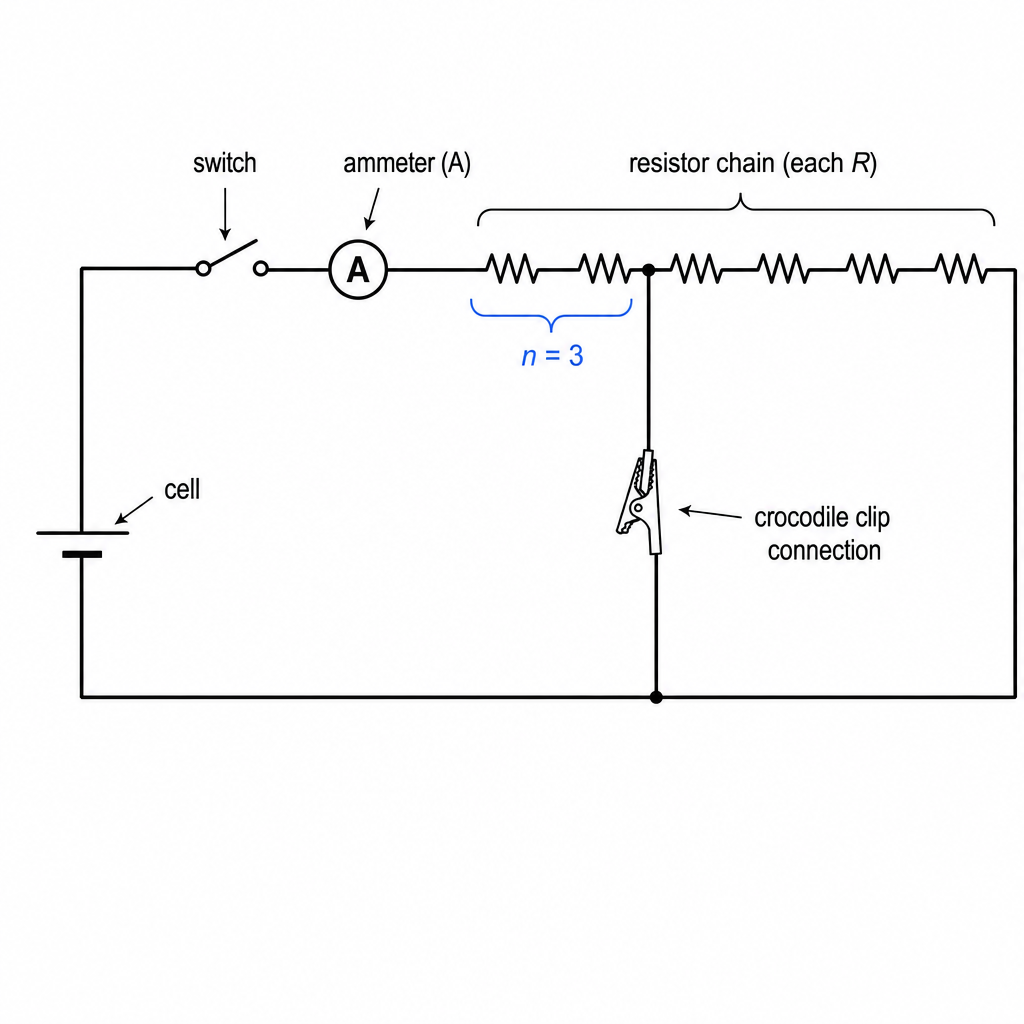
Set up the circuit as in Fig. 1.1 with the cell, switch and ammeter in series, and position the crocodile clip so that three resistors from the chain are included (so ).
Circuit set up with three resistors included (n = 3).
Background Concept
In a simple d.c. circuit, the current depends on the total resistance in the circuit. To investigate this experimentally, we change the resistance in a controlled way and measure the resulting current with an ammeter.
An ammeter measures current and must be connected in series so that the same current flows through it as through the components.
A crocodile clip can be used as a movable connection point, allowing different numbers of identical resistors to be included in the circuit.
Understanding the Question
You are given a chain of identical resistors (each has resistance ). The circuit diagram shows that a crocodile clip picks a connection point on the chain. You must set the clip so that three resistors from the chain are included in the circuit to begin with.
The key success criteria are:
- ammeter in series,
- correct selection of three resistors using the crocodile clip,
- secure connections so readings are stable.
Approach
- Build the series circuit (cell–switch–ammeter–resistor chain).
- Use the crocodile clip to choose the junction such that the current path includes exactly three resistors.
- Check that the switch can safely open/close the circuit before taking readings.
Step-by-Step Reasoning
- Connect the cell, switch, and ammeter in series.
- Connect one end of the resistor chain into the circuit.
- Attach the crocodile clip to the junction after the third resistor (counting along the chain from the connected end) so that exactly three resistors lie in the conducting path.
- Ensure the crocodile clip grips metal firmly (poor contact increases resistance unpredictably).
- Confirm the ammeter reads approximately zero when the switch is open.
Key Takeaways
- Ammeter is always connected in series.
- The crocodile clip changes how many identical resistors are included, changing the circuit resistance.
- Good electrical contact is essential for reliable data.
Common Mistakes
- Connecting the ammeter in parallel (can damage the meter and gives wrong readings).
- Miscounting resistors so the wrong is used.
- Loose crocodile clip contact causing fluctuating current readings.
Things to Be Careful About
- Count included resistors carefully: the conducting path must pass through exactly three resistors.
- Avoid short circuits: ensure the clip does not bypass resistors unintentionally.
- Check ammeter range is appropriate before closing the switch.
Close the switch.
Answer
Close the switch.
Switch closed.
Background Concept
Closing the switch completes the circuit so that a potential difference from the cell is applied across the external resistance, producing a current.
Understanding the Question
You are instructed to close the switch so that current flows and the ammeter can give a reading.
Approach
Simply close the switch and allow the reading to settle before recording it in the next part.
Step-by-Step Reasoning
- Close the switch to complete the circuit.
- Watch the ammeter needle/digital display.
- Wait briefly for the reading to become steady (a fluctuating reading often indicates poor contact).
Key Takeaways
- Switch closed → circuit complete → current flows.
Common Mistakes
- Reading the ammeter before the switch is closed.
- Closing the switch only momentarily so the reading cannot stabilise.
Things to Be Careful About
- If the current is unexpectedly large, open the switch and check connections and meter range.
Record the ammeter reading and the number of resistors from the chain included in the circuit.
= ______
= ______
Answer
(example reading)
I = 0.22 A, n = 3 (example).
Background Concept
Current is measured using an ammeter in series. The number of resistors included, , is a dimensionless count of identical resistors in the conducting path.
Understanding the Question
With the crocodile clip set so that three resistors are in circuit, you must record:
- the ammeter reading (include unit A),
- the number of included resistors (should be here).
Approach
- Read the ammeter once it is steady.
- Record by counting the resistors actually in the current path (as selected by the crocodile clip position).
Step-by-Step Reasoning
- With the switch closed, observe the ammeter reading.
- Record to the meter’s resolution (e.g. to 0.01 A on a digital meter if that is what it displays).
- Count the number of resistors between the fixed end connection and the crocodile-clip junction; record this as .
- Enter both values clearly.
Key Takeaways
- needs a unit; does not.
- A correct value is essential because it is the independent variable later.
Common Mistakes
- Omitting the unit for .
- Recording the wrong because of miscounting or misunderstanding which resistors are included.
- Recording an unstable reading caused by a loose crocodile clip.
Things to Be Careful About
- Make sure the ammeter is on the correct range.
- If the reading drifts, improve contact and re-check connections before recording.
Open the switch.
Answer
Open the switch.
Switch opened.
Background Concept
Opening the switch breaks the circuit so current stops. This reduces heating of resistors and avoids draining the cell between readings.
Understanding the Question
You are instructed to open the switch after taking the measurement so the circuit is not left conducting continuously.
Approach
Open the switch immediately after recording the reading.
Step-by-Step Reasoning
- After recording and , open the switch.
- Confirm the ammeter returns to (approximately) zero.
Key Takeaways
- Open switch between readings to keep conditions more consistent.
Common Mistakes
- Leaving the switch closed so the resistors warm up and resistance changes slightly.
Things to Be Careful About
- If the ammeter does not return near zero when open, check for an unintended alternative current path.
By attaching the crocodile clip to different junctions and terminals on the chain of resistors, repeat (b) until you have six sets of readings of and .
Include values of in your table.
Answer
Six sets of readings of and recorded, with calculated values of .
Example table:
| 1 | 0.273 | 7.33 |
| 2 | 0.237 | 12.7 |
| 3 | 0.222 | 18.0 |
| 4 | 0.214 | 23.4 |
| 5 | 0.209 | 28.7 |
| 6 | 0.206 | 34.0 |
Six readings of I and n with calculated (n+1)/I in a single table (student-dependent).
Background Concept
To investigate how current depends on resistance, you must vary the circuit resistance systematically and measure the resulting current. Good experimental data requires:
- an adequate range of the independent variable,
- sufficient number of data points,
- consistent measurement technique,
- clear presentation with units.
A derived quantity like must be calculated from measured values and recorded with correct units. Since is dimensionless and is in amperes, has unit .
Understanding the Question
You must move the crocodile clip to select different numbers of resistors , take six readings of current , and tabulate these. You are explicitly told to include a column for .
So the table must include at least:
- ,
- with unit A,
- with unit ,
and it must contain six rows of data covering different values.
Approach
- Choose six different values of (e.g. to if available).
- For each :
- close switch, wait for steady ammeter reading, record ,
- open switch,
- compute .
- Keep presentation consistent (same decimal places where appropriate).
Step-by-Step Reasoning
- Start from an initial setting (e.g. as in part b).
- Move the crocodile clip to a different junction to change .
- Each time:
- close the switch, read steadily,
- open the switch to minimise heating,
- calculate
using your recorded and .
- Record all results in a single clear table.
- Use consistent significant figures: typically to the meter resolution, and the calculated column to 2–3 s.f. (or matching the uncertainty implied by ).
Key Takeaways
- Use a sensible range of values and at least six data points.
- Always include units in table headings for measured and derived quantities.
- Calculated quantities should be recorded to sensible significant figures.
Common Mistakes
- Not taking six different values (repeating the same ).
- Forgetting to include the derived column .
- Writing units in the body of the table rather than in the heading.
- Inconsistent significant figures/decimal places within a column.
Things to Be Careful About
- Ensure is correct each time you move the clip.
- Avoid leaving the switch closed for long periods (temperature rise changes resistance).
- Watch for poor contact at the crocodile clip; it can add extra resistance and spoil the trend.
Plot a graph of on the -axis against on the -axis.
Answer
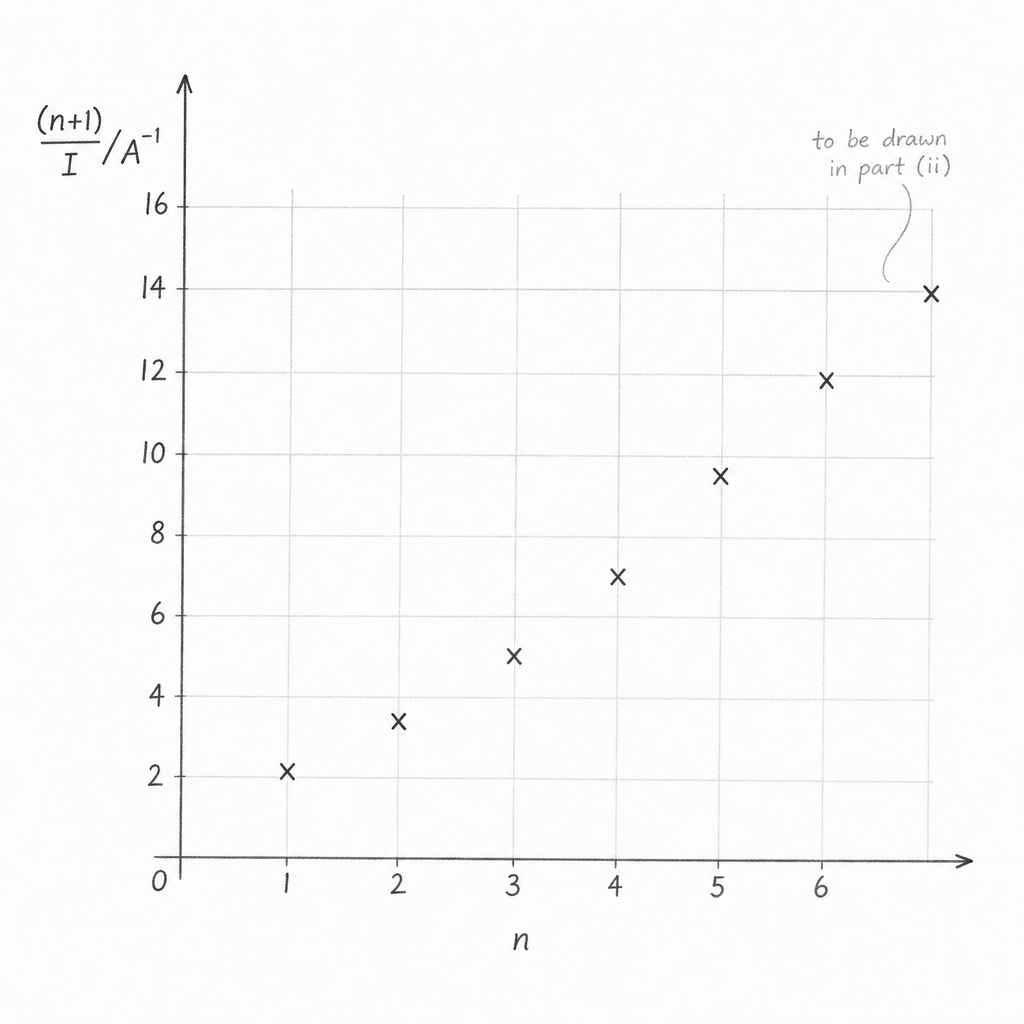
Plot (in ) on the -axis against on the -axis, using suitable scales and plotting all six points.
Graph of (n+1)/I (A^-1) against n plotted.
Background Concept
A graph is used to reveal relationships between variables. To gain marks in practical graphing:
- axes must be labelled with the correct quantities and units,
- scales should be simple and use a large fraction of the available grid,
- points must be plotted accurately.
Here, is dimensionless and has unit .
Understanding the Question
You are told explicitly what to plot:
- -axis:
- -axis:
So you must transfer your table values to a graph with correct axis labels and scales.
Approach
- Draw axes and label them:
- horizontal:
- vertical:
- Choose scales that spread the points out (at least half the grid in each direction).
- Plot each point carefully.
Step-by-Step Reasoning
- Put on the horizontal axis because it is the independent variable you set by moving the crocodile clip.
- Put on the vertical axis because it is calculated from measurements.
- Use a simple scale (e.g. 1 or 2 units per large square) and avoid awkward scales (like 3 per square).
- Plot all six points using small, neat crosses.
Key Takeaways
- Correct axes and units are essential.
- A good scale and accurate plotting are what earn the practical marks.
Common Mistakes
- Plotting against instead of against .
- Missing units on the -axis label.
- Using a tiny graph area so points are bunched up.
Things to Be Careful About
- Do not join point-to-point; you will draw a best-fit line in the next part.
- Ensure the axis label includes the unit format, e.g. .
Draw the straight line of best fit.
Answer
Draw a single straight line of best fit through the plotted points (balanced with points roughly evenly scattered about the line).
Straight line of best fit drawn.
Background Concept
A best-fit line represents the overall linear trend in experimental data when there is scatter. It should not be drawn as a join-the-dots curve unless the relationship is clearly non-linear.
Understanding the Question
You have already plotted against . You must now draw the straight line that best represents the trend.
Approach
Use a ruler to draw one straight line so that the points are balanced: similar numbers of points above and below the line, and the line runs through the middle of the scatter.
Step-by-Step Reasoning
- Place the ruler so that the line passes centrally through the cluster of points.
- Adjust by eye to balance the residuals (vertical distances) of the points from the line.
- Draw the line across most of the graph area (not just between the first and last points).
Key Takeaways
- Best-fit line is about the trend, not passing through every point.
Common Mistakes
- Joining points one-by-one.
- Forcing the line through the origin when not justified.
- Drawing a line only through two points (ignoring the others).
Things to Be Careful About
- Use a sharp pencil and a ruler.
- Extend the line across the full range used for gradient/intercept measurements.
Determine the gradient and -intercept of this line.
gradient = ______
-intercept = ______
Working
Using two points on the best-fit line, e.g. and :
-intercept from the line at :
Answer
gradient
-intercept
gradient = 5.34 A^-1, y-intercept = 2.0 A^-1 (example).
Background Concept
For a straight-line graph, the gradient (slope) is
and the -intercept is the value of when .
Here:
- (dimensionless)
- (unit )
So the gradient has unit per unit , i.e. .
Understanding the Question
You must extract two quantities from your best-fit line:
- the gradient,
- the -intercept.
These will be used later to find constants and .
Approach
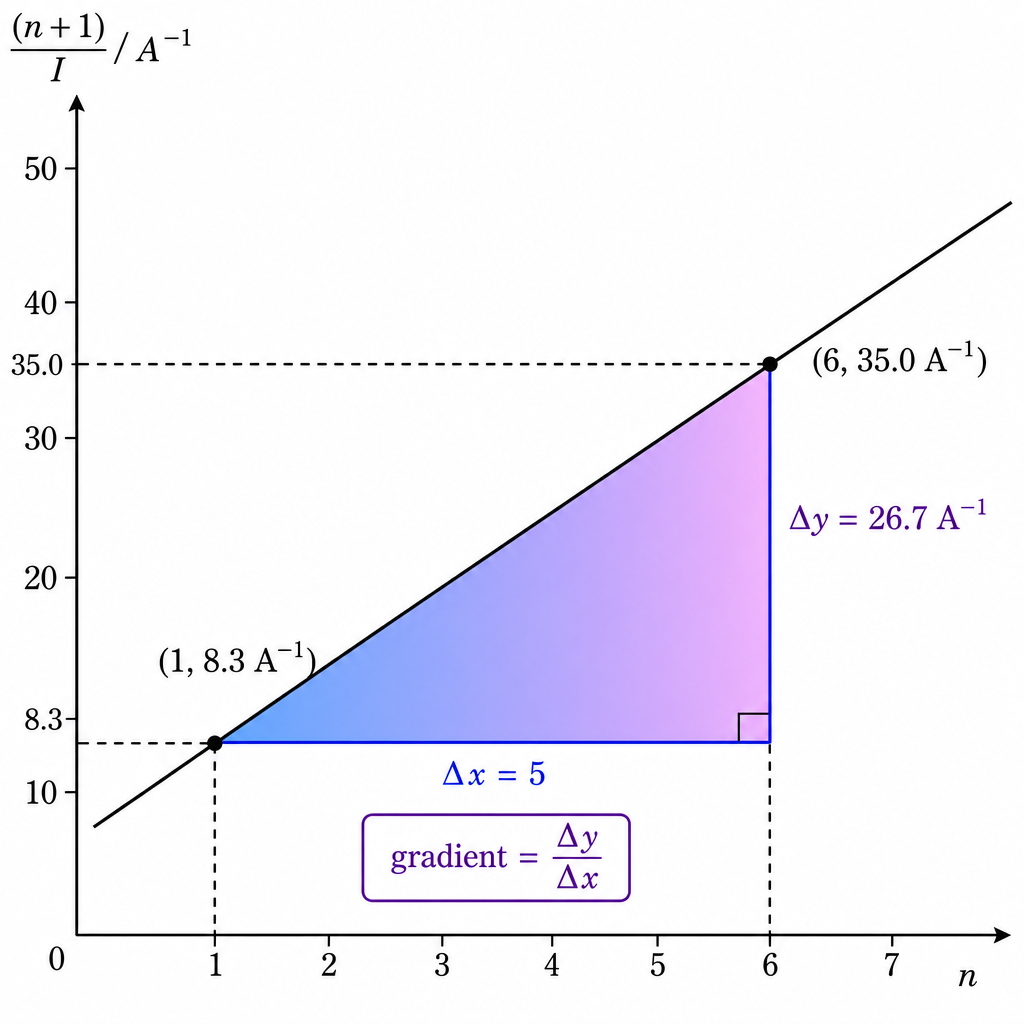
- Choose two well-separated points on the best-fit line (not necessarily plotted points).
- Read their coordinates accurately.
- Compute and , then gradient .
- Read the intercept where the line crosses the -axis (at ).
Step-by-Step Reasoning
- Pick two points far apart to reduce percentage reading error (a small triangle gives a large fractional uncertainty).
- Suppose points on the line are approximately and .
- Then:
So:
- For the -intercept, extend the best-fit line to and read the value of there (e.g. ).
Key Takeaways
- Use a large triangle for gradient.
- Use the best-fit line, not individual noisy points.
- Include units with gradient and intercept.
Common Mistakes
- Calculating gradient as .
- Using two adjacent points (small triangle).
- Reading the intercept from the first plotted point rather than from .
Things to Be Careful About
- Ensure your chosen points lie on the line you drew.
- Read values to the precision allowed by the graph scale.
- Do not round too early; round at the end to sensible s.f.
It is suggested that the relationship between and is
where and are constants.
Use your answers in (d)(iii) to determine values for and .
= ______
= ______
Working
Given
Comparing with for a graph of against :
Answer
P = gradient, Q = y-intercept (e.g. P = 5.34 A^-1, Q = 2.0 A^-1).
Background Concept
If a relationship can be written in the straight-line form
then a graph of against is a straight line with:
- gradient ,
- -intercept .
Understanding the Question
You are given:
and you have plotted on the -axis against on the -axis. You must use the gradient and intercept from part (d)(iii) to identify and .
Approach
Match the given equation directly to by identifying:
- ,
- ,
- ,
- .
Step-by-Step Reasoning
Rewrite the comparison clearly:
- Your graph is vs where
- The equation is
So the gradient of the graph equals and the intercept equals .
Use your numerical values from (d)(iii) directly:
- (your gradient)
- (your intercept)
Key Takeaways
- Choosing the correct axes makes the constants drop straight out as gradient and intercept.
Common Mistakes
- Swapping and .
- Using a graph of vs and then trying to read off and .
Things to Be Careful About
- Ensure you are using the gradient/intercept of the best-fit line, not from two raw points.
- Keep the units consistent: both and have unit here because is dimensionless.
Disconnect the circuit.
Connect the voltmeter across the cell.
Measure and record the voltage across the cell.
= ______
Answer
(example reading)
V = 1.50 V (example).
Background Concept
A voltmeter measures potential difference and must be connected in parallel with the component whose voltage you want to measure. A cell’s terminal p.d. can differ from its emf if current is flowing; measuring it with the circuit disconnected reduces this issue.
Understanding the Question
You must:
- disconnect the circuit,
- connect the voltmeter across the cell terminals,
- measure and record in volts.
Approach
Open the circuit so no current flows, then place the voltmeter leads directly across the cell terminals and read .
Step-by-Step Reasoning
- Ensure the switch is open and/or remove a lead so the circuit is disconnected.
- Connect the voltmeter across the cell: one lead to each terminal.
- Select an appropriate voltmeter range.
- Record the voltage reading with unit V and to the meter resolution.
Key Takeaways
- Voltmeter is always connected in parallel.
- Recording with unit and sensible precision is essential in practical work.
Common Mistakes
- Connecting the voltmeter in series.
- Measuring voltage while current is flowing (terminal p.d. may be lower than emf).
- Omitting the unit V.
Things to Be Careful About
- Ensure firm contact at the cell terminals.
- If using an analogue meter, avoid parallax error and read from the correct scale.
The constant is related to and by
Using your answers in (e) and (f), calculate a value for .
= ______
Working
Given
Rearrange:
Substitute and :
Answer
R = 4.0 Ω (example).
Background Concept
When a constant is related to measured quantities by an equation, you can determine the unknown by rearranging algebraically and substituting your experimental values.
Here the given relationship is:
where and are known from earlier parts, so can be found.
Understanding the Question
You have obtained from the graph and from a voltmeter reading. You must calculate the resistance using the provided formula.
Approach
- Rearrange to make the subject.
- Substitute your values of and .
- Quote with unit and sensible significant figures.
Step-by-Step Reasoning
Start with:
Multiply both sides by :
Divide by 2:
Now substitute your measured/derived values (example):
So to 2–3 s.f.
Key Takeaways
- Rearranging equations cleanly avoids substitution mistakes.
- Always include the final unit ( for resistance).
Common Mistakes
- Rearranging incorrectly (e.g. using ).
- Forgetting to divide by 2.
- Omitting the unit or rounding too aggressively.
Things to Be Careful About
- Use your own experimental values for and (not the example values).
- Keep enough significant figures in intermediate steps; round at the end.
The rest of this paper
1 more questions- Q2Manipulation, Measurement and Observation · Presentation of Data and Observations · Analysis, Conclusions and Evaluation20M