Physics 9702/31 — May/June 2012
Cambridge AS Level · Advanced Practical Skills · worked solutions for every part, with the mark scheme
Topics Manipulation, Measurement and Observation · Analysis, Conclusions and Evaluation · Presentation of Data and Observations
You may not need to use all of the materials provided.
In this experiment, you will investigate how the motion of a pendulum whose swing is interrupted depends on its length.
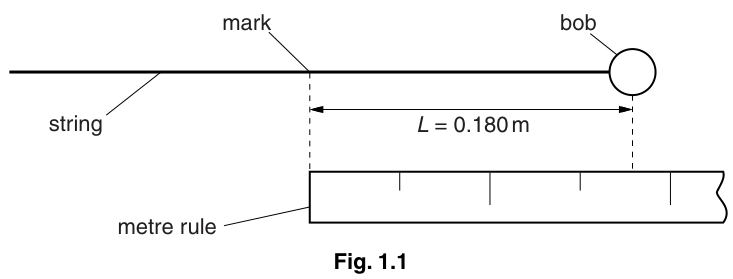
Lay the pendulum next to the rule and use the pen to make a mark on the string so that the distance is , as shown in Fig. 1.1.
Set up the apparatus, fixing the string in the split bung so that the string is just touching the wooden rod at the mark you have made.
Fig. 1.2 shows a side view and a front view of the apparatus.
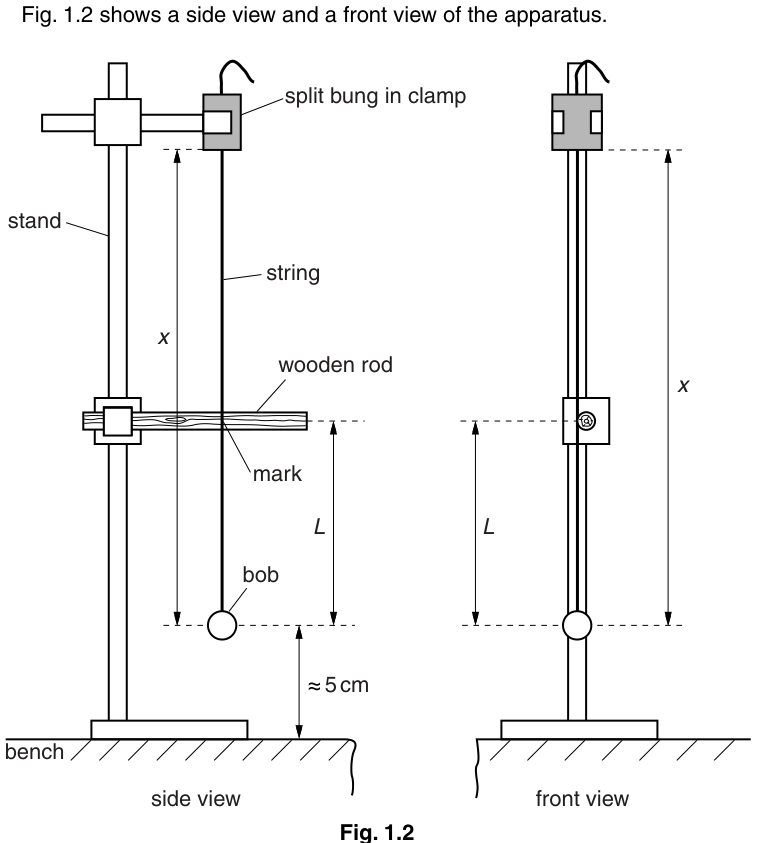
The centre of the bob should be approximately above the bench.
The distance between the bottom of the bung and the centre of the bob should be approximately .
The mark on the string should be level with the centre of the rod.
Measure and record the distance .
= ______
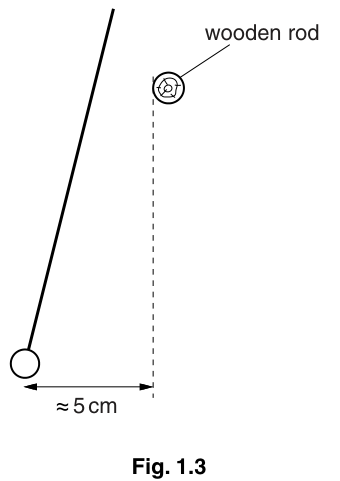
Move the bob sideways through a distance of approximately , as shown in Fig. 1.3.
Release the bob and watch its movement. The bob will move to the right and then to the left again completing a swing, as shown in Fig. 1.4. Let the pendulum swing to and fro, counting the number of swings.
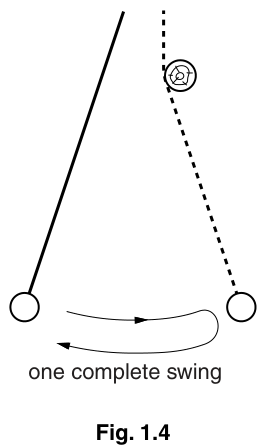
Measure and record the time for at least 10 consecutive swings.
Record enough readings to determine an accurate value for the time taken for one complete swing.
= ______
Reduce the distance . Keep constant, by adjusting the height of the wooden rod if necessary. Repeat (a)(iii) and (b) until you have six sets of values of and .
Include values of in your table.
Plot a graph of on the -axis against on the -axis.
Draw the straight line of best fit.
Determine the gradient and -intercept of this line.
gradient = ______
-intercept = ______
The quantities and are related by the equation
where and are constants.
Using your answers from (d)(iii), determine the values of and .
Give appropriate units.
= ______
= ______
The rest of this paper
1 more questions- Q2Manipulation, Measurement and Observation · Analysis, Conclusions and Evaluation20M