Physics 9702/42 — October/November 2025
Cambridge A-Level · A Level Structured Questions · worked solutions for every part, with the mark scheme
Topics Gravitational Fields · Ideal Gases · Motion in a Circle · Temperature · Thermodynamics · Oscillations · +7 more
The Earth may be considered as a uniform sphere of radius .
Cambridge is at a point on the Earth’s surface that has a latitude of north of the Equator, as shown in Fig. 1.1.
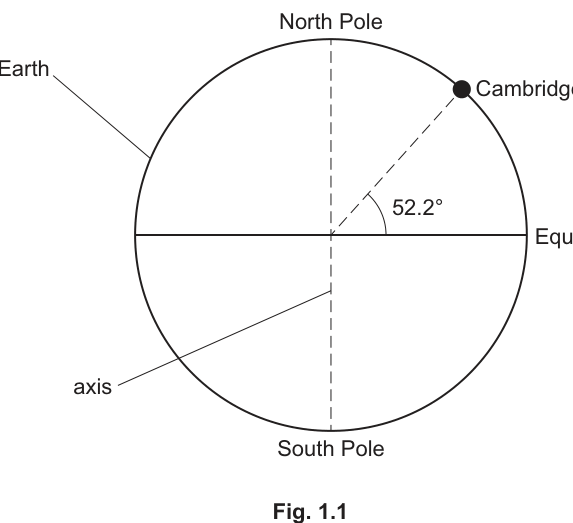
As the Earth spins on its axis, Cambridge moves in a circle that is parallel to the Equator but with a smaller radius.
At latitude , the radius of the circle about the Earth’s axis is
3.90 × 10^6 m
Background Concept
A point on the rotating Earth moves in a circle around the Earth’s rotation axis. If the point is not on the Equator, that circle has a smaller radius than the Earth because the point is closer to the axis.
In a cross-section through the Earth’s centre and the point, you can form a right triangle:
- the hypotenuse is the Earth’s radius (centre to the point),
- the adjacent side to the latitude angle is the distance from the rotation axis, i.e. the radius of the circular path.
This leads to a simple cosine relationship.
Understanding the Question
You are told:
- Earth radius ,
- Cambridge is at latitude north.
The question asks for the radius of the circle around the Earth’s rotation axis traced out by Cambridge as the Earth spins.
Approach
Use the right-triangle geometry implied by latitude:
- at latitude , the distance to the axis is reduced by a factor of .
So calculate .
Step-by-Step Reasoning
- Identify the relevant triangle: the line from Earth’s centre to Cambridge has length .
- Latitude is the angle between the equatorial plane and the radius to Cambridge.
- The perpendicular distance from the axis (i.e. the circular-path radius) is the “adjacent” side of that triangle.
So,
Substitute:
Key Takeaways
- A point at latitude moves in a circle of radius about the Earth’s axis.
- Latitude acts like an angle in a right-triangle projection onto the equatorial plane.
Common Mistakes
- Using instead of .
- Using measured from the pole instead of from the Equator (latitude is from the Equator).
- Forgetting to keep in metres.
Things to Be Careful About
- Calculator must be in degrees.
- The radius required is the distance to the rotation axis, not the Earth’s radius and not the distance to the Earth’s centre.
Working
Period of Earth’s rotation .
Using with ,
Answer
2.84 × 10^2 m s^-1
Background Concept
For uniform circular motion:
- the angular speed is the rate of rotation in ,
- for one complete revolution, the angular displacement is radians,
- if the period is , then
The linear speed of a point at radius from the axis is
This is equivalent to .
Understanding the Question
Cambridge moves in a circle of radius (from part (a)(i)) because Earth rotates.
You are asked to calculate the speed of this motion. The key extra piece of information is that Earth completes one rotation in about 24 hours.
Approach
- Convert the Earth’s rotation period into seconds.
- Find .
- Use .
Step-by-Step Reasoning
- Convert time:
- Angular speed:
- Linear speed:
So Cambridge moves at about .
Key Takeaways
- Convert period to seconds before using .
- Use (or equivalently ).
Common Mistakes
- Forgetting to convert hours to seconds.
- Using (Earth’s radius) instead of the smaller radius at latitude.
- Omitting units or giving in the wrong units.
Things to Be Careful About
- Use consistent significant figures; is typically given to 3 s.f. here.
- Ensure you use radians for (not ) when calculating .
A student of mass stands on horizontal ground in Cambridge.
Determine the magnitude of the resultant force that acts to cause the circular motion of the student.
= ______
Working
For circular motion,
Using , and ,
Answer
1.21 N
Background Concept
Uniform circular motion requires an inward (centripetal) acceleration of magnitude
By Newton’s second law, the resultant (net) force toward the centre of the circular path is
This resultant force is not an extra new force; it is the vector sum of real forces acting on the object.
Understanding the Question
A student standing in Cambridge is carried in a circle about Earth’s axis with:
- radius ,
- speed .
The question asks for the magnitude of the resultant force that produces the student’s centripetal acceleration.
Approach
Use
because , , and are known.
Step-by-Step Reasoning
- Square the speed to get .
- Divide by to get the centripetal acceleration magnitude .
- Multiply by to get .
Numerically:
This is small compared with the student’s weight (), which is why the effect of Earth’s rotation on apparent weight is small.
Key Takeaways
- Resultant force for circular motion is found from .
- Even large speeds can give small centripetal force if is very large.
Common Mistakes
- Using instead of the circle radius at latitude.
- Mixing up and without converting properly.
- Forgetting to square .
Things to Be Careful About
- Keep enough significant figures from part (a)(ii) so rounding does not change the final answer noticeably.
- Ensure the radius used is in metres and speed in so that comes out in newtons.
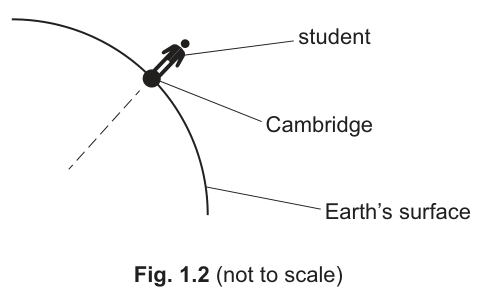
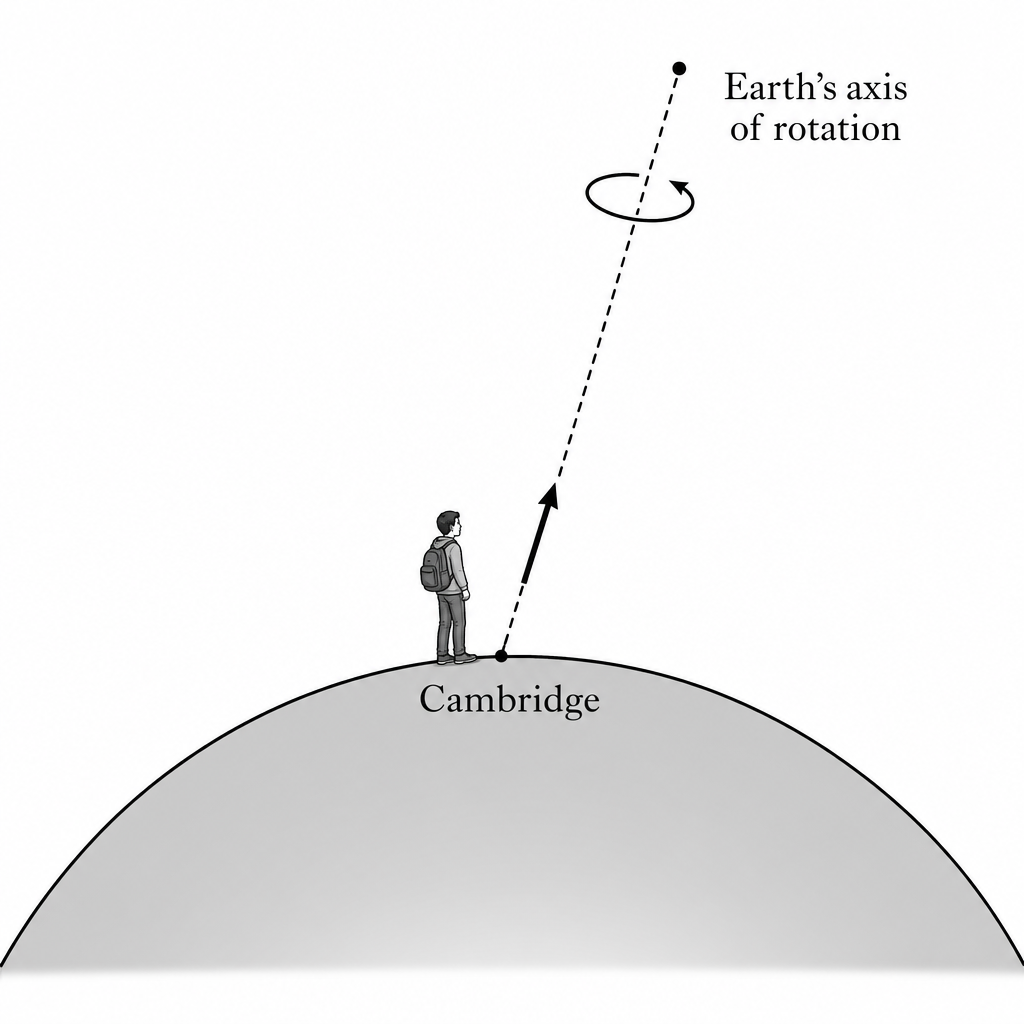
On Fig. 1.2, draw an arrow to show the direction of the resultant force that acts on the student.
Answer
Arrow from the student pointing towards the Earth’s axis of rotation (along the dashed line).
Towards the Earth’s rotation axis (along the dashed line).
Background Concept
In uniform circular motion, the acceleration is always directed toward the centre of the circular path. Therefore, the resultant force (since ) must also point toward the centre of the circle.
Understanding the Question
The student is moving in a circle around the Earth’s axis (not around the Earth’s centre). The diagram shows a dashed line from the student in the direction of the axis of rotation.
The question asks you to indicate the direction of the resultant force responsible for this circular motion.
Approach
- Identify the centre of the student’s circular path: it lies on the Earth’s rotation axis.
- Draw the centripetal/resultant force arrow pointing from the student toward that axis.
Step-by-Step Reasoning
- Cambridge’s path is a circle whose centre is on the rotation axis.
- The resultant force for circular motion is centripetal, so it points toward the centre of that circle.
- On Fig. 1.2 the dashed line indicates the direction toward the axis, so the required arrow should be drawn along this dashed line, pointing inward toward the axis.
Key Takeaways
- Centripetal/resultant force always points to the centre of the circular path.
- Here the centre is on the Earth’s axis, not at the Earth’s centre.
Common Mistakes
- Drawing the arrow toward the Earth’s centre instead of toward the rotation axis.
- Drawing the arrow tangential to the motion (tangential would correspond to changing speed, not direction).
Things to Be Careful About
- The question explicitly says the student moves in a circle parallel to the Equator: that means the centre of the circle is on the axis.
- Ensure the arrow direction is toward the axis (not away from it).
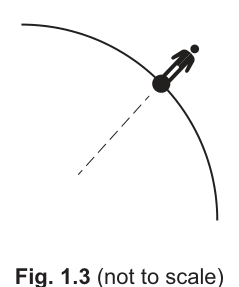
On Fig. 1.3, draw labelled arrows from the student to show the directions of the forces that act on the student to cause the resultant force in (b)(ii).
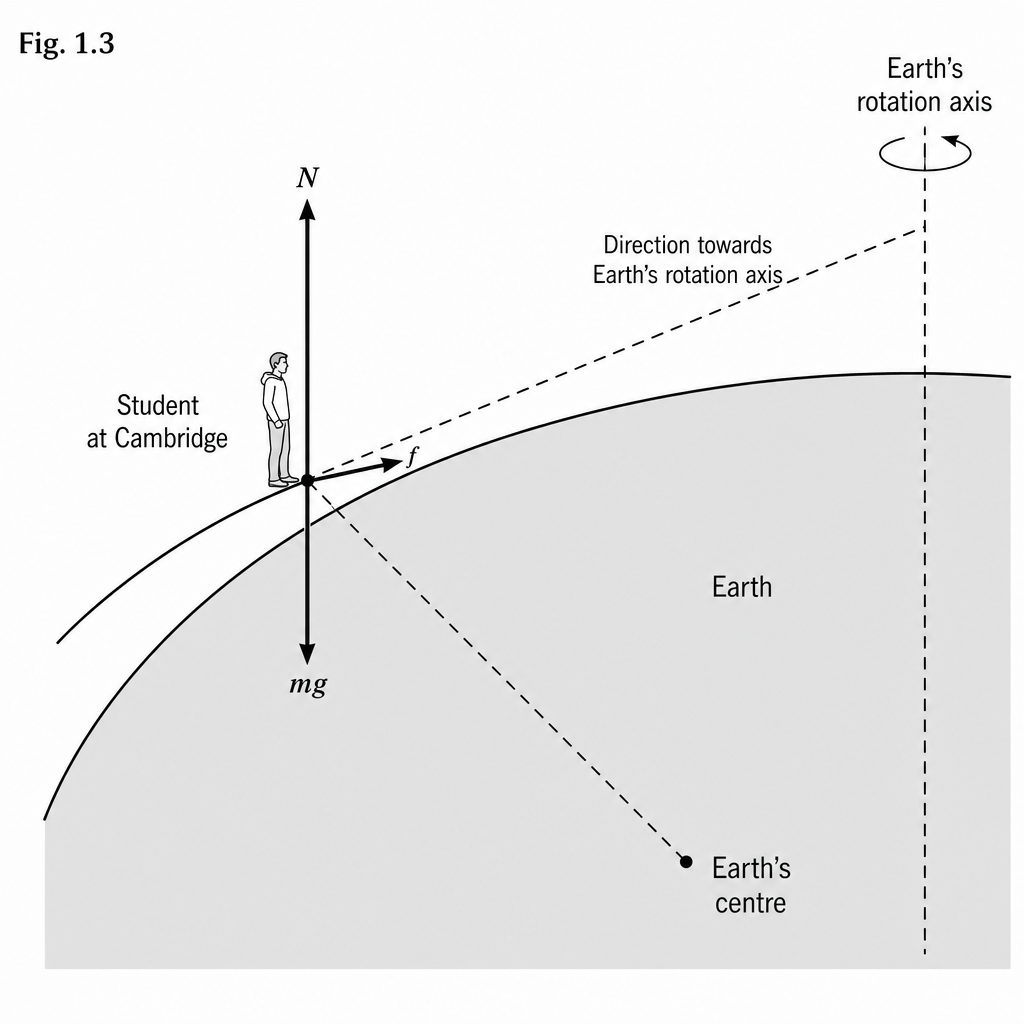
Answer
Forces on the student:
- weight vertically downward (towards Earth’s centre),
- normal contact force from the ground perpendicular to the ground (upward),
- static friction along the ground towards the Earth’s rotation axis.
These forces combine to give the resultant shown in (b)(ii).
Weight mg down, normal N up (perpendicular to ground), and static friction along the ground towards the rotation axis.
Background Concept
The “centripetal force” is not a separate force; it is the resultant (vector sum) of the real forces acting on the object.
For a person standing on the Earth, the real forces available are:
- gravitational force (weight) toward the Earth’s centre,
- contact force from the ground. The contact force can include:
- a normal reaction perpendicular to the ground,
- a static frictional force parallel to the ground.
Because the required resultant force is toward the Earth’s rotation axis (part (b)(ii)), you should include any force components needed to make the resultant point in that direction.
Understanding the Question
You are asked to draw labelled force arrows acting on a stationary student on horizontal ground in Cambridge.
From part (b)(ii), the resultant force must point toward the Earth’s rotation axis (along the dashed line). The question now asks which real forces combine to produce that resultant.
Approach
- Start with the standard forces on a person standing still: and .
- Notice that the centripetal resultant is not necessarily vertical; it is toward the axis.
- Include a static friction force along the ground if needed so that the vector sum of forces can point toward the axis.
Step-by-Step Reasoning
- Draw weight :
- It acts toward the centre of the Earth.
- On the local diagram, this is drawn vertically downward.
- Draw normal reaction :
- It acts perpendicular to the (horizontal) ground.
- On the local diagram, this is drawn vertically upward.
- Draw static friction :
- Friction acts parallel to the ground surface.
- Its direction should be such that when added vectorially with and , the resultant points toward the rotation axis (the dashed-line direction).
- Therefore, draw along the ground pointing toward the axis (i.e. in the direction that helps the net force align with the dashed line).
Key Takeaways
- The centripetal force is the resultant of real forces.
- For an object on a surface, include both the normal reaction and (if necessary) static friction.
- Always match the resultant direction (toward the centre of the circular path).
Common Mistakes
- Drawing only and even when their resultant cannot point toward the axis direction shown.
- Drawing the resultant itself again instead of the real forces.
- Not labelling the forces.
Things to Be Careful About
- Weight is the gravitational force (toward Earth’s centre), not “mass” and not the centripetal force.
- Static friction can act even when the student is not sliding; it adjusts to whatever value is needed (up to a maximum) to prevent relative motion.
- Make sure the friction arrow is parallel to the ground, while is perpendicular to the ground.
Answer
Any two masses attract each other with a force
acting along the line joining their centres (attractive).
Attractive force between two point masses: F = G m1 m2 / r^2 along the line joining their centres.
Background Concept
Newton’s law of gravitation describes the gravitational force between two point masses (or spherically symmetric masses treated as if their mass is concentrated at the centre). The law is an inverse-square law: the force decreases as the square of the separation increases.
The magnitude is
where is the gravitational constant, and are the masses, and is the distance between their centres.
Understanding the Question
You are asked to state Newton’s law of gravitation. That means giving the correct proportionalities and/or the full formula, and indicating direction (along the line joining centres, attractive).
Approach
Write the standard equation for gravitational force, and include the statement that it is attractive and acts along the line joining the masses.
Step-by-Step Reasoning
- Recall the inverse-square dependence: .
- Recall proportionality to both masses: .
- Combine with the constant to form the standard equation and state it is attractive along the line joining centres.
Key Takeaways
- Gravitational force between masses follows an inverse-square law.
- The complete statement includes direction (attractive, along the line joining centres).
Common Mistakes
- Writing (missing the square).
- Not stating the force is attractive / acts along the line joining centres.
Things to Be Careful About
- is the centre-to-centre separation.
- Use correct symbols: is a constant, not to be confused with (field strength near Earth).
One of the basic assumptions of the kinetic theory of gases is that there are no forces exerted between the molecules of the gas except during collisions.
State two other basic assumptions of the kinetic theory of gases.
Answer
Any two:
- Molecules move in constant random motion (in straight lines between collisions).
- Collisions between molecules (and with the container walls) are perfectly elastic.
Random straight-line motion between collisions; collisions are perfectly elastic.
Background Concept
The kinetic theory model treats a gas as a very large number of microscopic particles whose motion explains macroscopic quantities like pressure and temperature. To make the model solvable, several assumptions are made (ideal-gas assumptions).
Common assumptions include:
- Molecules are in continuous random motion.
- They move in straight lines at constant speed between collisions.
- Collisions between molecules and with container walls are perfectly elastic.
- The time of collision is negligible compared with the time between collisions.
- The volume of the molecules is negligible compared with the volume of the container.
- No intermolecular forces act except during collisions (given in the question).
Understanding the Question
One assumption has already been stated (no intermolecular forces except during collisions). You must state two different assumptions from the standard list.
Approach
Choose any two widely accepted kinetic theory assumptions that are clearly distinct from “no forces except during collisions”. The safest pair is “random motion / straight-line motion between collisions” and “perfectly elastic collisions”.
Step-by-Step Reasoning
- State assumption 1 about how molecules move between collisions.
- State assumption 2 about the nature of collisions.
These are both fundamental and are commonly credited.
Key Takeaways
- Kinetic theory assumptions describe particle motion and simplify interactions.
- “Perfectly elastic” is important because it conserves kinetic energy in collisions.
Common Mistakes
- Repeating the given assumption in different words (earns no credit).
- Stating a consequence rather than an assumption (e.g. “pressure is due to collisions” is an explanation, not an assumption).
Things to Be Careful About
- Ensure your two statements are clearly separate assumptions.
- Use precise wording: “perfectly elastic” means total kinetic energy conserved in collisions (not just momentum).
Hydrogen gas consists of molecules that each have a mass of . Hydrogen may be considered to be an ideal gas.
A spherical balloon contains of hydrogen gas at a temperature of . At this temperature, the volume of gas in the balloon is .
Working
Using
Answer
2.00 × 10^5 Pa
Background Concept
For an ideal gas, the macroscopic variables pressure , volume , temperature , and amount of gas are related by the equation of state
where .
Understanding the Question
You are given:
and asked to determine the pressure in pascals.
Approach
Rearrange the ideal gas equation to , then substitute all values in SI units (they already are).
Step-by-Step Reasoning
Start from
Rearrange:
Substitute:
Calculate the numerator:
Divide by :
Key Takeaways
- For ideal gases, pressure is found directly from .
- Always check units: must be in and in K.
Common Mistakes
- Using in or without converting to .
- Using in instead of kelvin.
Things to Be Careful About
- Significant figures: given data are mostly 3 s.f., so to 3 s.f. is appropriate.
- Do not confuse with (Boltzmann constant); would require number of molecules , not moles .
Working
Number of molecules:
Volume per molecule:
Average separation :
Answer
2.68 × 10^-9 m
Background Concept
If particles are spread roughly uniformly in a gas, a simple estimate of the average separation comes from thinking of each molecule as “owning” a small cube of volume equal to the average volume per molecule.
If the number of molecules is in a total volume , then volume per molecule is , and the cube side length (an estimate of separation) is
To find from moles:
where .
Understanding the Question
You are given the amount of hydrogen and the balloon volume . You must estimate the typical distance between neighbouring hydrogen molecules.
Approach
- Convert moles to number of molecules using .
- Find average volume per molecule .
- Take the cube root to convert a volume scale into a length scale.
Step-by-Step Reasoning
Compute :
Average volume per molecule:
Now cube root to estimate separation:
A useful way to see the power of ten is to rewrite as :
- cube root of is
- cube root of is about
So
Key Takeaways
- Convert moles to molecules with .
- Average separation in a uniform gas scales as .
Common Mistakes
- Forgetting the cube root and using directly as a distance.
- Mixing up (number of molecules) and (number of moles).
Things to Be Careful About
- This is an estimate assuming a roughly uniform distribution.
- Keep track of powers of ten carefully when cube-rooting: .
Use your answer in (c)(ii) to calculate the average gravitational force between adjacent molecules in hydrogen gas.
= ______
Working
Using
with and :
Answer
1.04 × 10^-46 N
Background Concept
Newton’s law of gravitation applies to any two masses. For two identical masses separated by distance :
This force is always attractive and acts along the line joining the masses.
Understanding the Question
You have already estimated the average separation between adjacent hydrogen molecules from (c)(ii). You are now asked to use that separation to estimate the gravitational force between two neighbouring molecules.
Given:
- (mass of one molecule)
Find .
Approach
Use , substituting the molecular mass for both objects and using the separation from (c)(ii).
Step-by-Step Reasoning
Start with
Substitute values:
Compute pieces:
So
Numerator:
Divide:
Key Takeaways
- Gravitational attraction exists between any masses but can be extremely small for molecules.
- Using standard form helps keep track of very small forces.
Common Mistakes
- Using instead of (forgetting both masses contribute).
- Squaring the separation incorrectly or mixing powers of ten.
Things to Be Careful About
- must be in metres and in kilograms.
- The separation used is an average estimate; the force is therefore also an estimate.
By considering the weight of a molecule, suggest with a reason whether your answer in (d)(i) is consistent with the assumption of the kinetic theory of gases that there are no forces exerted between molecules.
Working
Weight of a molecule:
Since , the intermolecular gravitational force is negligible.
Answer
Yes, it is consistent: the force between molecules is many orders of magnitude smaller than the weight of a molecule, so it can be taken as zero.
Yes. The intermolecular gravitational force is negligible compared with the molecule’s weight (mg).
Background Concept
A key part of judging whether a force can be neglected is comparing its magnitude with other relevant forces in the situation.
For a particle of mass near Earth, the weight is
If an interparticle force is many orders of magnitude smaller than typical forces acting, it is reasonable in a model to treat it as effectively zero.
Understanding the Question
You found in (d)(i) that the gravitational force between neighbouring hydrogen molecules is extremely small. The kinetic theory assumption says molecules exert no forces on each other (except during collisions). You are asked to decide whether your calculated force supports that assumption by comparing with the weight of one molecule.
Approach
- Compute the weight of a hydrogen molecule.
- Compare to the gravitational force between molecules from (d)(i).
- Conclude whether the intermolecular force is negligible.
Step-by-Step Reasoning
Calculate the weight:
Compare with
The ratio is about , meaning the intermolecular gravitational force is around 20 orders of magnitude smaller than the weight. Such a tiny force has no measurable effect on the gas behaviour compared with molecular collisions and is therefore negligible.
Key Takeaways
- Use order-of-magnitude comparisons to justify modelling assumptions.
- Molecular gravitational attraction in a gas is extraordinarily small.
Common Mistakes
- Saying “not consistent because the force is not exactly zero” (models often neglect forces that are negligible).
- Comparing to the wrong quantity (e.g. comparing with pressure instead of a force scale like ).
Things to Be Careful About
- You must give both a decision (consistent / not consistent) and a reason (comparison showing it is negligible).
- Ensure you compare forces in the same units (newtons).
Answer
Two objects are in thermal equilibrium when, if they are placed in thermal contact, there is no net transfer of thermal energy between them (so they are at the same temperature).
No net thermal energy transfer between them when in contact (same temperature).
Background Concept
Thermal equilibrium is a condition about energy transfer. When two bodies at different temperatures are put in thermal contact, thermal energy is transferred from the hotter to the cooler object. This continues until the temperatures become equal.
At that point, although microscopic energy exchanges still occur, there is no net flow of thermal energy in either direction.
Understanding the Question
You are asked for the meaning of “two objects being in thermal equilibrium”. The mark scheme typically expects two ideas:
- what happens if they are put in thermal contact (net heat flow), and
- the temperature condition (equal temperatures).
Approach
State the operational test: bring them into thermal contact. Then state the criterion: no net heat transfer, which implies equal temperature.
Step-by-Step Reasoning
- If object A and object B are placed in thermal contact and A is hotter, energy flows A → B.
- If B is hotter, energy flows B → A.
- In thermal equilibrium there is no net energy transfer in either direction, which only occurs when their temperatures are equal.
Key Takeaways
- Thermal equilibrium is defined by no net thermal energy transfer.
- In equilibrium, the objects have the same temperature.
Common Mistakes
- Saying only “they have the same temperature” and not mentioning the no-net-transfer condition (often loses a mark).
- Saying “no heat transfer” (too absolute); it should be no net transfer.
Things to Be Careful About
- Use the phrase “no net transfer of thermal energy” (or “no net heat flow”).
- Make it clear it applies when in thermal contact.
Fig. 3.1 shows a type of thermometer called a constant volume gas thermometer.
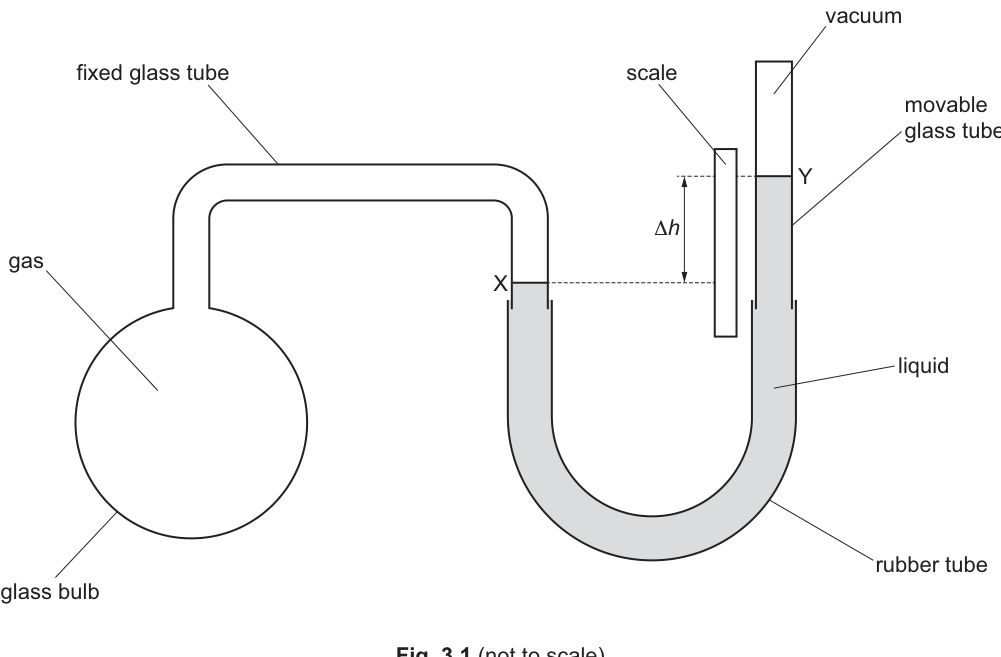
The thermometer is used to determine the thermodynamic temperature of the gas in the glass bulb.
The glass bulb is immersed in the environment for which the temperature is to be measured. The height of the movable glass tube is then adjusted so that the level of the liquid on the left-hand side aligns with the reference line X marked on the fixed glass tube. The reference line Y is marked on the side of the movable glass tube. The level of the liquid at Y is higher than at X as a result of the pressure of the gas in the glass bulb.
The difference in height between the liquid levels at X and Y is then measured using the scale. The thermodynamic temperature of the gas is directly proportional to the pressure of the gas. This pressure is directly proportional to .
The value of can be used to calculate the pressure of the gas. In order to do this, the gravitational field strength is used, along with a property of the liquid.
State the property of the liquid that is used to calculate the pressure.
Answer
The density of the liquid (manometer fluid).
Density of the liquid.
Background Concept
A constant-volume gas thermometer measures gas pressure using a manometer. The pressure difference between two levels of a liquid column is given by
where:
- is the density of the liquid,
- is gravitational field strength,
- is the vertical height difference of the liquid surfaces.
Understanding the Question
The question says you use and “a property of the liquid” to calculate the gas pressure from the height difference . In the formula above, the liquid property is .
Approach
Recall the manometer relation and identify the liquid property appearing in it.
Step-by-Step Reasoning
- The height difference produces a hydrostatic pressure difference.
- Hydrostatic pressure depends on and .
- Therefore the required liquid property is its density .
Key Takeaways
- Manometer pressure differences depend on , , and .
- The relevant liquid property is density.
Common Mistakes
- Stating “viscosity” or “surface tension” (not used in the hydrostatic pressure formula).
- Stating “mass” rather than density.
Things to Be Careful About
- It must be the density of the manometer liquid, not the gas.
Before the measurement of can be made, the glass bulb needs to reach thermal equilibrium with the environment for which the temperature is to be measured.
State two disadvantages of using a constant volume gas thermometer to measure temperature.
Answer
- Slow response / must wait a long time for the bulb to reach thermal equilibrium with the environment.
- Bulky and fragile / not convenient or portable (requires a careful set-up and adjustment to keep volume constant).
Slow response (time to reach equilibrium) and bulky/fragile (impractical, needs careful set-up/adjustment).
Background Concept
A practical thermometer should:
- reach thermal equilibrium with the object/environment reasonably quickly (short response time), and
- be convenient to use (portable, robust, easy to read).
A constant-volume gas thermometer is a primary standard instrument: accurate in principle, but not designed for everyday use.
Understanding the Question
You are told that before is measured, the bulb must reach thermal equilibrium with the environment. You must give two disadvantages of using this thermometer to measure temperature. The expected answers are practical limitations stemming from the apparatus and the equilibrium requirement.
Approach
Choose two clear, distinct disadvantages:
- something about time/response (equilibrium), and
- something about practicality (size/fragility/complexity of adjustment/readings).
Step-by-Step Reasoning
- Slow to reach equilibrium: The bulb and gas must come to the same temperature as the environment. This can take a long time, so it cannot measure rapidly changing temperatures well.
- Impractical apparatus: It involves a bulb, connecting tubes, a liquid column and a movable tube with a scale; it is typically large, fragile and needs careful alignment to keep the gas at constant volume.
Key Takeaways
- Needing thermal equilibrium usually implies slow response.
- Primary-standard thermometers are often bulky/fragile/awkward to use.
Common Mistakes
- Giving two versions of the same disadvantage (e.g. “slow” and “takes long time” counted as one).
- Giving vague answers like “human error” without linking to a specific feature (alignment, reading , etc.).
Things to Be Careful About
- Make the disadvantages clearly different.
- Tie at least one disadvantage explicitly to the need for thermal equilibrium (response time).
Suggest one situation in which a constant volume gas thermometer would be an appropriate type of thermometer to choose for measuring temperature.
Answer
As a standard/reference thermometer in a laboratory to determine thermodynamic temperature (e.g. for calibrating other thermometers).
Used as a laboratory reference/standard to calibrate other thermometers (thermodynamic temperature).
Background Concept
A constant-volume gas thermometer is closely linked to the thermodynamic (kelvin) temperature scale because for a dilute gas at constant volume,
This makes it suitable as a reference instrument.
Understanding the Question
You need to suggest one situation where this thermometer is appropriate. Because it is accurate but impractical, it is mainly used where accuracy matters more than convenience.
Approach
Pick a context like a standards lab or calibration procedure, where slow, careful measurements are acceptable.
Step-by-Step Reasoning
- In calibration work, you can wait for equilibrium and set up the apparatus carefully.
- The aim is to obtain an accurate thermodynamic temperature to compare other thermometers against.
Key Takeaways
- Appropriate use: reference/standard measurements rather than everyday temperature taking.
Common Mistakes
- Suggesting a situation needing fast response (e.g. monitoring a rapidly changing engine temperature).
- Suggesting medical use (too slow, bulky, and not hygienic/practical).
Things to Be Careful About
- The situation must plausibly allow a large, delicate apparatus and long equilibration times.
Level X aligns with on the scale. At , level Y aligns with .
At temperature , level Y aligns with on the scale.
Determine a value for in .
= ______
Working
At :
At temperature :
With :
Answer
-37 °C
Background Concept
For a constant-volume gas thermometer, the gas pressure is proportional to the thermodynamic temperature:
The manometer gives a pressure difference proportional to the height difference of the liquid columns:
Combining these proportionalities (with the same gas and fixed volume) gives:
Thermodynamic temperature is in kelvin, related to Celsius temperature by:
Understanding the Question
You are given scale readings for level and level .
- is fixed at .
- At , is at .
- At temperature , is at .
The measurable quantity linked to pressure (and hence to ) is the height difference:
You must find .
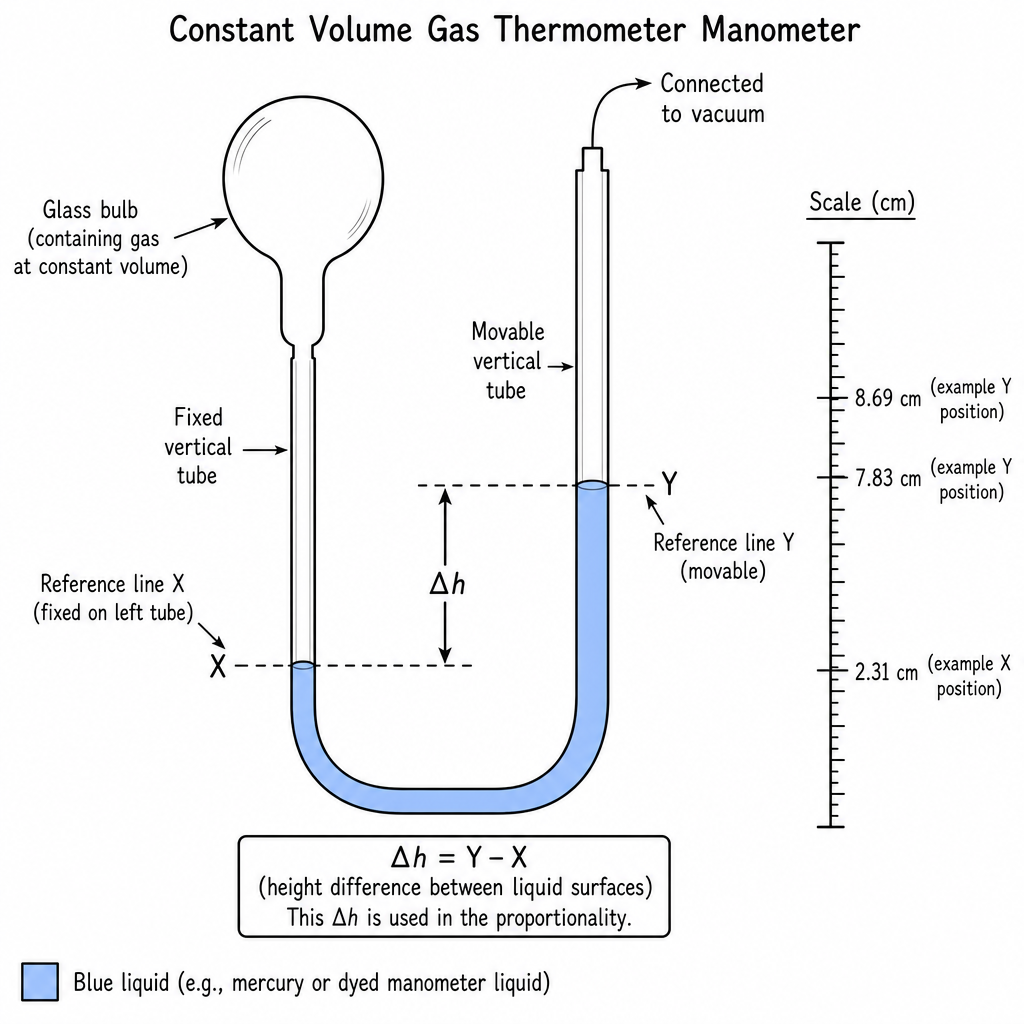
Approach
- Calculate at and at temperature .
- Use the proportionality to form a ratio:
- Convert (kelvin) to (Celsius) using .
Step-by-Step Reasoning
- Height differences:
- Use .
At , . Hence
- Convert to Celsius:
Key Takeaways
- For a constant-volume gas thermometer, and , so .
- Use kelvin in proportionality relations and only convert to Celsius at the end.
Common Mistakes
- Using directly in the ratio (e.g. is meaningless); you must use kelvin temperatures.
- Forgetting to subtract from to get .
- Mixing units or incorrectly adding/subtracting 273.
Things to Be Careful About
- The proportionality is for absolute temperature: always use in kelvin.
- Ensure is the difference between the two levels, not one reading alone.
- Keep sensible significant figures (final to about 2–3 s.f. is appropriate here).
A cylinder contains a fixed mass of an ideal gas at pressure and volume .
The gas undergoes a sequence of changes from its initial state A, through states B, C and D, then finally back to its initial state A, as shown in Fig. 4.1.
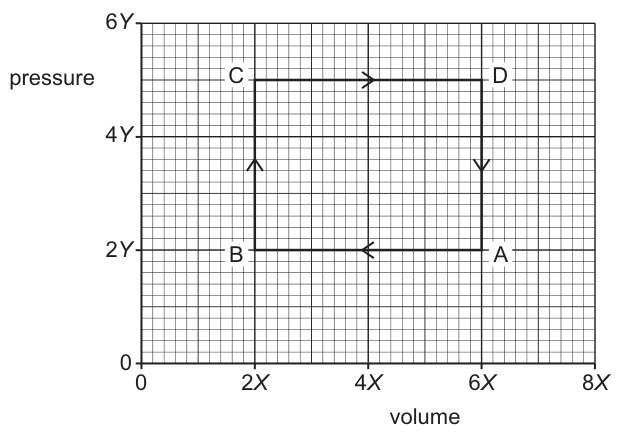
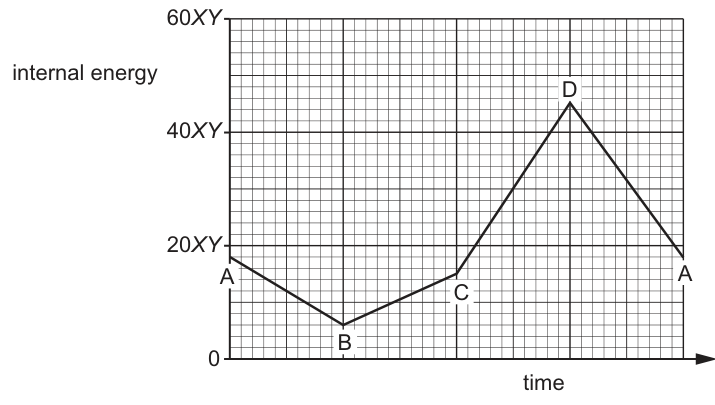
Fig. 4.2 shows the variation with time of the internal energy of the gas.
Answer
The first law is
where is the change in internal energy, is thermal energy supplied to the gas and is the work done on the gas.
Background Concept
The first law of thermodynamics is an energy conservation statement for thermodynamic systems. It links:
- : change in internal energy (energy in microscopic random motion / molecular interactions),
- : thermal energy transferred to the system (positive when supplied to the gas),
- : work (mechanical energy transfer).
A common Cambridge convention is
where is work done on the gas. (If instead you use work done by the gas, the equation becomes .)
Understanding the Question
You are asked to state the first law, so you must write the correct equation and explain what the symbols mean, including the sign convention.
Approach
Write the standard form of the first law used in this question (work done on the gas) and define the symbols.
Step-by-Step Reasoning
- Energy conservation for a thermodynamic change gives a relationship between internal energy, heating, and work.
- Using the sign convention suitable for later parts (they ask for “work done on the gas”), we write
- State meanings: means heat supplied to the gas; means work done on the gas (e.g. compression).
Key Takeaways
- Know the first law and be consistent with the sign convention.
- For compression, work done on the gas is positive.
Common Mistakes
- Writing while still calling “work done on the gas” (sign inconsistency).
- Not defining the symbols, losing explanation marks.
Things to Be Careful About
- Always check whether the question uses “work done on” or “work done by” the gas.
- In a cycle, total over one complete loop is zero because the gas returns to its initial state.
Use Fig. 4.1 and Fig. 4.2 to determine the general expression for the internal energy of the gas when it has pressure and volume .
= ______
Working
From state A: and .
(Also consistent with B, C and D.) Hence
Answer
Background Concept
For an ideal gas, internal energy depends only on temperature. If the gas is monatomic, kinetic theory gives , and since , this implies . In this question you are not told that directly; you are expected to deduce a relationship using the given state values.
Understanding the Question
You are given a rectangular cycle on a – diagram (Fig. 4.1) and a graph of internal energy against time showing the values of at states A, B, C, D (Fig. 4.2).
You must find a general expression for when the gas has arbitrary pressure and volume .
Approach
Pick one state (A is easiest), calculate from Fig. 4.1, read from Fig. 4.2, and see what constant relates them. Then check it matches another state to confirm the general rule.
Step-by-Step Reasoning
- Read state A from Fig. 4.1: , .
- Compute
- Read from Fig. 4.2 that at A,
- Compare with :
- Check quickly with another point (e.g. D): and , again ratio . So the relationship is consistent.
- Therefore the general expression is
Key Takeaways
- Use state-point data to infer a proportionality and a constant.
- Checking a second point is a good way to confirm the deduced law.
Common Mistakes
- Using between two states instead of the actual value of at a state.
- Mixing up coordinates (reading from the pressure axis or vice versa).
- Concluding (forgetting to compute the ratio).
Things to Be Careful About
- Keep track of the units: has units of energy, so comparing to is sensible.
- The expression must be in terms of general and , not in terms of and only.
An ideal gas at thermodynamic temperature contains molecules.
Use your answer in (b)(i) and the equation of state for an ideal gas to deduce an expression for in terms of and . Identify any other symbols you use.
= ______
Working
From (b)(i),
For an ideal gas,
So
Answer
where is the Boltzmann constant.
Background Concept
The ideal gas equation of state can be written in microscopic form as
where:
- is the number of molecules,
- is the Boltzmann constant (),
- is thermodynamic temperature in kelvin.
If you already have an expression for in terms of , you can immediately convert it into an expression in terms of and by substituting .
Understanding the Question
You must use your result from (b)(i), , and the ideal gas equation to express internal energy purely in terms of and (and any constants such as ), and you must say what the extra symbol means.
Approach
Start from and replace using .
Step-by-Step Reasoning
- Write the deduced internal-energy relationship:
- Use the ideal gas law in molecular form:
- Substitute into the first equation:
- Identify as the Boltzmann constant.
Key Takeaways
- is a bridge between macroscopic variables () and microscopic variables ().
- Substitution is often all that is needed once the correct proportionality is known.
Common Mistakes
- Using but then leaving the answer in terms of and (the question asked for and ).
- Forgetting to identify what is.
Things to Be Careful About
- must be in kelvin.
- Do not confuse (number of molecules) with (number of moles).
Determine expressions, in terms of and , for the work done on the gas during:
Working
For AB, and .
Work done by gas:
So work done on gas:
Answer
Background Concept
On a pressure–volume diagram, the work done by a gas during a change is
For a constant-pressure (isobaric) change, this becomes
If you want the work done on the gas, then
Compression means , so is negative and is positive.
Understanding the Question
Change AB is a horizontal line at pressure from volume to (compression). You must find the work done on the gas in terms of and .
Approach
Use for constant pressure, then change sign to get work on the gas.
Step-by-Step Reasoning
- Read from the – graph for AB:
- (constant),
- changes from to .
- Compute the volume change:
- Work done by the gas:
- Work done on the gas is the negative:
Key Takeaways
- For horizontal lines on a – graph, work is .
- Compression gives positive work done on the gas.
Common Mistakes
- Giving without converting from “by” to “on”.
- Using (wrong order) after defining .
Things to Be Careful About
- Always state clearly whether your is “on” or “by” the gas.
- Isochoric (vertical) segments have so zero work (useful later).
Working
For CD, and .
Work done by gas:
So work done on gas:
Answer
Background Concept
For an isobaric expansion/compression, work done by the gas is . For an expansion, so .
Work done on the gas is the negative of this.
Understanding the Question
Change CD is a horizontal line at pressure from volume to (expansion). Find the work done on the gas.
Approach
Compute , calculate , then change sign to get work on the gas.
Step-by-Step Reasoning
- Read from the diagram for CD:
- ,
- changes from to .
- Compute
- Work done by the gas:
- Therefore work done on the gas:
Key Takeaways
- Expansion: the gas does positive work; work done on the gas is negative.
- Horizontal line at higher pressure gives a larger magnitude of work.
Common Mistakes
- Forgetting the negative sign for “work done on the gas”.
- Using the wrong pressure (e.g. instead of ).
Things to Be Careful About
- Keep the sign convention consistent with the first law you stated in (a).
Use your answers in (c) and the first law of thermodynamics to determine an expression, in terms of and , for the net thermal energy supplied to the gas during one full cycle ABCDA. Explain your reasoning.
= ______
Working
Over one full cycle, .
Work done on gas occurs only on AB and CD (BC and DA have ):
First law: :
Answer
Background Concept
For any process,
For a complete cycle, the system returns to its initial state, so internal energy (a state function) returns to its initial value:
Therefore, over a full cycle,
Also, on a – diagram, net work done by the gas in a cycle equals the area enclosed (with sign depending on direction). For clockwise cycles, the gas does positive net work; anticlockwise, negative.
Understanding the Question
You already found the work done on the gas during AB and CD. You must use these and the first law to find the net thermal energy supplied to the gas over the full loop A(\to)B(\to)C(\to)D(\to)A.
Key points from Fig. 4.1:
- AB and CD are horizontal (constant pressure), so work is non-zero.
- BC and DA are vertical (constant volume), so and work is zero.
Key point from the fact it’s a cycle:
- The gas ends where it started, so net .
Approach
- Add the work done on the gas for each segment to get (noting isochoric segments have zero work).
- Use in to find .
Step-by-Step Reasoning
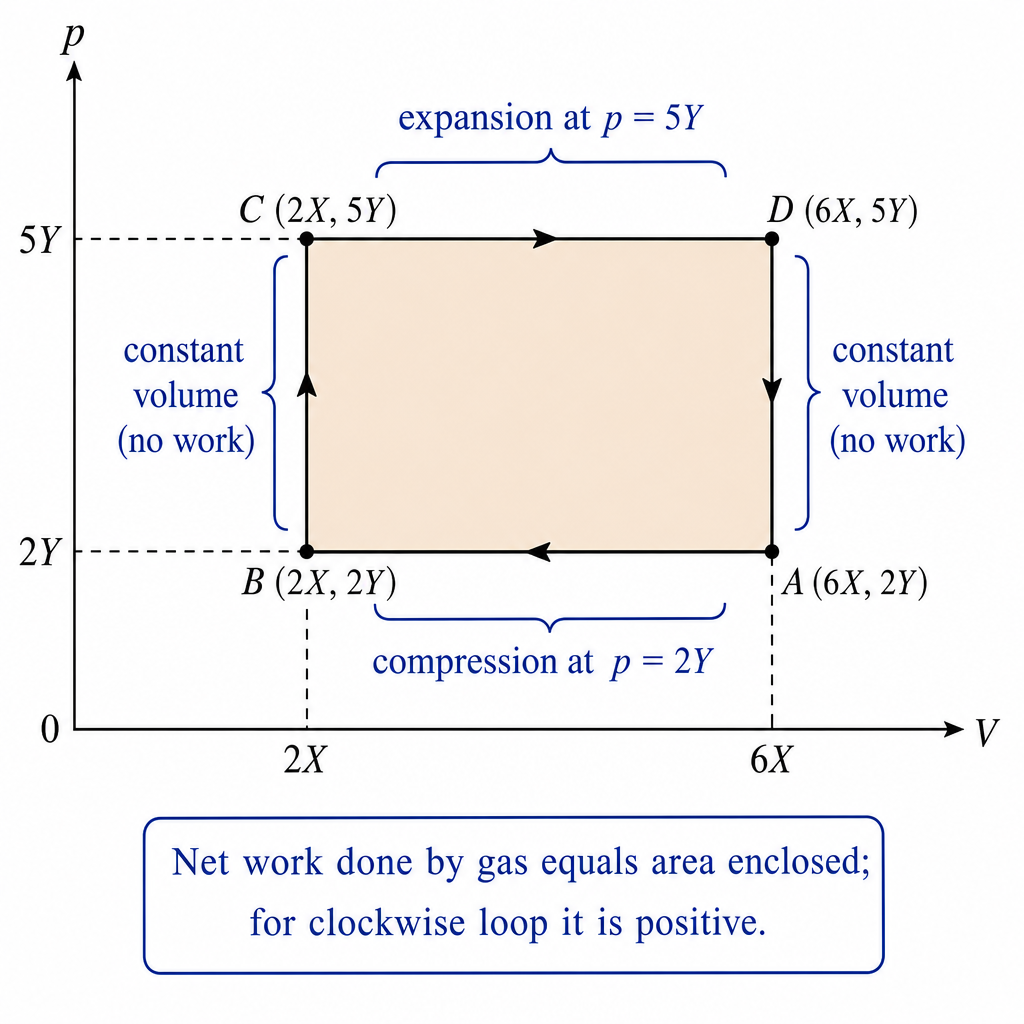
- Identify segments with work:
- AB: compression at (non-zero work).
- BC: constant volume (zero work).
- CD: expansion at (non-zero work).
- DA: constant volume (zero work).
- Use results from (c):
- Net work done on the gas:
The negative sign means that overall the gas did net work on the surroundings (since work on gas is negative).
- Over a cycle, internal energy returns to initial value:
- Apply the first law over the cycle:
So
This positive value means net thermal energy is supplied to the gas during the cycle.
(Consistent check: the cycle is clockwise on the – diagram, so net work done by the gas is positive and hence net heat input must be positive.)
Key Takeaways
- In a complete cycle, .
- Isochoric processes do no work.
- Net heat supplied equals net work done by the gas (or negative of net work done on the gas), for a cycle.
Common Mistakes
- Forgetting that BC and DA have zero work and trying to include there.
- Using values from the internal energy graph and adding them incorrectly; the simplest is to use .
- Sign errors: mixing “work on” and “work by” without changing sign in the first law.
Things to Be Careful About
- State clearly that because the gas returns to state A.
- Keep consistent with the version of the first law you wrote in (a).
- When adding work values, include their signs (compression vs expansion).
A steel ball on the end of a thin string oscillates with small oscillations, as shown in Fig. 5.1.
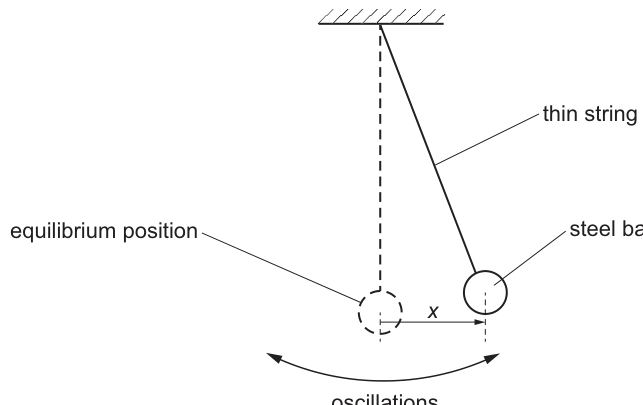
The displacement of the centre of the ball from its equilibrium position is .
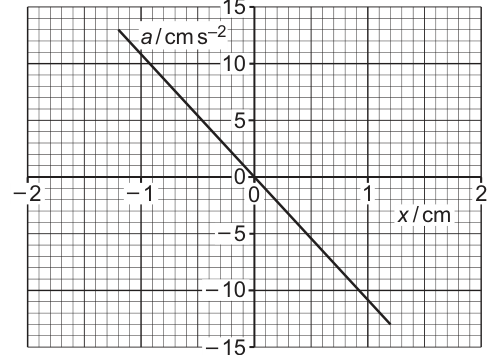
Fig. 5.2 shows the variation with of the acceleration of the ball.
Answer
For SHM,
Fig. 5.2 is a straight line through the origin with a negative gradient, so is proportional to and always opposite in direction to ; hence the motion is simple harmonic.
The a–x graph is a straight line through the origin with negative gradient, so a is proportional to −x (a = −ω²x), hence SHM.
Background Concept
Simple harmonic motion (SHM) is defined by the condition that the acceleration of the oscillating object is directly proportional to its displacement from equilibrium and is directed towards the equilibrium position.
Mathematically,
where:
- is the displacement from equilibrium,
- is the acceleration,
- is the angular frequency,
- the negative sign means the acceleration is always opposite to the displacement (a restoring acceleration).
Understanding the Question
You are given a graph of acceleration against displacement for the ball as it oscillates.
The question asks how this graph demonstrates that the motion is SHM. So you must connect features of the graph (straight line, passes through origin, negative gradient) to the defining equation for SHM.
Approach
- Recall the defining relation for SHM: .
- Compare this with what the graph shows:
- straight line through origin means ,
- negative gradient means has the opposite sign to (restoring).
- State clearly that these two observations together satisfy the SHM condition.
Step-by-Step Reasoning
- A straight line graph of against passing through shows that when , , and that is proportional to :
- The line slopes downwards (negative gradient). This means:
- if is positive, then is negative,
- if is negative, then is positive.
So the acceleration always points back towards equilibrium (opposite to the displacement).
- That is exactly the SHM condition:
Therefore the oscillations are simple harmonic.
Key Takeaways
- SHM is identified by the single condition .
- On an vs graph, SHM appears as a straight line through the origin with negative gradient.
Common Mistakes
- Saying only “it is a straight line” without mentioning that it passes through the origin and has negative gradient.
- Forgetting to interpret the negative gradient physically (restoring acceleration).
- Confusing vs graphs (which are sinusoidal) with vs graphs (which are linear for SHM).
Things to Be Careful About
- You must mention both proportionality (straight line through origin) and opposite direction (negative gradient). Either point on its own is not sufficient to establish SHM.
Working
Gradient of - graph:
For SHM, , so
Answer
2.22 s
Background Concept
In SHM, the acceleration is related to displacement by
If you plot against , this has the same form as a straight-line equation , where the gradient is
Once is known, the period is found from
Understanding the Question
You are given two points on the straight-line graph of acceleration (in ) against displacement (in cm).
You must:
- Find the gradient of this line.
- Use the SHM relationship to extract .
- Convert into the period .
Because both axes are in cm-based units, the gradient ends up in (since divided by cm leaves ). This is exactly the unit expected for .
Approach
- Use two clear points on the line to compute the gradient .
- Identify gradient with from .
- Take the square root to find .
- Use .
Step-by-Step Reasoning
-
Choose the two points shown: and .
-
Compute the gradient:
- Compare with SHM form:
So the gradient is , hence
- Convert angular frequency to period:
Key Takeaways
- For SHM, the gradient of an vs graph equals .
- Period is obtained from .
- Unit checking helps: gradient units become , matching .
Common Mistakes
- Using instead of .
- Forgetting the minus sign and writing .
- Forgetting to take the square root when going from to .
- Writing instead of .
Things to Be Careful About
- Use points that lie exactly on the line to reduce reading error.
- Keep enough significant figures during working; round at the end.
- The period is in seconds; is in (radian is dimensionless but should be written).
At time , when the displacement of the ball has its maximum value, the ball is immersed in a trough containing thick oil so that the ball is just below the surface of the oil. This results in the subsequent motion of the ball being heavily damped.
Answer
Damping is the loss of energy from an oscillating system (due to resistive forces), causing the amplitude of the oscillations to decrease with time.
Loss of energy from an oscillator due to resistive forces, causing its amplitude to decrease with time.
Background Concept
Real oscillators experience resistive forces (e.g. friction, air resistance, viscous drag). These forces do work against the motion, transferring mechanical energy (kinetic + potential) out of the oscillating system, usually as thermal energy in the surroundings.
This process is called damping. A key observable consequence is that the amplitude decreases with time.
Understanding the Question
The ball is placed just below the surface of thick oil, which provides a large viscous resistive force. The question asks for the meaning of “damping” in oscillations.
For full credit you need to mention both:
- energy loss (or resistive force doing work), and
- reduction of amplitude with time.
Approach
State damping as an energy-transfer process, then link it to the observable decay in amplitude.
Step-by-Step Reasoning
- As the ball moves through a fluid, a resistive (drag) force acts opposite to the velocity.
- This force does negative work on the system over each cycle, so mechanical energy decreases.
- With less mechanical energy, the maximum displacement (amplitude) becomes smaller each cycle.
Thus damping is the loss of energy from the oscillating system due to resistive forces, leading to a decrease in amplitude with time.
Key Takeaways
- Damping = energy removed from an oscillator by resistive forces.
- The experimental sign of damping is a decreasing amplitude.
Common Mistakes
- Saying “damping is friction” without stating energy loss or amplitude reduction.
- Confusing damping with “frequency decreasing”; damping mainly affects amplitude (frequency may change slightly, but that is not the definition).
Things to Be Careful About
- Use clear cause-and-effect wording: resistive forces → energy loss → amplitude decreases.
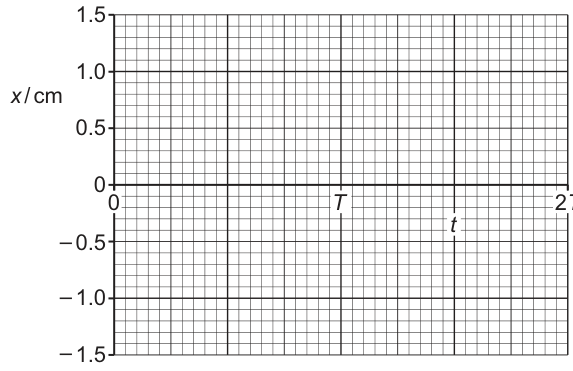
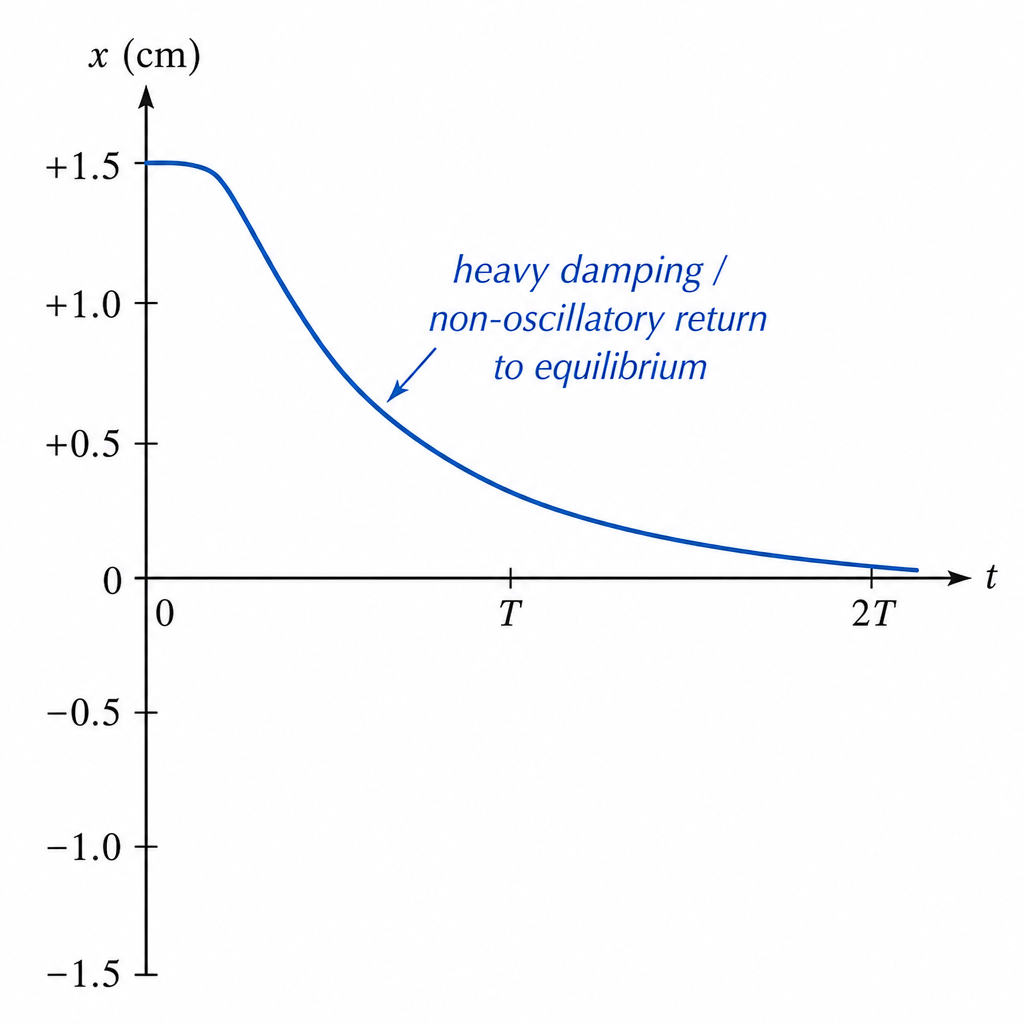
On Fig. 5.3, sketch a possible variation of the displacement of the ball with between and .
Answer
Sketch starts at at with zero gradient, then decreases towards without oscillating (does not cross ), approaching by .
See sketch (heavily damped: returns to equilibrium without oscillating).
Background Concept
Damping describes energy loss from an oscillator due to resistive forces. The nature of the motion depends on the strength of damping:
- Light damping (underdamped): oscillations continue but amplitude decays.
- Critical damping: fastest return to equilibrium without oscillating.
- Heavy damping (overdamped): returns to equilibrium without oscillating, but more slowly than critical damping.
In heavy damping there are no repeated crossings of the equilibrium position; instead, displacement decays back to zero in a non-oscillatory way.
Understanding the Question
At , the ball is at maximum displacement, so its instantaneous velocity is zero. Then it is immersed in thick oil, making the subsequent motion heavily damped.
You must sketch against from to (where is the undamped SHM period found earlier), showing the qualitative effect of heavy damping.
Key required features:
- starts at maximum positive displacement at ,
- initial slope ,
- no oscillations (no repeated maxima/minima, no crossing of ),
- tends towards as time increases.
Approach
- Place the starting point at at the top of the displacement scale.
- Because it is a maximum, draw a horizontal tangent at the start.
- For heavy damping, sketch a monotonic decay towards equilibrium (often drawn as an exponential-like curve), ensuring it does not overshoot through .
Step-by-Step Reasoning
-
Initial condition at : maximum displacement means .
-
Slope at : at a maximum in a displacement-time graph, the velocity is zero, so the tangent is horizontal.
-
Effect of thick oil: viscous drag is large, so mechanical energy is removed rapidly. In the heavy-damping case, the system does not have enough “inertia” relative to the damping to pass through equilibrium and continue to the other side.
-
Shape of curve: the displacement returns towards zero without oscillations. The curve approaches with the slope tending to zero as it reaches equilibrium.
Key Takeaways
- Heavy damping gives a non-oscillatory return to equilibrium.
- “Maximum displacement at ” implies a horizontal tangent at the start of the sketch.
Common Mistakes
- Drawing a sinusoidal curve with decreasing amplitude (that is light damping / underdamped motion, not heavy damping).
- Starting at instead of at maximum displacement.
- Drawing the curve crossing and oscillating about equilibrium.
- Forgetting the horizontal tangent at .
Things to Be Careful About
- The axis is labelled up to ; you are not required to show a period in the damped motion. is just a time scale on the axis.
- “Heavily damped” in this syllabus typically means no oscillations (overdamped), not merely “quickly decreasing amplitude.”
Answer
Electric field (strength) at a point is the force per unit positive test charge placed at that point (in the direction of the force on a positive charge).
Force per unit positive test charge at the point (direction is that of the force on a positive charge).
Background Concept
The electric field (often meaning electric field strength) is a way to describe how a charge would experience a force in a region of space.
It is defined by
where:
- is electric field strength,
- is the electrostatic force on a charge,
- is the charge.
The direction of is defined as the direction of the force on a small positive test charge.
Understanding the Question
You are asked to define the electric field at a point. A “point” definition means you should not talk about a whole region or about field lines; you should give the standard definition relating field to force and charge.
Approach
State the standard definition: electric field strength equals force per unit positive charge, and include the direction statement.
Step-by-Step Reasoning
- Take the defining equation .
- Convert it into words: “force per unit charge”.
- Add the conventional direction: use a positive test charge to define the direction.
Key Takeaways
- Electric field strength is defined locally (at a point).
- relates force to charge: .
- Direction is that of the force on a positive test charge.
Common Mistakes
- Saying “force per unit charge” but not specifying that it is for a positive test charge (direction can become ambiguous).
- Confusing electric field with electric potential (potential is energy per unit charge).
Things to Be Careful About
- Use the wording “at a point” (local definition).
- Make clear it is per unit charge (not per unit mass — that is gravitational field strength).
An isolated conducting sphere in a vacuum has a capacitance of . The charge on the sphere is .
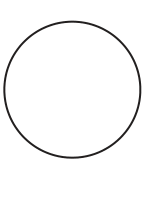
On Fig. 6.1, draw field lines to represent the electric field outside the sphere due to the charge on the sphere.
Answer
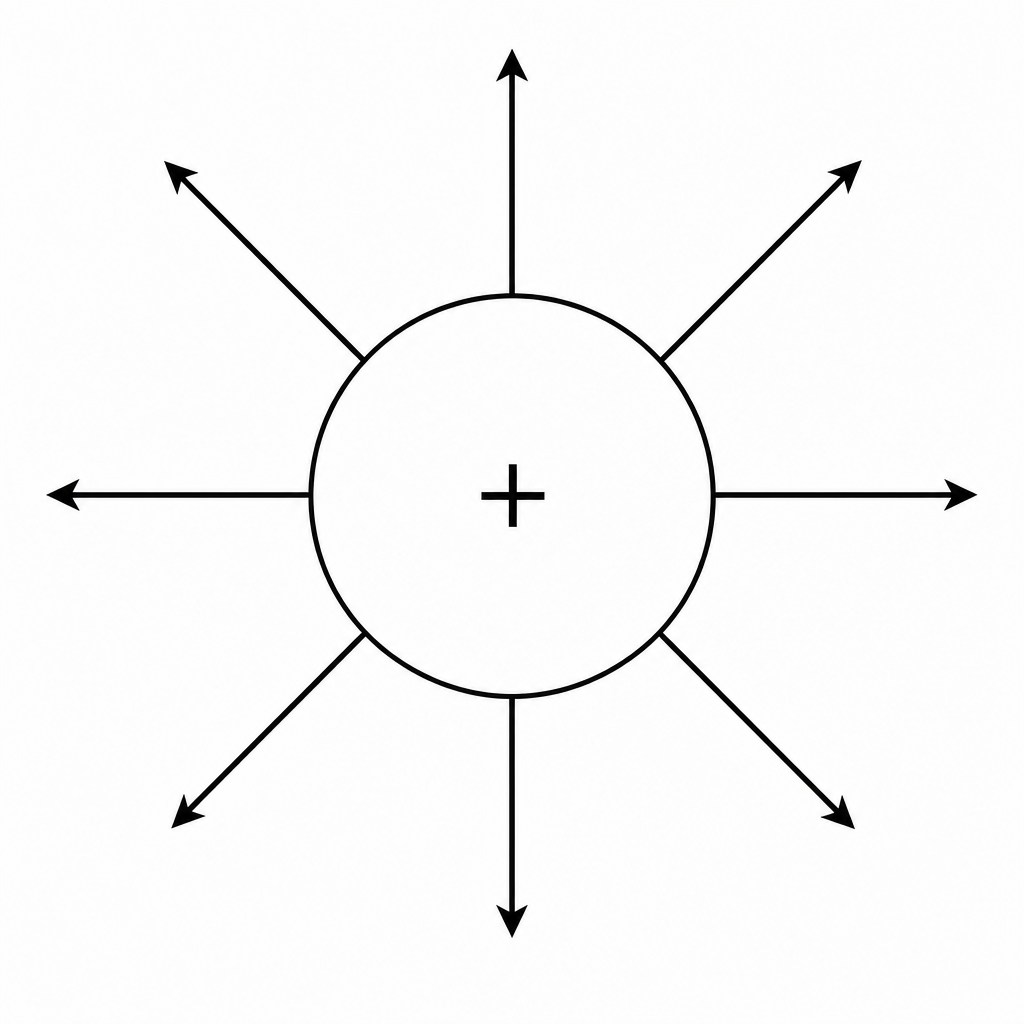
Field lines are radial, perpendicular to the surface, with arrows pointing away from the positively charged sphere (symmetrically spaced).
Radial lines, perpendicular to the surface, arrows outwards from the + sphere.
Background Concept
Electric field lines are a diagrammatic way to show the direction and relative strength of an electric field:
- The direction of the field at a point is tangent to the field line (arrow direction is the force direction on a positive test charge).
- The field is stronger where the field lines are closer together.
For a conducting sphere in electrostatic equilibrium:
- All excess charge resides on the surface.
- The field inside the conductor is zero.
- The field just outside the surface is perpendicular (normal) to the surface.
Understanding the Question
You have a positively charged isolated conducting sphere in a vacuum. You must sketch the electric field outside it using field lines on the given diagram.
Approach
Use the known field pattern for a positively charged sphere:
- Draw several straight lines radiating out from the sphere.
- Ensure lines meet the surface at right angles.
- Put arrowheads pointing away from the sphere.
- Make the pattern symmetric (uniformly spaced around the sphere).
Step-by-Step Reasoning
- Because the sphere is positively charged, a positive test charge would be repelled, so arrows point outwards.
- A sphere has spherical symmetry, so the field magnitude depends only on distance from the centre, giving a radial pattern.
- A conductor’s surface is an equipotential, so field lines must be perpendicular to it.
Key Takeaways
- Positive charges have field lines pointing away; negative charges have field lines pointing toward.
- For a conducting sphere, field lines are radial and normal to the surface.
Common Mistakes
- Drawing circular lines around the sphere (that would be more like magnetic field lines).
- Forgetting arrowheads.
- Drawing lines that are not perpendicular to the conducting surface.
- Drawing lines inside the conducting sphere (field inside is zero).
Things to Be Careful About
- Keep the line pattern symmetric.
- Field lines should not cross.
- If you vary density, it should be denser near the surface and spread out with distance.
Working
Answer
1.2 V
Background Concept
Capacitance relates the charge stored to the potential difference :
So
For an isolated charged conductor, the “potential at the surface” is the potential of the conductor relative to zero potential at infinity.
Understanding the Question
You are told:
- capacitance of the isolated sphere:
- charge on the sphere:
You must calculate the electric potential at the surface of the sphere.
Approach
Use the capacitance definition . Convert pC and pF into SI units, substitute, then quote the answer in volts.
Step-by-Step Reasoning
- Convert to SI:
- Use
- Substitute:
The factors cancel neatly, leaving a value close to .
Key Takeaways
- For any conductor/capacitor: .
- Always convert prefixes (pico ) before substituting.
Common Mistakes
- Forgetting to convert pF or pC to SI, leading to a factor-of- error.
- Writing instead of .
Things to Be Careful About
- Units: , so correctly gives volts.
- Significant figures: typically 2 s.f. is appropriate here (e.g. ).
Working
For an isolated sphere,
Answer
0.62 m
Background Concept
An isolated conducting sphere in a vacuum behaves like a capacitor whose other “plate” is effectively at infinity.
Its capacitance depends only on its radius :
where is the permittivity of free space.
Understanding the Question
You are given the sphere’s capacitance and asked to find its radius. No charge value is needed for this part because depends only on geometry for an isolated sphere.
Approach
Use and rearrange to . Substitute in farads and .
Step-by-Step Reasoning
- Start with
- Rearrange:
- Convert :
- Substitute:
The cancels, giving a value of order .
- Calculate to obtain
Key Takeaways
- For an isolated sphere, capacitance is proportional to radius: .
- The constant of proportionality is .
Common Mistakes
- Using the parallel-plate formula (not applicable here).
- Forgetting that has units of .
- Missing the factor of .
Things to Be Careful About
- Use SI units: in farads.
- Keep enough significant figures in intermediate steps; round only at the end.
Calculate the electric field strength at the surface of the sphere. Give a unit with your answer.
= ______ ______
Working
At the surface,
Answer
(or )
1.9 V m^-1
Background Concept
For a spherically symmetric charge distribution (such as a charged conducting sphere), the field outside is the same as if all the charge were concentrated at the centre.
So at distance from the centre,
The unit of can be written as (from ) or equivalently (from the potential gradient).
Understanding the Question
You have already found the radius of the sphere in part (iii), and you know the charge from the stem. You are asked for the electric field strength at the surface, i.e. at equal to the sphere’s radius.
Approach
Use the spherical-field formula with:
- ,
- ,
- .
Then state the answer with a correct unit.
Step-by-Step Reasoning
- Write the formula:
- Substitute values:
-
Note that cancels, so the field will be a few .
-
Calculate to get:
- Unit check: is acceptable, and is equivalent to .
Key Takeaways
- Outside a charged sphere: treat it like a point charge at the centre.
- Field at the surface uses equal to the sphere radius.
- Remember acceptable units: or .
Common Mistakes
- Using (missing the square).
- Using diameter instead of radius.
- Giving an incorrect unit (e.g. or ).
Things to Be Careful About
- Keep consistent SI units (metres, coulombs).
- Quote the final answer to 2 s.f. unless the question/data suggest otherwise.
The sphere in (b) is discharged by connecting it to earth () through a resistor of resistance .
Calculate the time taken for the charge to fall to .
= ______
Working
Time constant:
For discharge,
Answer
9.6 × 10^-3 s
Background Concept
When a capacitor discharges through a resistor, the charge on the capacitor decreases exponentially:
where:
- is the initial charge at ,
- is the resistance,
- is the capacitance,
- is the time constant.
After one time constant , the charge has fallen to .
Understanding the Question
You have the same sphere from part (b), so the capacitance is still . It is discharged to earth through a resistor .
The charge falls from to .
You must find the time for that change.
Approach
- Compute the time constant using SI units.
- Use the discharge equation .
- Rearrange for by taking natural logs.
Step-by-Step Reasoning
-
Convert units:
-
Time constant:
- Discharge law:
Divide by :
Take :
So
- Substitute and (the prefix cancels in the ratio):
Key Takeaways
- Capacitor discharge is exponential, characterised by .
- To find time for a given change in , rearrange using .
Common Mistakes
- Using base-10 log instead of natural log.
- Forgetting to convert and pF into SI units when calculating .
- Using (missing the logarithm).
Things to Be Careful About
- Use , not .
- The ratio is dimensionless, so you can use pC directly in that ratio, but must be in seconds using SI units.
An alternating voltage varies with time according to
where is in and is in .
Working
From , angular frequency .
Answer
0.050 s
Background Concept
A sinusoidal a.c. quantity can be written in the form
where:
- is the peak (maximum) value,
- is the angular frequency in ,
- is time.
The period is the time for one complete cycle. For sinusoidal motion,
Understanding the Question
You are given an a.c. voltage:
and asked to show that its period is . The key information is the coefficient of inside the cosine, which is .
Approach
- Read off from .
- Use .
Step-by-Step Reasoning
From
compare with to get
Then
Key Takeaways
- The angular frequency is the factor multiplying inside the sine/cosine.
- Period and angular frequency are linked by .
Common Mistakes
- Using instead of .
- Treating as the frequency in Hz (it is angular frequency in ).
Things to Be Careful About
- Always include when converting between and .
- Quote with unit seconds and appropriate significant figures.
Working
Peak voltage .
Answer
13 V
Background Concept
The root-mean-square (r.m.s.) value of an alternating voltage is the d.c. voltage that would produce the same mean power in a resistor as the a.c. voltage.
For a sinusoidal voltage
the r.m.s. value is
This result comes from averaging over a full cycle (since power in a resistor depends on ).
Understanding the Question
The given wave is
So the peak voltage (maximum magnitude) is the amplitude, . The question asks for the r.m.s. voltage.
Approach
- Identify from the coefficient in front of the cosine.
- Apply .
Step-by-Step Reasoning
From :
Then
Key Takeaways
- For a sine/cosine wave: .
- is simply the amplitude of the voltage-time equation.
Common Mistakes
- Using (inverted).
- Confusing peak-to-peak voltage () with peak voltage ().
Things to Be Careful About
- Significant figures: is 2 s.f., so should be given to 2 s.f. (about ).
- Include the unit V.
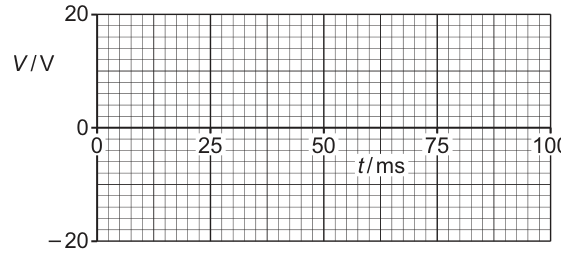
Working
Amplitude and .
Key points:
- :
- :
- :
- :
- :
Repeat for to .
Answer
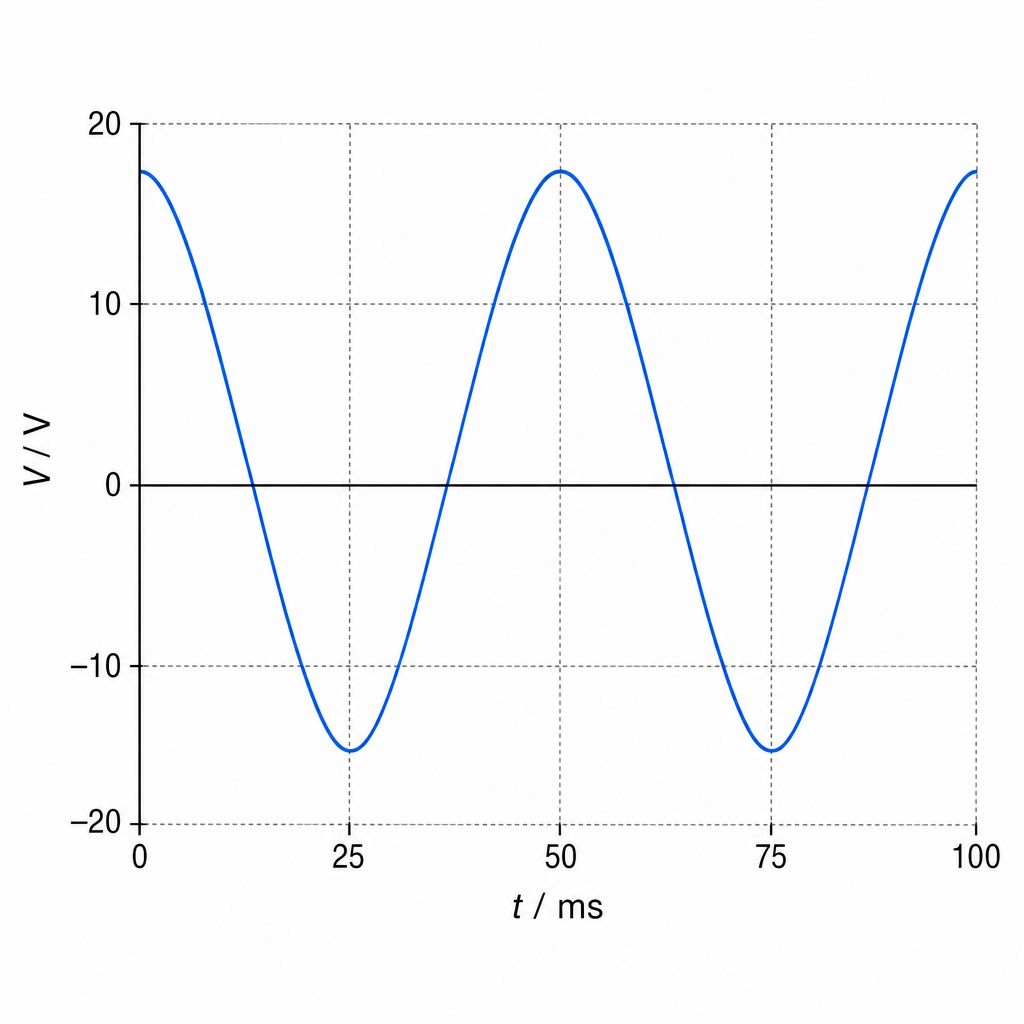
Sketch a cosine wave of peak completing two cycles between and , starting at at .
Two-cycle cosine wave, peak ±18 V, period 50 ms, starting at +18 V at t = 0.
Background Concept
A cosine waveform
has these useful features:
- Peak value: (at if there is no phase shift).
- Period: .
- Over one cycle starting at :
- at : so ,
- at : so ,
- at : so ,
- at : ,
- at : back to .
Understanding the Question
You need to sketch from to for
This is a cosine wave of amplitude with period , so between and there are exactly two full cycles.
Approach
- Convert the period into ms to match the axis.
- Mark the standard cosine key points every .
- Draw a smooth sinusoidal curve through these points, repeating after each period.
Step-by-Step Reasoning
- Peak (amplitude): the coefficient of the cosine is , so the graph reaches and .
- Period: .
- Quarter period:
So the key points in the first cycle are:
- :
- :
- :
- :
- :
Then the same pattern repeats from to .
Key Takeaways
- Read directly as the amplitude.
- Use spacing to place zeros and peaks accurately.
- A cosine with no phase shift starts at its maximum.
Common Mistakes
- Drawing a sine wave starting at instead of a cosine starting at .
- Using the wrong period (e.g. instead of ).
- Forgetting the negative half-cycle (must go down to ).
Things to Be Careful About
- The time axis is in ms: ensure consistent units when locating , , etc.
- The sketch should be smooth and periodic, not triangular or piecewise straight lines.
- Ensure the peaks align at for a cosine wave here.
The alternating voltage is rectified to produce an output voltage across a load resistor R, as shown in Fig. 7.2.
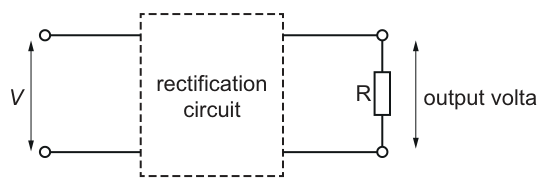
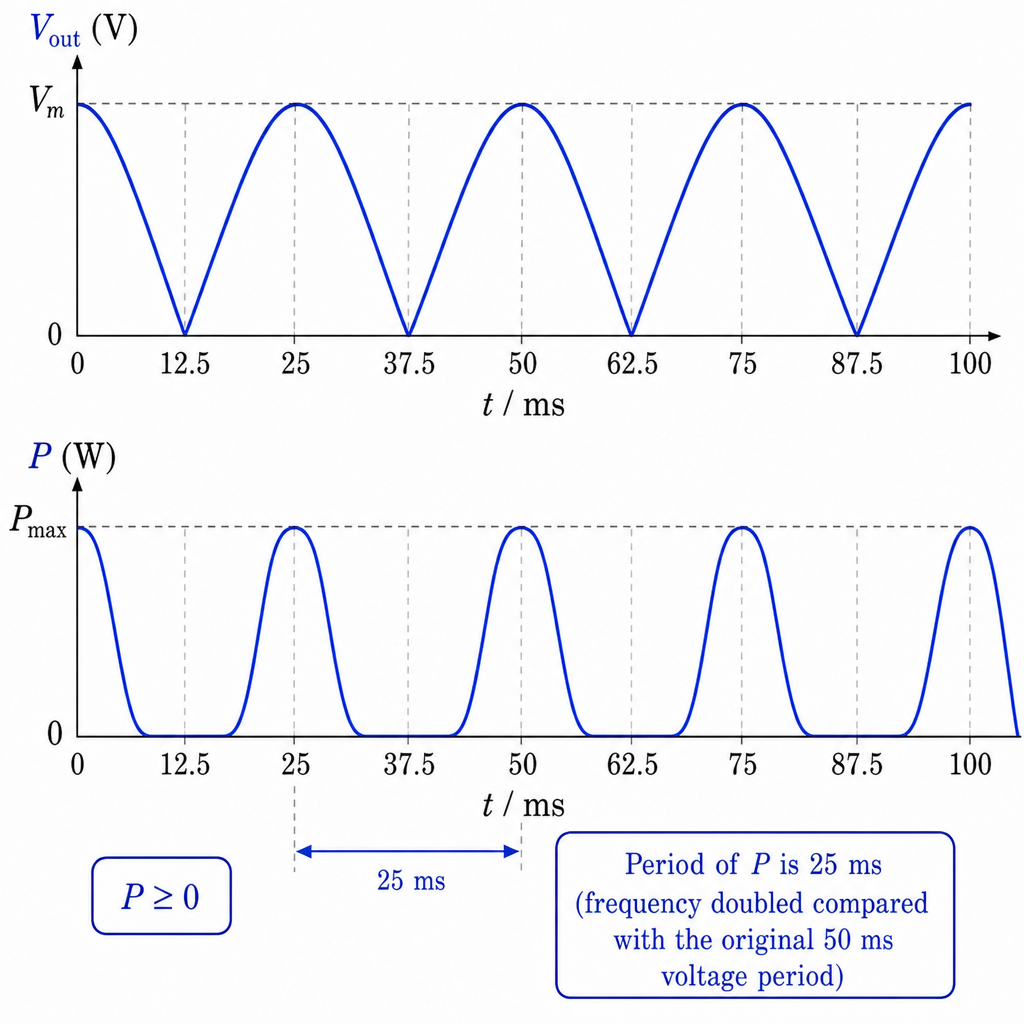
Fig. 7.3 shows the variation with of the power in the load resistor.
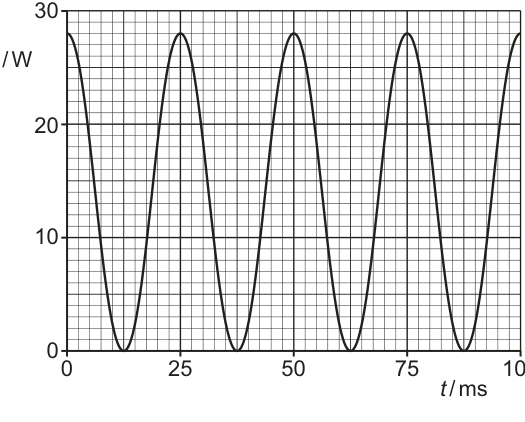
State three conclusions that can be drawn from Fig. 7.3. The conclusions may be qualitative or quantitative. Use the space for any working.
Answer
From Fig. 7.3:
- is always (never negative).
- The pulses repeat every (so power frequency , i.e. twice the a.c. frequency).
- The maximum power is about (so if across , then ).
P is always non-negative; pulses every 25 ms (40 Hz, double input); peak power ≈ 27 W (so R ≈ 12 Ω if Vpeak = 18 V).
Background Concept
For a resistor , instantaneous electrical power is
Key consequences:
- Power in a resistor is never negative because .
- If a voltage is rectified (made all one polarity), the voltage waveform changes, and because , the power waveform often has a different period from the original voltage.
Rectification:
- Half-wave rectification produces one output pulse per input cycle.
- Full-wave rectification produces two output pulses per input cycle, so the output (and power) repeats twice as often.
Understanding the Question
You are shown a graph (Fig. 7.3) of the power in a load resistor after an a.c. voltage has been rectified.
You must state three conclusions from the graph. Valid conclusions include observations about:
- sign of ,
- period / frequency of the pulses,
- maximum value (and hence possible deductions about if peak voltage is known).
Approach
Read three distinct features directly from the graph:
- whether the graph goes negative,
- the time between repeating pulses (period of ),
- the peak value of .
Optionally, combine peak power with to estimate if the peak voltage is known/assumed unchanged by the rectifier.
Step-by-Step Reasoning
-
Sign of power: The curve lies on/above the time axis only, so always. This is consistent with a resistor and with rectification (no negative power shown).
-
Period of the power waveform: The pulses repeat at intervals of about . Therefore
The original a.c. had (), so the power repeats twice as often, indicating two similar power pulses per input cycle. This is what you expect from full-wave rectification (or any process that makes the output depend on or ).
- Peak power: From the vertical axis, the maximum is about .
If the peak output voltage across the resistor is (ideal rectifier, ignoring any diode voltage drops), then
Key Takeaways
- In a resistor, , so power is always non-negative.
- Rectification can change the frequency of the output waveform; full-wave rectification produces pulses at twice the original frequency.
- Peak power values can be used with to estimate resistance (given the peak voltage across the load).
Common Mistakes
- Saying power is alternating (it is not negative here).
- Using the original period () instead of the observed power period ().
- Mixing up peak and r.m.s. values when using .
Things to Be Careful About
- The graph is of power, not voltage: the period you read is , which may differ from the voltage period.
- If real diodes are involved, the peak voltage across could be slightly less than ; the resistance calculation assumes ideal rectification unless stated otherwise.
- Make sure your three conclusions are distinct (e.g. don’t give three different ways of stating the same period/frequency fact).
Fig. 8.1 shows the three lowest-frequency lines in the part of the emission spectrum for hydrogen that relates to electron transitions to the ground state (level ).

The numbers represent the frequencies, in , associated with the spectral lines.
Use the photon model of electromagnetic radiation to explain how the existence of spectral lines in the emission spectrum provides evidence for discrete electron energy levels in the hydrogen atom.
Answer
In the photon model, electromagnetic radiation is emitted as photons with energy
An emitted photon is produced when an electron drops from a higher level to a lower level, so
Because the spectrum contains only certain (discrete) frequencies, only certain values of occur, so the electron energies must be in discrete levels (not a continuum).
Discrete spectral lines imply only certain photon energies (E = hf), so only certain energy differences occur and hence electron energy levels are discrete.
Background Concept
In the photon model, electromagnetic radiation is quantised into photons. Each photon has energy
where is Planck’s constant and is the frequency.
In an atom, an electron can move between allowed energy levels. If it moves from a higher energy level to a lower one, it emits a photon. Conservation of energy gives
So each possible electron transition produces a photon whose energy (and hence frequency) is fixed.
Understanding the Question
The figure shows an emission spectrum of hydrogen for transitions ending at the ground state (a series of lines). You are asked to use the photon model to explain why seeing separate lines (rather than a continuous band) is evidence that electron energies in hydrogen are discrete.
Approach
Connect three ideas in a short chain:
- Emission occurs as photons with .
- A photon’s energy equals the difference between two electron energy levels, .
- Only certain frequencies are present (lines), so only certain photon energies and hence only certain energy differences occur, implying discrete energy levels.
Step-by-Step Reasoning
- Because radiation is emitted as photons, each photon has a definite energy given by .
- When the electron drops to a lower level, it loses energy; that lost energy appears as a photon:
- The spectrum shows only a few distinct frequencies (separate lines), not all possible frequencies.
- Therefore only certain values of occur, so only certain values of occur.
- The only way for energy differences to take only specific values is for the electron energies themselves to be restricted to specific (discrete) levels.
Key Takeaways
- Line spectra arise because atomic energy levels are quantised.
- Each spectral line corresponds to one transition with fixed .
- Photon energy links spectra to energy level spacings via .
Common Mistakes
- Saying “electrons emit photons of any energy” (that would give a continuous spectrum).
- Missing the link and only stating “levels are discrete” with no justification.
- Confusing absorption and emission (here it is emission: electron loses energy and photon is produced).
Things to Be Careful About
- Make it explicit that discrete frequencies mean discrete photon energies, and those equal energy differences between levels.
- Use the photon equation somewhere; otherwise the argument is incomplete.
The energy of the ground state (level ) in a hydrogen atom is .
Working
Answer
-2.18 × 10^−18 J
Background Concept
The electronvolt (eV) is a unit of energy often used in atomic physics. The conversion is
So to convert eV to J, multiply by .
Understanding the Question
You are told the ground state energy of hydrogen is and asked to express this energy in joules (J). The negative sign indicates the electron is bound (energy must be supplied to remove it to zero energy at infinity).
Approach
Multiply the value in eV by the conversion factor , keeping the negative sign.
Step-by-Step Reasoning
Start with
Convert units:
Calculate the numeric part:
So
To 3 significant figures:
Key Takeaways
- Use .
- Keep the sign of the energy when converting units.
Common Mistakes
- Dividing by instead of multiplying.
- Dropping the negative sign.
- Writing (power of ten sign error).
Things to Be Careful About
- Scientific notation: .
- Significant figures: the given 13.6 has 3 s.f., so the result should be 3 s.f.
Working
For the lowest-frequency line (transition ),
Convert to eV:
Answer
10.2 eV
Background Concept
When an electron drops between two energy levels, the atom emits a photon. The photon energy equals the energy difference between the two levels:
To express this energy difference in electronvolts, use
So
Understanding the Question
The spectrum shown is for transitions to the ground state (Lyman series). The three lowest frequencies are given. The smallest energy difference to corresponds to the transition from the closest higher level, , so we use the lowest frequency line, .
You need to calculate the energy of that photon and show it corresponds to .
Approach
- Take the lowest frequency because it corresponds to the smallest energy gap.
- Compute in joules.
- Convert joules to eV by dividing by .
Step-by-Step Reasoning
- Identify the correct line: for transitions ending at , the smallest gap is , giving the lowest frequency. Hence take
- Photon energy:
Multiply the numbers and combine powers of ten:
So
- Convert to eV:
This matches the stated value.
Key Takeaways
- Lowest frequency corresponds to the smallest energy difference because .
- Use then convert J to eV.
Common Mistakes
- Using the highest frequency line instead of the lowest for the transition.
- Multiplying by when converting J to eV (you must divide).
- Forgetting that frequencies are given in units of .
Things to Be Careful About
- Powers of ten: .
- Rounding: intermediate value rounds to consistent with the data precision.
Complete Table 8.1 to show the energy differences from the ground state, and the energies of the levels up to , in the hydrogen atom. Use the space for any working.
Table 8.1
| level | (energy difference from )/eV | energy/eV |
|---|---|---|
| 10.2 | ||
| 0.0 | –13.6 |
Working
For transitions to , energy difference from ground state is .
For ():
For ():
Level energies: with .
Answer
Completed Table 8.1:
| level | energy difference from / eV | energy / eV |
|---|---|---|
n=4: 12.8 eV, −0.8 eV; n=3: 12.1 eV, −1.5 eV; n=2: 10.2 eV, −3.4 eV
Background Concept
Hydrogen emission lines for transitions to the ground state arise when an electron falls from an excited level down to and emits a photon. The photon energy equals the energy gap:
If is the ground state energy, then the energy of level is
Here .
Understanding the Question
You are given three frequencies (in ) for the three lowest-frequency lines associated with transitions to . These correspond to transitions , , and .
You must complete a table listing:
- the energy differences from the ground state to levels (in eV), and
- the energies of those levels (also in eV).
The table already includes and .
Approach
- For each frequency, calculate the photon energy using .
- Convert joules to eV.
- Use to get each level energy.
Step-by-Step Reasoning
1) Match frequency to transition
For transitions ending at , higher starting means a larger energy drop, so a higher frequency (since ). Therefore:
- lowest frequency is (already used to get ),
- next is ,
- highest of the three is .
2) Compute energy differences in eV
For :
Convert to eV:
For :
3) Compute the level energies
Using with :
These values become less negative as increases, approaching for very large (the ionisation limit).
Key Takeaways
- For emission to the ground state, each line corresponds to one gap .
- Calculate gaps via and convert to eV.
- Level energies follow from .
Common Mistakes
- Adding the ground state energy with the wrong sign (e.g. ).
- Mixing up which frequency corresponds to which transition.
- Forgetting the factor of in the given frequencies.
- Giving excited level energies as positive (they should be negative for bound states).
Things to Be Careful About
- Keep consistent rounding (typically to 0.1 eV here, matching the given ).
- Use the same constants each time: and .
- The energy difference “from the ground state” is a positive number, while the level energies themselves are negative relative to the zero at infinity.
Answer
The mass defect is the difference between the total mass of the separate (free) nucleons and the mass of the nucleus formed from those nucleons (same and ).
Difference between the total mass of the separate nucleons and the mass of the nucleus.
Background Concept
Nuclei are bound systems: when nucleons (protons and neutrons) bind together, energy is released and the final bound nucleus has a lower total energy than the separated nucleons.
Einstein’s mass–energy relation,
means that a decrease in energy corresponds to a decrease in mass.
The mass defect is the “missing mass”:
This mass defect corresponds to the binding energy:
Understanding the Question
You are asked to state what is meant by mass defect. So you need a clear definition, mentioning (1) the sum of masses of separate nucleons, (2) the mass of the nucleus, and (3) that it is the difference between them.
Approach
Write the definition as a comparison between:
- the total mass of the individual nucleons if they were separated, and
- the mass of the nucleus when they are bound.
Optionally (for completeness), note that it relates to binding energy via .
Step-by-Step Reasoning
- Consider a nucleus with given proton number and nucleon number .
- If you take the same numbers of protons and neutrons as separate particles, their masses add to a total “free nucleon mass”.
- The actual nucleus mass is smaller than this sum.
- The difference (free total minus nucleus mass) is the mass defect.
Key Takeaways
- Mass defect is a difference in mass between free nucleons and the bound nucleus.
- It arises because binding releases energy, reducing the total mass of the system.
Common Mistakes
- Defining it as the difference between “reactants and products” in a reaction (that’s a reaction mass change, not the definition of mass defect of a nucleus).
- Saying “mass defect is the energy released” without mentioning it is a mass difference.
Things to Be Careful About
- Make clear it is the mass of the same nucleons when separated compared with when bound.
- Use “difference” with the correct sense (sum of free nucleon masses is larger).
The nuclear fusion reaction for the formation of helium-4 from deuterium is represented by
Table 9.1 shows the masses of the nuclides involved in this reaction.
Table 9.1
| nuclide | nuclide mass /u |
|---|---|
| 2.013553 | |
| 4.001505 |
Calculate the energy released in the formation of of helium-4.
= ______
Working
Mass defect per reaction:
Energy per nucleus formed:
Energy for ():
Answer
2.31 × 10^12 J
Background Concept
In a nuclear reaction, the energy released comes from a decrease in mass between the initial and final nuclear products.
1 atomic mass unit is a mass unit used for nuclides:
The energy equivalent of a mass change is given by:
For one mole, you multiply the energy per reaction by Avogadro’s constant:
Understanding the Question
The reaction is:
You are given the nuclide masses in u for deuterium and helium-4. You must:
- find the mass difference between reactants and product for one helium nucleus formed,
- convert that mass difference to energy,
- scale up to of helium-4 (i.e. helium nuclei).
Approach
- Compute total initial mass: two deuterium nuclei.
- Subtract final mass: one helium-4 nucleus.
- Convert u to kg.
- Use to get energy per reaction.
- Multiply by to get energy for 1 mol.
Step-by-Step Reasoning
1) Mass defect in u
Initial mass:
Final mass:
Mass defect:
2) Convert to kg
3) Energy per helium nucleus formed
4) Energy for 1.00 mol helium-4
contains helium nuclei, so:
Key Takeaways
- Energy released in nuclear reactions comes from a mass decrease: .
- Nuclide masses often come in u, so unit conversion is essential.
- “Per mole” means multiply by .
Common Mistakes
- Forgetting the factor of 2 for the two deuterium nuclei.
- Using incorrectly (e.g. not squaring it).
- Converting u to kg wrongly by using instead of .
- Multiplying by as if it were a number instead of using .
Things to Be Careful About
- The reaction shown produces one helium nucleus per reaction, so the number of reactions for 1 mol He is .
- Keep track of significant figures; typical final answers are 2–3 s.f.
- Always include the unit (J).
The star Sirius has a radius of and loses mass due to nuclear fusion at a rate of . Assume that the power of the radiation emitted by the star is equal to the power released by this process.
Determine a value for the luminosity of Sirius. Give a unit with your answer.
= ______ ______
Working
Answer
9.81 × 10^27 W
Background Concept
A star’s luminosity is the total energy it emits per unit time:
If the star’s energy comes from nuclear fusion, the source is mass being converted to energy. Einstein’s relation gives:
So the power (energy per second) released by a mass-loss rate is:
Understanding the Question
You are told Sirius loses mass due to fusion at a known rate, and you should assume all the power released becomes radiation power. That means the luminosity equals the rate of mass-energy conversion.
Given:
Find and give its unit.
Approach
Use:
Then substitute the numbers and quote the unit as watts (W), since it is power.
Step-by-Step Reasoning
- Start from .
- With , divide by :
- Substitute:
- Square the speed of light:
- Multiply:
Key Takeaways
- Luminosity is power.
- Fusion power can be found from mass-loss rate using .
Common Mistakes
- Using without dividing by time.
- Forgetting to square .
- Giving the unit as J instead of W.
Things to Be Careful About
- , so the unit checks out.
- Keep powers of ten consistent when multiplying in standard form.
Working
Answer
1.00 × 10^4 K
Background Concept
A star radiates approximately like a black body, so its luminosity is related to its surface temperature by the Stefan–Boltzmann law:
where
- is luminosity in ,
- is radius in ,
- ,
- is the surface temperature in .
Understanding the Question
You are given the radius of Sirius and, from part (c)(i), the luminosity. You must find the star’s surface temperature using the Stefan–Boltzmann relationship.
Given:
- (from (c)(i))
Find: .
Approach
Rearrange the Stefan–Boltzmann law for :
Then substitute and evaluate carefully in standard form, remembering the final step is a fourth root.
Step-by-Step Reasoning
- Rearrange:
- Calculate the surface area term :
- Multiply by :
(Unit check: .)
- Form the ratio:
So:
- Take the fourth root. Split into number and power of ten:
and
So:
Key Takeaways
- Use to connect luminosity and surface temperature.
- Rearranging gives a fourth-root dependence: temperature changes relatively slowly with luminosity.
Common Mistakes
- Forgetting the in the surface area.
- Using (missing the area factor).
- Taking a square root instead of a fourth root.
- Mixing up radius and diameter.
Things to Be Careful About
- Use SI units: in m, in .
- Handle powers of ten carefully when taking powers: becomes .
- Quote the final temperature to appropriate significant figures (typically 2–3 s.f.).
Explain how cosmologists use standard candles to estimate the distance of a galaxy from the Earth.
Answer
A standard candle has known luminosity (absolute brightness). Measure its apparent brightness / flux at Earth. Use the inverse-square law
to calculate
so obtain the galaxy’s distance.
Use known luminosity of a standard candle, measure flux, apply F = L/(4πd^2) to find d.
Background Concept
The key idea is that some astronomical objects have a known luminosity (power output), so they can act as standard candles.
- Luminosity : total power radiated by the source (W).
- Flux : power received per unit area at Earth (W m), sometimes called apparent brightness.
For radiation spreading uniformly in space, the inverse-square relation applies:
where is the distance to the source.
Understanding the Question
You must explain how standard candles allow cosmologists to estimate the distance to a galaxy. That means describing:
- what makes an object a standard candle (known ),
- what is measured (flux ),
- how distance is calculated (inverse-square law and rearrangement).
Approach
State that the standard candle’s luminosity is known from calibration (e.g. Cepheid period–luminosity relation or Type Ia supernova peak luminosity). Then explain measuring its apparent brightness and using to solve for .
Step-by-Step Reasoning
- Identify a standard candle within the galaxy (e.g. Cepheid variable or Type Ia supernova).
- Determine (or use known) luminosity of that object. This is the “standard” reference value.
- Measure the flux received at Earth using a telescope/detector.
- Assume isotropic emission so the power spreads over a sphere of area .
- Use:
Rearrange:
- The computed gives the distance to the galaxy.
Key Takeaways
- Standard candles work because their absolute luminosity is known.
- Measuring flux and using an inverse-square law turns that into a distance.
Common Mistakes
- Confusing luminosity with flux (luminosity is intrinsic; flux depends on distance).
- Using instead of .
- Omitting the idea that the luminosity must be known/calibrated first.
Things to Be Careful About
- The method assumes light is not significantly absorbed/scattered; in practice cosmologists correct for interstellar extinction and redshift effects.
- Distinguish “apparent brightness” (measured at Earth) from “absolute brightness/luminosity” (property of the source).
Answer
Contrast is the difference in brightness (blackening/grey level) between different regions of an X-ray image (due to different transmitted intensities).
Difference in brightness/grey level between regions of the X-ray image.
Background Concept
In an X-ray image, different tissues attenuate X-rays by different amounts. The detector (film or digital sensor) records the transmitted X-ray intensity, and this is displayed as different brightness (grey levels).
Contrast describes how easily two adjacent regions can be distinguished in the image.
Understanding the Question
You are asked for a definition: what “contrast” means in the context of an X-ray image.
Approach
State contrast as a comparison between regions of the image: how different the brightness/optical density (or recorded intensity) is.
Step-by-Step Reasoning
- Where transmitted intensity is higher, the detector records a different signal (e.g. darker film / different pixel value) than where transmitted intensity is lower.
- The bigger this difference between two regions, the higher the contrast and the easier it is to see boundaries/details.
Key Takeaways
- X-ray image contrast is about difference between regions, not the absolute intensity.
- It comes from different attenuation in different materials.
Common Mistakes
- Saying “contrast is the intensity” rather than the difference in intensity/brightness.
- Describing resolution/sharpness instead of contrast.
Things to Be Careful About
- Use a comparative statement (difference between areas).
- You may refer to brightness/blackening/grey level or to transmitted intensity; both are acceptable if clearly linked to the image.
X-rays of intensity are incident normally on a structure, as shown in Fig. 10.1.
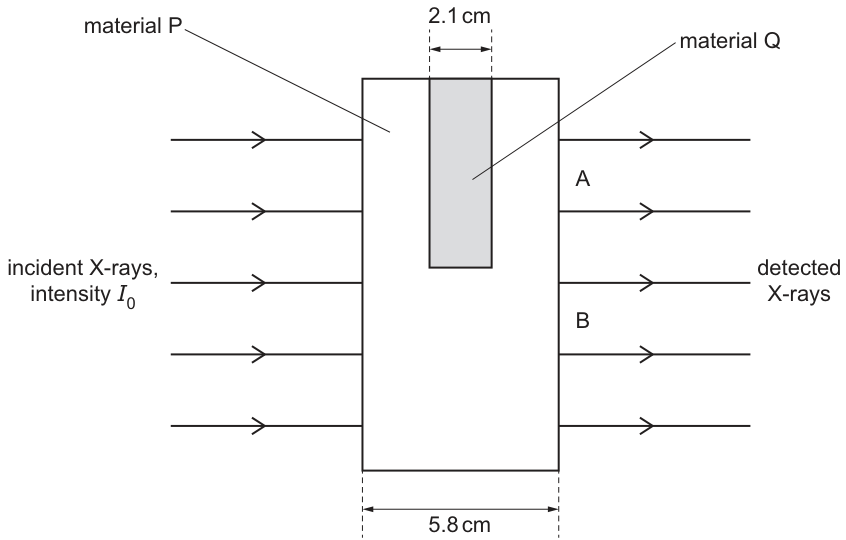
Material P has a linear attenuation coefficient of .
The X-rays emerging from the structure in region A have an intensity of .
Working
For region B (through material P of thickness ):
Answer
0.13 I0
Background Concept
X-rays are attenuated (reduced in intensity) as they pass through matter. For a material of linear attenuation coefficient and thickness , the transmitted intensity is
where:
- is the incident intensity,
- is the emerging intensity,
- has unit (if is in cm).
Understanding the Question
You are told material P has . From the diagram, region B corresponds to X-rays passing through thickness of material P (with no extra insert on that path). You must calculate the transmitted intensity in region B as a fraction of .
Approach
Use the attenuation law with and , then compute .
Step-by-Step Reasoning
- Start from
- Substitute values:
- Multiply in the exponent:
- Evaluate:
So .
Key Takeaways
- X-ray attenuation through a uniform thickness is exponential.
- The ratio is found directly from .
Common Mistakes
- Using a linear decrease (e.g. ), which is incorrect.
- Mixing units (e.g. using in m with in ).
Things to Be Careful About
- Ensure is in cm because is given in .
- Quote the transmitted intensity as a fraction of as requested.
Working
For region A, thickness of Q is so thickness of P is .
Take :
Answer
0.78 cm^-1
Background Concept
If X-rays pass through more than one material, the attenuation happens successively. If the beam passes through thickness of material 1 (coefficient ) and then thickness of material 2 (coefficient ), then
This works because after the first layer the intensity becomes , and that reduced intensity then gets attenuated by the second layer.
Understanding the Question
You are given:
- material P has ,
- total thickness across the structure is ,
- the insert material Q has thickness along the relevant path,
- in region A, the emerging intensity is .
You must find for material Q.
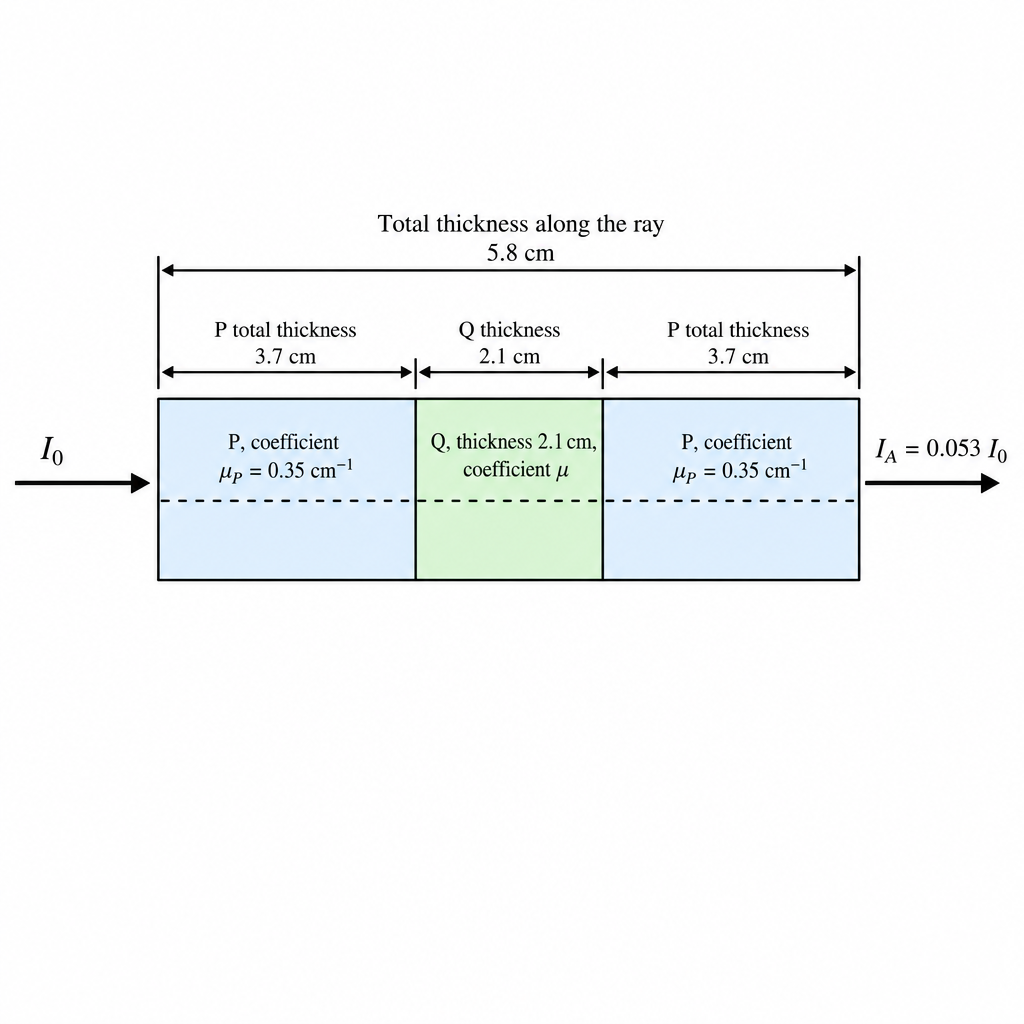
Approach
- Work out how much of the path is through P and how much is through Q.
- Write the combined attenuation equation for region A.
- Substitute the known numbers.
- Take natural logs to solve for .
Step-by-Step Reasoning
- Thickness through Q is , so thickness through P in that same line is
- Use successive attenuation:
So
- A good way to isolate is to take logs:
- Evaluate the known terms:
Then
and
Key Takeaways
- Multiple layers multiply the attenuation factors: .
- Natural logs turn products/exponentials into linear equations you can rearrange.
Common Mistakes
- Using as the thickness of P in region A (forgetting that some of it is replaced by Q).
- Adding attenuation coefficients directly (e.g. ) without weighting by thickness.
- Using without handling conversion (the scheme expects ).
Things to Be Careful About
- Keep thicknesses in cm to match in .
- When taking logs, remember and that is negative.
- Quote to a sensible number of significant figures (typically 2 s.f. here).
Use the information in (b)(i) to suggest why the X-rays emerging from the structure form an image that has poor contrast.
Answer
The transmitted intensities are quite similar ( and ), so the difference in detector signal/brightness between the two regions is small, giving poor contrast.
Because the transmitted intensities (0.053 I0 and 0.13 I0) are not very different, the brightness difference is small so contrast is poor.
Background Concept
In X-ray imaging, contrast depends on how different the detected X-ray intensity is between two neighbouring regions. If the transmitted intensities are close, the detector produces similar grey levels and it is difficult to distinguish structures.
Understanding the Question
You are asked to use the result from (b)(i) (region B intensity ) together with the given region A intensity to explain why the image contrast is poor.
Approach
Compare the two transmitted intensities. If the difference (or ratio) is small, the image will show only a small difference in grey level.
Step-by-Step Reasoning
- Region A transmits .
- Region B transmits .
- These are both small fractions of and are within the same order of magnitude.
- Therefore the detector signals (and hence grey levels) for A and B will be relatively close, so the boundary is not strongly distinguished.
Key Takeaways
- High contrast requires a large difference in transmitted intensity between regions.
- If intensities are close, the image appears “flat” with similar grey shades.
Common Mistakes
- Saying “poor contrast because intensity is low” without comparing the two regions.
- Confusing contrast with sharpness (edge blurring) or resolution.
Things to Be Careful About
- The question explicitly says to use (b)(i), so you must mention the two values and (or their small difference) in your reasoning.
Explain how X-rays are used in computed tomography (CT) scanning to produce a three-dimensional image of an internal structure.
Answer
- A narrow (fan) beam of X-rays passes through the body to detectors.
- Source and detectors rotate around the patient so intensities are measured for many directions/paths.
- A computer uses the attenuation data to reconstruct cross-sectional ‘slice’ images, and many slices are combined to form a 3D image.
Rotate X-ray source/detectors to take many attenuation measurements from different angles; computer reconstructs cross-sectional slices and combines slices to form a 3D image.
Background Concept
A CT scan measures how much X-rays are attenuated by tissue. The attenuation depends on the material and thickness, and can be described by the exponential law. In CT, instead of taking a single projection image, the system measures many projections from different angles and uses computation to reconstruct the internal structure.
Understanding the Question
The question asks how CT scanning uses X-rays to produce a three-dimensional image. The key ideas are:
- many measurements from different angles,
- reconstruction of a cross-section (a “slice”),
- combining slices to build a 3D image.
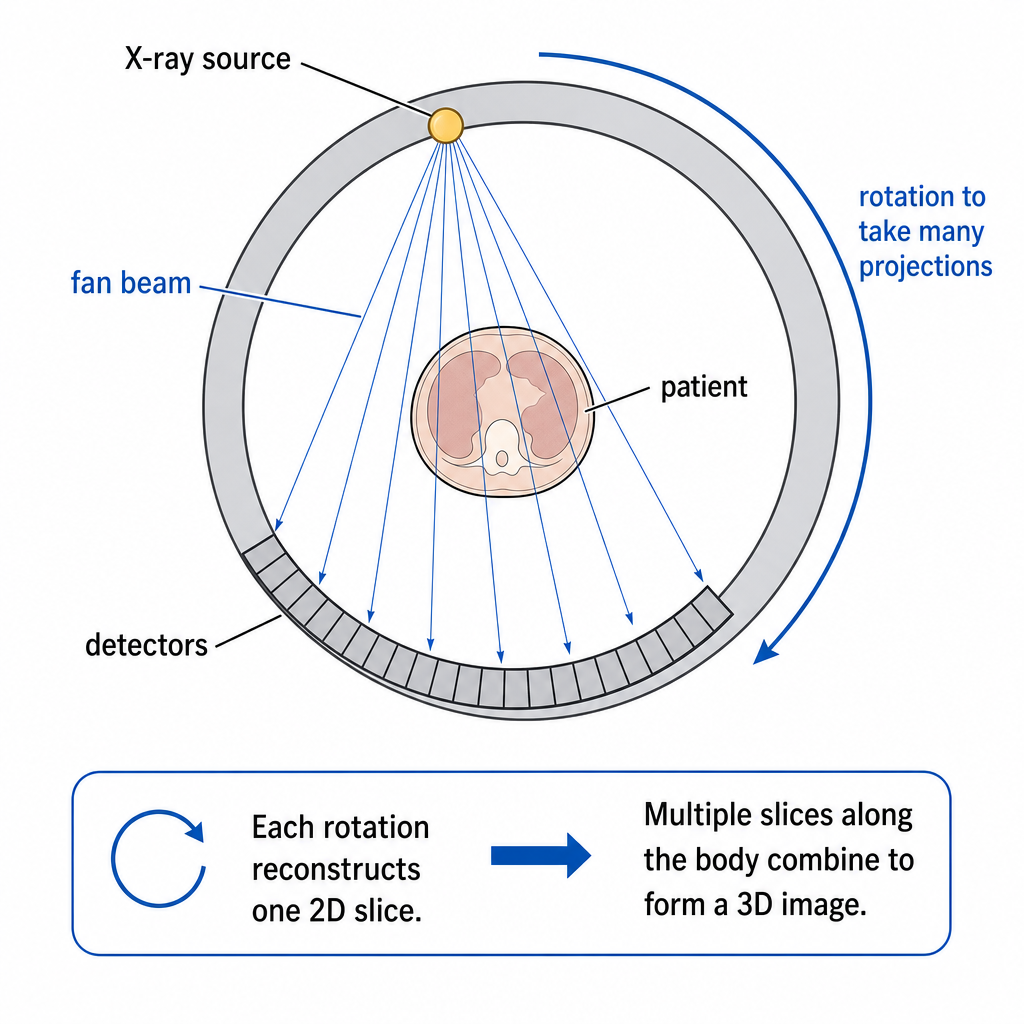
Approach
Describe:
- the rotating X-ray source and detector array,
- the collection of transmitted intensity data for many angles,
- the computer reconstruction into a cross-sectional image,
- repeating along the body (or using multiple detector rows) to form a 3D model.
Step-by-Step Reasoning
- The scanner produces a narrow beam (often fan-shaped) of X-rays directed through the patient.
- Detectors on the opposite side measure the transmitted intensity after the beam passes through the body.
- The source and detectors rotate around the patient, so for a single slice the system obtains transmitted intensities for many different directions (many “projections”).
- A computer algorithm uses these projections to calculate the X-ray attenuation at many points in that slice, reconstructing a 2D cross-sectional image.
- By scanning many adjacent slices (moving the patient through the ring, or using a multi-row detector), the set of 2D slices is stacked/combined to generate a 3D image of the internal structure.
Key Takeaways
- CT differs from a normal X-ray because it uses many angles and computer reconstruction.
- The basic measurement is still attenuation of X-rays through tissue.
- 3D comes from combining many reconstructed slices.
Common Mistakes
- Describing a single X-ray image only (no rotation, no reconstruction).
- Omitting the computer reconstruction step.
- Forgetting to explain how 3D is obtained (multiple slices).
Things to Be Careful About
- Mention rotation around the patient (multiple directions) for the key CT idea.
- State clearly that the output is cross-sectional slices which are then combined into 3D.