Physics 9702/42 — May/June 2025
Cambridge A-Level · A Level Structured Questions · worked solutions for every part, with the mark scheme
Topics Quantum Physics · Motion in a Circle · Gravitational Fields · Magnetic Fields · Temperature · Thermodynamics · +7 more
Answer
One radian is the angle at the centre of a circle that subtends an arc length equal to the radius of the circle.
One radian is the angle at the centre of a circle that subtends an arc length equal to the radius.
Background Concept
Angles can be measured in degrees or in radians. The radian is defined using a circle:
If an angle at the centre of a circle cuts off (subtends) an arc of length on the circumference of a circle of radius , then
This equation is actually the definition of radian measure.
Understanding the Question
The question asks for the definition of “the radian”. So the examiner wants the standard statement linking an angle at the centre to an arc length and the circle radius.
Approach
State the definition directly in words (and it is fine if you also express it using , but the key is the wording “arc length equals radius”).
Step-by-Step Reasoning
- Consider a circle of radius .
- Take an angle at the centre that cuts off an arc length .
- If , then the angle is defined to be radian.
Key Takeaways
- Radians are defined by .
- radian corresponds to arc length equal to radius.
Common Mistakes
- Defining it using degrees (e.g. “”) instead of the arc-length definition.
- Forgetting that the angle must be at the centre of the circle.
Things to Be Careful About
- The definition must include “arc length” and “radius” and make clear they are equal for rad.
- Do not write “circumference equals radius” (it is a specific arc, not the whole circle).
The rear wheel and the pedals of a bicycle are connected by a chain that passes around two cogs (toothed wheels), as shown in Fig. 1.1.
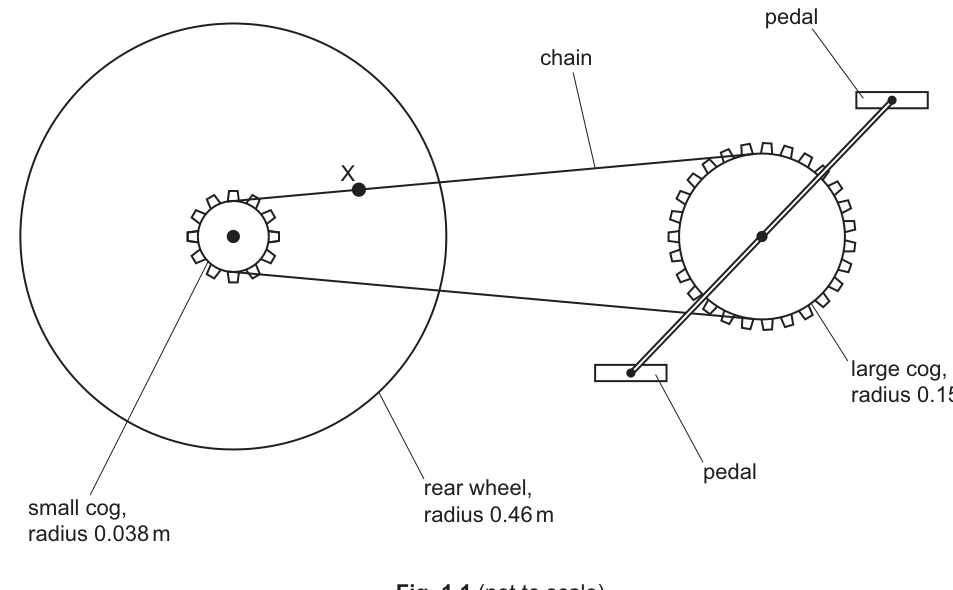
The small cog has a radius of and is fixed to the rear wheel so that it rotates with it.
The large cog has a radius of and is fixed to the pedals so that it rotates with them.
The rear wheel has a radius of .
The bicycle is being pedalled so that it moves in a straight line at a constant speed of .
Working
For the rear wheel,
Answer
37 rad s^-1
Background Concept
For a point on the rim of an object rotating with angular speed , the tangential (linear) speed is related by
where is the radius from the axis of rotation.
This applies to rolling motion too: if a wheel rolls without slipping, the speed of the bicycle equals the tangential speed of the rim relative to the wheel’s centre.
Understanding the Question
The bicycle moves at constant speed . The rear wheel radius is . You are asked for the angular speed of the rear wheel, so you must connect the linear speed of the bicycle to the wheel’s rotation.
Approach
Use and rearrange for . Substitute the given speed and wheel radius.
Step-by-Step Reasoning
Start with
Rearrange:
Substitute and :
To suitable significant figures:
Key Takeaways
- Use to convert between linear speed and angular speed.
- Radians are dimensionless, so has unit .
Common Mistakes
- Using the radius of the small cog instead of the wheel radius.
- Writing (wrong rearrangement).
- Giving unit only; the expected unit is .
Things to Be Careful About
- Ensure is in metres (it is already).
- Use the wheel radius given (), not diameter.
Working
Small cog rotates with the rear wheel, so .
Answer
0.17 s
Background Concept
For uniform circular motion, the angular speed and the period (time for one full revolution) are related by
This comes from the fact that one full revolution corresponds to an angular displacement of radians.
Understanding the Question
The small cog is fixed to the rear wheel, so it rotates with the rear wheel (same angular speed, same period). You are asked for the period of the small cog.
Approach
- Use the angular speed from part (b)(i).
- Convert angular speed to period using .
Step-by-Step Reasoning
Because the small cog is rigidly attached to the rear wheel:
Using ,
So
Key Takeaways
- One revolution is radians.
- Fixed (rigidly connected) components share the same angular speed and period.
Common Mistakes
- Using instead of .
- Assuming the chain makes the small cog rotate differently from the wheel, despite them being fixed together.
Things to Be Careful About
- Carry enough significant figures from (b)(i) until the end; rounding early can shift the last digit slightly.
- Period is in seconds; do not attach to .
Show that the distance moved by point X on the chain during one full rotation of the small cog is .
Working
Distance moved by the chain in one rotation of the small cog is its circumference:
Answer
0.24 m
Background Concept
When a wheel or cog rotates, a point on its rim moves through an arc length. For a full rotation, the arc length is the circumference:
For a chain wrapped around a cog without slipping, the linear distance the chain moves equals the arc length that passes the contact point.
Understanding the Question
Point is on the chain. During one full rotation of the small cog, the length of chain that passes over the cog is one full circumference of that cog. The question asks you to show this distance is using the given small-cog radius .
Approach
Calculate the circumference of the small cog using , then round appropriately.
Step-by-Step Reasoning
For one complete revolution of the small cog, the chain advances by one circumference:
Substitute :
Rounding to 2 significant figures (consistent with the given radius),
Key Takeaways
- One full rotation corresponds to one circumference of travel at the rim.
- For a chain drive (no slipping), chain distance moved equals rim arc length.
Common Mistakes
- Using diameter instead of radius (giving is fine only if is used correctly).
- Using the rear wheel radius instead of the small cog radius.
- Rounding to (too much rounding down for typical sig figs).
Things to Be Careful About
- Keep units in metres throughout.
- The value is a rounded version of ; stating both shows “show that” clearly.
Use the information in (b)(iii) to determine the angle through which the large cog rotates during one full rotation of the small cog.
angle = ______
Working
Chain distance for one rotation of small cog: .
For the large cog,
Answer
1.6 rad
Background Concept
Radian measure links angular displacement to arc length for a circle of radius :
In a chain drive with no slipping, the distance the chain moves is the same everywhere along the chain. That same distance corresponds to an arc length that has passed around each cog.
Understanding the Question
From (b)(iii), during one full rotation of the small cog the chain moves a distance . The large cog has radius . The question asks for the angle through which the large cog turns when that length of chain passes around it.
Approach
Treat the chain movement as an arc length on the circumference of the large cog. Use and rearrange to .
Step-by-Step Reasoning
- Chain displacement for one full small-cog turn: .
- On the large cog, that means an arc length has moved past the chain contact.
- Use
with :
So the angular displacement of the large cog is
This is less than rad, which makes sense: the large cog has a larger radius, so the same chain length corresponds to a smaller fraction of a full revolution.
Key Takeaways
- Use to convert between chain travel (a linear distance) and angular rotation.
- Bigger radius means smaller angle for the same arc length.
Common Mistakes
- Using instead of .
- Using the radius of the small cog () instead of the large cog radius ().
- Assuming the large cog rotates through just because the small cog did.
Things to Be Careful About
- Use the distance from (b)(iii) (rounded consistently) to match the expected answer.
- Ensure the angle is in radians, not revolutions or degrees.
The chain of the bicycle in (b) is moved onto a smaller cog fixed to the rear wheel. The speed of the bicycle does not change.
Explain, without calculation, the effect of this change on the angular speed of the pedals.
Answer
With the bicycle speed unchanged, the rear wheel angular speed is unchanged.
Moving the chain to a smaller rear cog means the chain (tangential) speed is smaller ( with smaller and same ).
Since for the front cog and its radius is unchanged, the pedals must have a smaller angular speed.
Angular speed of the pedals decreases.
Background Concept
For any rotating object,
At the rim of a cog, is the tangential speed of the teeth (and of the chain if there is no slipping). In a bicycle chain system:
- The chain speed is the same everywhere along the chain.
- That chain speed must equal the tangential speed at the edge of each cog.
So, for the rear cog:
and for the front (pedal) cog:
Understanding the Question
The chain is moved onto a smaller cog at the rear wheel, while the bicycle’s forward speed stays the same. The question asks, without calculation, how the angular speed of the pedals changes.
Key points hidden in the wording:
- “Speed of the bicycle does not change” means the rear wheel still rotates at the same angular speed as before.
- Only the rear cog radius has changed (it is now smaller).
Approach
- Keep in mind rear wheel angular speed stays the same because bicycle speed is fixed.
- Use qualitatively at the rear cog: if is fixed but decreases, the tangential speed (chain speed) must decrease.
- Use at the front cog: if decreases but is unchanged, then of the pedals must decrease.
Step-by-Step Reasoning
- Bicycle speed unchanged rear wheel angular speed unchanged (same wheel radius).
- Rear cog is fixed to the wheel, so it has the same angular speed as the wheel.
- Chain speed equals tangential speed at the rear cog:
- With the same but a smaller , the tangential speed is smaller.
- Therefore the chain moves more slowly.
- At the front cog (radius unchanged), the chain speed is again :
- If is smaller and is the same, then must be smaller.
- So the pedals rotate more slowly (smaller angular speed).
Key Takeaways
- A smaller driving/driven radius changes angular speed ratios.
- If the same angular speed is applied to a smaller radius, the linear (chain) speed is reduced.
- With fixed front-cog radius, reduced chain speed means reduced pedal angular speed.
Common Mistakes
- Saying the pedals must rotate faster because the rear cog is smaller (that would be true for changing the front cog or for keeping chain speed fixed, but here wheel speed is fixed by bicycle speed).
- Assuming chain speed is fixed by bicycle speed directly (it is fixed by the tangential speed at the rear cog, which depends on the cog radius).
Things to Be Careful About
- Distinguish clearly between what is unchanged (bicycle speed, rear wheel angular speed) and what changes (rear cog radius, chain speed, pedal angular speed).
- Keep the direction of proportionality straight: at fixed , smaller gives smaller ; at fixed , smaller gives smaller .
Answer
A gravitational field line shows the direction of the gravitational force on a small test mass (i.e. the direction of ; tangent to the line).
Closer spacing (greater density) of field lines represents a stronger gravitational field.
A gravitational field line gives the direction of gravitational force on a test mass (direction of g); line density indicates field strength.
Background Concept
The gravitational field at a point is described by the gravitational field strength .
It is defined as force per unit mass:
So is a vector: it has both magnitude and direction. Field lines are a diagrammatic way to represent a vector field.
Understanding the Question
You are asked what a gravitational field line represents. This is not asking for an equation, but for the meaning of the arrows/lines on a field diagram.
Approach
State (1) what direction the line indicates and (2) what the spacing of lines tells you about strength, because these are the two standard pieces of information encoded in field-line diagrams.
Step-by-Step Reasoning
- Because is in the same direction as the force on a small test mass, the direction of the gravitational field at any point is the direction a small mass would accelerate.
- On a field-line diagram, the direction of the field at a point is given by the tangent to the field line (with arrows showing direction).
- Where the field is stronger, we represent that by drawing field lines closer together (greater line density), indicating larger magnitude of .
Key Takeaways
- A field line’s tangent gives the direction of the field vector.
- Line density represents field strength.
Common Mistakes
- Saying a field line shows the path a mass will take (it does not necessarily; motion depends on initial velocity).
- Forgetting that field strength is force per unit mass.
Things to Be Careful About
- Always mention direction (tangent/arrows) for one mark and spacing/density for the other mark when 2 marks are available.
The Earth may be considered as a uniform sphere, as shown in Fig. 2.1.
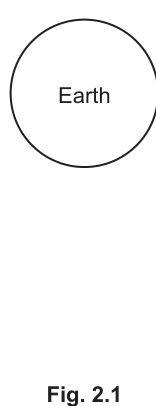
On Fig. 2.1, draw field lines to represent the Earth’s gravitational field outside the Earth.
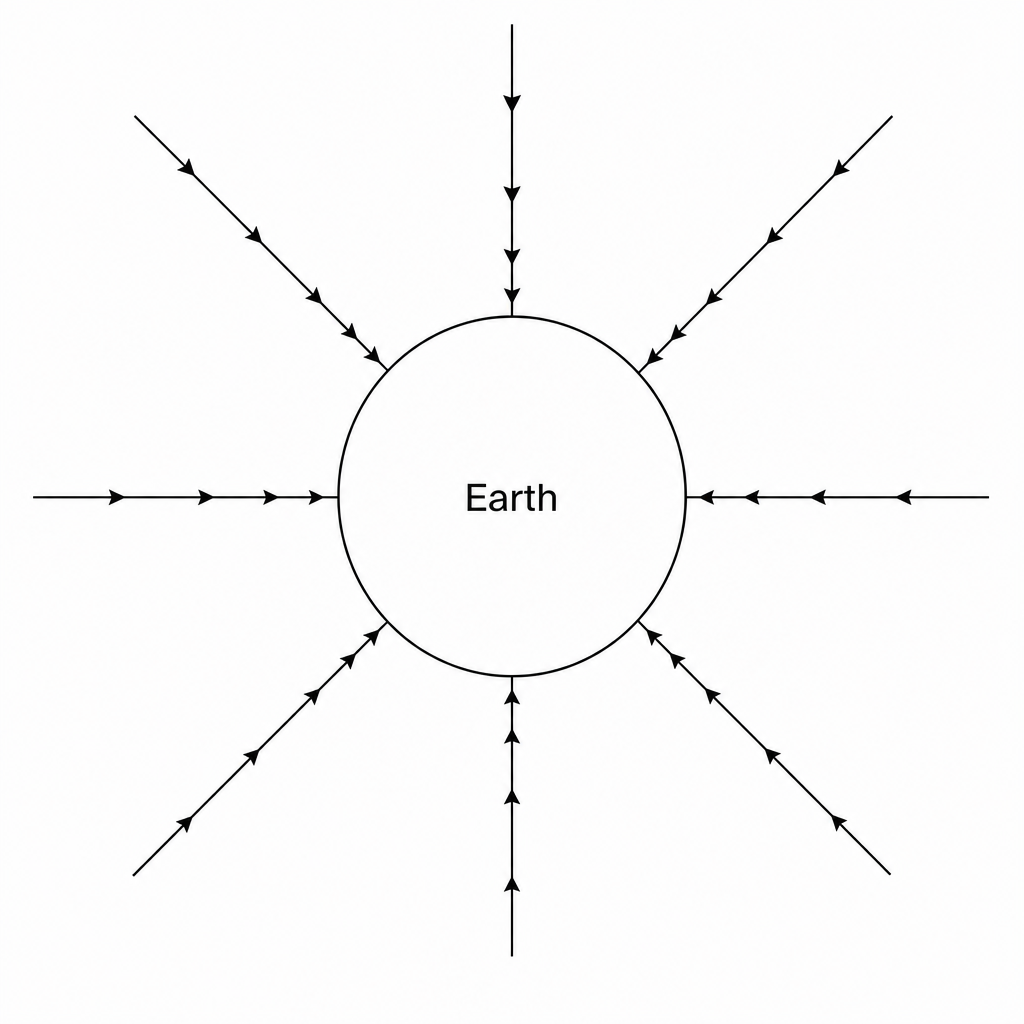
Radial field lines directed towards the Earth’s centre (inward), symmetric all around.
Background Concept
For a spherically symmetric mass like a uniform sphere, the gravitational field outside behaves as if all mass were concentrated at the centre. The field direction is always towards the centre, and its magnitude depends only on distance from the centre:
Field lines for gravity therefore:
- point towards the mass (gravity is attractive),
- are radial for a spherical mass,
- are denser nearer the mass (because is larger for smaller ).
Understanding the Question
You are given a circle representing Earth and asked to draw the gravitational field lines outside it. So you should not draw anything inside the Earth; only the external pattern is required.
Approach
Use spherical symmetry:
- Draw several straight lines radiating symmetrically around the Earth.
- Put arrowheads pointing inwards (towards the centre).
- (Optionally) show lines slightly closer together nearer Earth to indicate stronger field.
Step-by-Step Reasoning
- Because the field must point towards the Earth’s centre, each field line is along a radius.
- At every point on the surface the field is perpendicular to the surface (since the surface of a sphere is an equipotential), so the lines meet the surface at right angles.
- Add arrowheads pointing towards the Earth to show the attractive direction.
Key Takeaways
- Outside a uniform sphere, gravitational field lines are radial and inward.
- Symmetry means the pattern looks the same all around the sphere.
Common Mistakes
- Drawing circular lines around the Earth (that would be wrong for gravity).
- Drawing arrows pointing outward.
- Drawing only two lines (too few to represent a field pattern).
Things to Be Careful About
- Ensure lines are straight and meet the surface normally.
- Ensure arrows point towards the Earth (gravity attracts).
The Earth’s magnetic field may be considered as being due to the Earth acting as a long solenoid, as shown in Fig. 2.2.
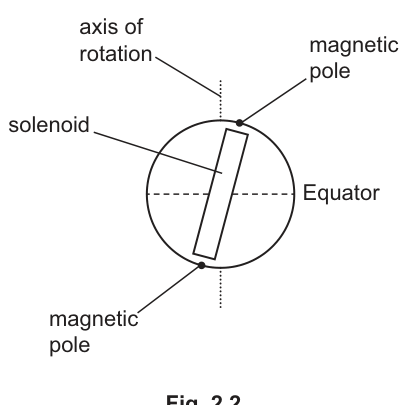
The magnetic poles do not align with the geographic poles, which are on the axis of rotation.
Fig. 2.3 is a copy of Fig. 2.2 without the labels but with two magnetic field lines shown.
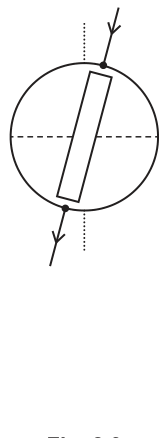
On Fig. 2.3, label the magnetic poles with the letters N and S to indicate which one is the magnetic N pole and which one is the magnetic S pole.
Answer
Outside the Earth, magnetic field lines go from to .
So the pole where the shown field line leaves the Earth is , and the pole where the shown field line enters the Earth is .
Label the pole where field lines leave as N, and where they enter as S.
Background Concept
Magnetic field lines are drawn using a standard convention:
- Outside a magnet, field lines go from the magnetic north pole () to the magnetic south pole ().
- Inside the magnet, they return from to to form continuous loops.
So if you can see the direction of the arrows on field lines outside the object, you can identify which end is (lines emerge) and which is (lines enter).
Understanding the Question
In Fig. 2.3 you are shown two magnetic field lines outside Earth: one is entering the Earth at one magnetic pole and one is leaving at the other. You must label which pole is magnetic and which is magnetic .
Approach
Use the field-line direction convention:
- emerging/outgoing lines indicate ,
- incoming/entering lines indicate .
Step-by-Step Reasoning
- Inspect the given field lines: at one end, the external field line is directed into the Earth surface (it terminates/enters there). That end must be the magnetic south pole .
- At the other end, the external field line is directed away from the Earth (it emerges/leaves there). That end must be the magnetic north pole .
Key Takeaways
- Outside a magnet, field lines go .
- Use “emerges from ” and “enters ” to label poles.
Common Mistakes
- Reversing the convention (labelling the entry point as ).
- Forgetting that the convention refers to the field direction outside the magnet.
Things to Be Careful About
- Make sure you are using the arrows/direction of the drawn field lines, not the geographic axis labels (which are different in this question).
On Fig. 2.3, draw field lines to represent the Earth’s magnetic field outside the Earth.
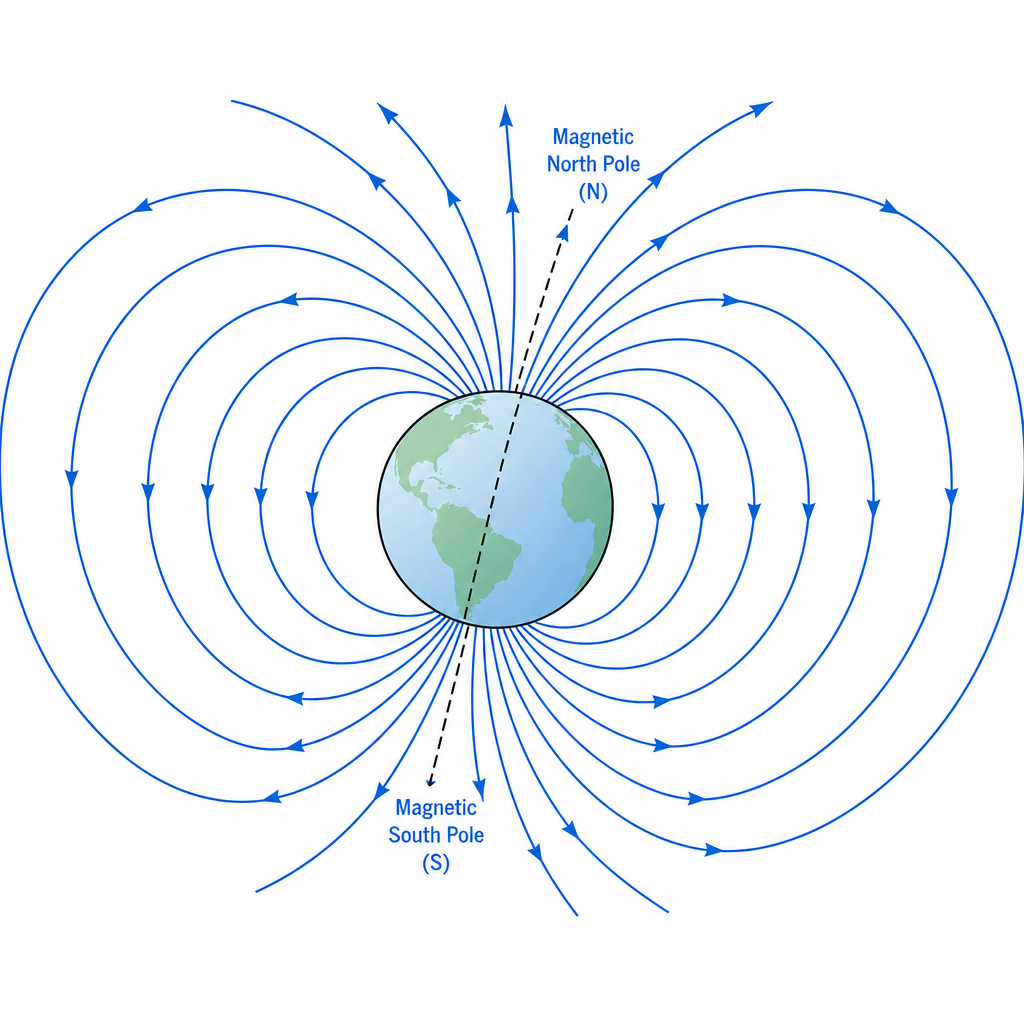
Dipole-like field lines outside Earth, leaving N and entering S, symmetric about the magnetic axis.
Background Concept
A long solenoid (and similarly a bar magnet) produces a dipole-like magnetic field:
- Field lines form closed loops.
- Outside the solenoid/magnet, field lines go from to .
- The field is strongest near the poles, represented by closer field lines.
Earth’s magnetic field is often approximated by a tilted dipole, so the field pattern around Earth resembles that of a bar magnet whose axis is not the same as the rotation axis.
Understanding the Question
You are given Fig. 2.3 with two magnetic field lines already shown outside the Earth. You must add more lines to represent the external magnetic field pattern.
Approach
- Keep the pattern consistent with a dipole: curved loops connecting the two poles.
- Ensure the direction is from to outside Earth.
- Draw a symmetric set of lines about the magnetic axis (the solenoid axis), not necessarily the geographic axis.
Step-by-Step Reasoning
- Identify and from part (b)(i) (lines emerge from and enter ).
- Add several more curved lines outside Earth: they should start at the pole region, bow outward around the Earth, and enter at the pole region.
- Make lines closer together near the poles to indicate stronger field there.
Key Takeaways
- Earth’s external magnetic field is drawn like a tilted dipole.
- External field direction is .
Common Mistakes
- Drawing magnetic field lines radial like gravity.
- Drawing arrows going from to outside the Earth.
- Drawing lines symmetric about the rotation axis instead of the magnetic axis in the diagram.
Things to Be Careful About
- Lines must not start or end in empty space; they should connect from to externally.
- Ensure your added lines match the curvature of the two given lines (consistency).
An observer moves around the surface of the Earth.
Use your answer in (a)(ii) to explain why the observed gravitational field of the Earth does not vary around the surface.
Answer
In (a)(ii) the field lines are radial and symmetrically/equally spaced around the Earth.
An observer on the surface is always at the same distance from the centre, so is the same everywhere (direction always towards the centre).
Because the field lines are symmetric and the radius is constant on the surface, g has the same magnitude everywhere (towards the centre).
Background Concept
For a spherically symmetric mass, the gravitational field outside depends only on distance from the centre:
Field lines provide a visual version of this: if the pattern is the same in every direction and the line density at a given radius is the same, then the field strength at that radius is the same.
Understanding the Question
You are told an observer moves around Earth’s surface. The question asks you to use your diagram from (a)(ii) to explain why the observed gravitational field does not vary around the surface.
So you must connect:
- field-line symmetry (from your drawing),
- constant distance from the centre on the surface,
- to constant gravitational field strength.
Approach
Use two linked arguments:
- On a sphere, moving around the surface keeps constant.
- Your field lines show a symmetric, radial field, so the field magnitude at that fixed radius is the same everywhere.
Step-by-Step Reasoning
- On Earth’s surface, the observer is always at from Earth’s centre.
- Since depends only on (not on direction around the sphere), has one value everywhere on the surface.
- The field-line diagram reflects this: at the same distance from the centre, the spacing of field lines is uniform all around, indicating the same field strength.
- The direction of always points towards the centre, so as you move, the direction changes with your position but the observed local direction is always “downwards towards the centre.”
Key Takeaways
- For a spherical mass, depends only on radius .
- Constant radius around the surface means constant field magnitude.
Common Mistakes
- Saying “it doesn’t vary because Earth is uniform” without linking to constant distance from the centre.
- Confusing direction and magnitude: the vector direction in space changes around the Earth, but locally it is always towards the centre.
Things to Be Careful About
- The question wants you to use the field-line diagram idea: mention symmetry/equal spacing (line density) and radial direction.
- Ignore small real-world effects (rotation, non-uniform density) since the Earth is stated to be a uniform sphere here.
With reference to your answer in (b)(ii), describe how the observed magnetic field of the Earth varies around the surface.
Answer
The magnetic field is not the same all around the surface because the dipole axis is tilted.
Field direction changes with position: near the magnetic poles the field is more nearly radial/vertical, but near the equatorial region it is more nearly horizontal.
Field strength also varies: it is stronger near the magnetic poles (field lines closer together) and weaker further from the poles (field lines more widely spaced).
Magnetic field varies in both direction and strength around the surface: strongest and more vertical near magnetic poles; weaker and more horizontal near equator, due to tilted dipole.
Background Concept
A dipole magnetic field (like a bar magnet/solenoid) has:
- field lines emerging from and entering outside,
- strongest field near the poles (high line density),
- a direction that changes from place to place: near poles it is more vertical; around the mid-region it is more horizontal.
Unlike gravity for a uniform sphere, a dipole field is not the same at every point on a spherical surface because the field is not spherically symmetric.
Understanding the Question
You must describe how the observed magnetic field varies around Earth’s surface, referring to your external field-line diagram from (b)(ii). That means you should interpret what the line pattern implies about:
- how the direction of changes,
- how the magnitude of changes,
- and link this to the fact the magnetic axis is tilted relative to the rotation axis.
Approach
From a field-line diagram:
- Direction of is along the tangent to the field line.
- Strength is indicated by how close the field lines are.
So, compare what the field lines look like near poles vs near the equator, and note that because the dipole is tilted, these effects occur at different geographic locations.
Step-by-Step Reasoning
- Direction variation: As you move around the surface, the tangent to the field lines changes. Near the magnetic poles, the lines go into/out of Earth almost perpendicular to the surface, so the field is more vertical. Near the equatorial region of the dipole, the lines run more parallel to the surface, so the field is more horizontal.
- Strength variation: Where field lines are closer together (near the magnetic poles) the field is stronger. Where the lines spread out (around the sides/equator) the field is weaker.
- Not constant around the Earth: Because the magnetic dipole axis is tilted relative to the rotation axis, an observer moving around the surface (especially along a line of latitude relative to the geographic poles) will find that both the direction (inclination) and magnitude of change with position.
Key Takeaways
- For magnetic fields, the field-line pattern shows both changing direction (tangent) and changing strength (line density).
- A dipole field is not spherically symmetric, so it cannot be the same everywhere on a sphere.
Common Mistakes
- Stating only “it varies” without saying how (direction and/or strength).
- Mixing up gravity and magnetism and claiming magnetic field is constant because Earth is spherical.
- Saying field lines are strongest where they are furthest apart.
Things to Be Careful About
- The question asks for variation “around the surface”: make sure you mention both poles and equatorial regions (relative to the magnetic axis).
- Be explicit that the tilt causes the pattern not to align with geographic poles, so different locations experience different field direction/strength.
Answer
Specific heat capacity is the thermal energy required to raise the temperature of of a substance by (or ), without change of state.
Thermal energy required to raise the temperature of 1 kg of a substance by 1 K (no change of state).
Background Concept
Specific heat capacity tells you how much energy is needed to warm up a substance.
It is defined through the relationship
where:
- is the thermal energy transferred to the substance (or energy required),
- is the mass,
- is the temperature rise,
- is the specific heat capacity.
The phrase “without change of state” matters because during melting/boiling, energy goes into latent heat rather than increasing temperature.
Understanding the Question
You are asked to define specific heat capacity. A full definition must include:
- energy per unit mass,
- per unit temperature rise,
- and the condition of no change of state.
Approach
Give the standard Cambridge definition: energy required to raise the temperature of by (or ), with no state change.
Step-by-Step Reasoning
- “Specific” means per unit mass ().
- “Heat capacity” refers to energy needed for a temperature increase, so specify per unit temperature rise ().
- Add “without change of state” because otherwise the definition becomes ambiguous (energy could be used for melting/boiling).
Key Takeaways
- Specific heat capacity is energy per kg per kelvin.
- It applies when temperature changes and the substance stays in the same phase.
Common Mistakes
- Forgetting to mention 1 kg (per unit mass).
- Forgetting 1 K (per unit temperature rise).
- Omitting “no change of state”.
Things to Be Careful About
- temperature rise is the same size as rise; the difference is what matters.
- Don’t confuse specific heat capacity with specific latent heat (which is energy to change state at constant temperature).
A block of aluminium has a volume of at a temperature of .
Aluminium has a density of at .
It has a density of at .
The block is heated so that its temperature increases from to at an atmospheric pressure of .
The increase in internal energy of the block is .
Working
Answer
9.75 kg
Background Concept
Density is defined as mass per unit volume:
Rearranging gives
This works as long as the density given corresponds to the temperature at which the volume is stated.
Understanding the Question
At you are given:
- volume
- density
You must find the mass of the aluminium block.
Approach
Use directly, since both and are given at the same temperature.
Step-by-Step Reasoning
- Start with
- Substitute the given values:
-
Combine powers of ten: .
-
Multiply the numbers: .
So
- Quote to 3 s.f. (matching the data):
Key Takeaways
- Use when density and volume are known.
- Make sure density corresponds to the same conditions as the volume (here, ).
Common Mistakes
- Using the density at instead of at .
- Incorrectly handling powers of ten.
Things to Be Careful About
- Both quantities are already in SI units ( and ), so no conversion is needed.
- Round at the end to avoid rounding errors.
Working
Mass is constant, so
Answer
3.722 × 10^-3 m^3
Background Concept
For a solid block, the mass stays the same when it is heated (no material is added/removed). Density changes because the volume changes.
Using
we can write
So if decreases on heating, must increase.
Understanding the Question
You have already found the mass in (b)(i). At the density is given as
You must show that the new volume is .
Approach
Use with the same mass from part (i).
Step-by-Step Reasoning
- Mass conservation: is unchanged from to .
- Apply the density relation at :
- Substitute:
- Evaluate:
This matches the value to be shown.
Key Takeaways
- Heating changes density mainly by changing volume; mass remains constant.
- Use when density at a new temperature is provided.
Common Mistakes
- Recalculating mass using the density (mass should not change).
- Forgetting the in the density.
Things to Be Careful About
- Keep enough significant figures from part (i) to reproduce the stated volume.
- Don’t round the mass too aggressively before substituting.
Use the information in (b)(ii) to determine the magnitude of the work done on the block when its temperature is raised from to .
work done = ______
Working
Magnitude of work done:
Answer
11.1 J
Background Concept
When an object expands against an external pressure , energy is transferred as mechanical work.
At constant external pressure, the magnitude of work associated with a volume change is
The sign depends on whether work is done on the system or by the system; this is dealt with explicitly in part (iv).
Understanding the Question
You are told the block is heated at atmospheric pressure
From (b)(ii), the volume increases from to .
You must find the magnitude of the work done on the block during this heating.
Approach
- Find the volume increase .
- Use .
Step-by-Step Reasoning
- Compute the volume change:
- Use constant pressure work magnitude:
- Multiply: , so the result is of order joules.
Key Takeaways
- Expansion at constant external pressure transfers energy as work.
- Even a small fractional expansion of a solid can be found from density/volume data.
Common Mistakes
- Using instead of .
- Forgetting that and that .
- Giving the signed value when the question asks for magnitude.
Things to Be Careful About
- Keep powers of ten consistent when subtracting volumes.
- This work is very small compared with in part (v), but it still affects the sign logic.
Answer
The block expands as it is heated, so it pushes back the atmosphere and does work on the surroundings.
Therefore the work done on the block is negative ().
Negative (the block expands and does work on the surroundings).
Background Concept
In the Cambridge convention for the first law,
where:
- is thermal energy transferred to the system,
- is work done on the system.
So:
- Compression (surroundings do work on the system) gives .
- Expansion (system does work on surroundings) gives .
Understanding the Question
The block is heated from to at atmospheric pressure. From part (ii) its volume increases, meaning it expands.
You must decide whether the work done on the block is positive or negative.
Approach
Decide whether the surroundings are doing work on the block or the block is doing work on the surroundings.
- If the block expands against external pressure, the block must push air away: that is work done by the block.
- Hence work done on the block is negative.
Step-by-Step Reasoning
- Heating causes aluminium to expand: increases.
- External pressure resists expansion, so the block must exert a force on the surrounding air.
- The block therefore transfers energy mechanically to the surroundings.
- With defined as work done on the block, energy leaving the block as work corresponds to
Key Takeaways
- Always check the sign convention used in the syllabus: here is work done on the system.
- Expansion implies (on the system) is negative.
Common Mistakes
- Saying “work done is positive because the volume increases” (sign depends on definition of ).
- Mixing up “work done by the block” with “work done on the block”.
Things to Be Careful About
- Part (iii) asked for the magnitude, so it was positive there; in part (iv) you must now state the sign.
- Be explicit about which direction the energy transfer occurs (to surroundings during expansion).
Use the first law of thermodynamics to determine, to three significant figures, a value for the specific heat capacity of aluminium. Explain your reasoning. Give a unit with your answer.
specific heat capacity = ______ unit ______
Working
From (iii) and (iv), for expansion
First law:
Temperature rise: .
Answer
898 J kg^-1 K^-1
Background Concept
For heating a solid with no change of state, the thermal energy transferred to it is
However, if the solid expands against external pressure, some energy transfer also occurs as work. The first law (Cambridge convention) is
where is work done on the system. For expansion, is negative.
Understanding the Question
Given:
- increases from to
- from (i) is
- temperature rises from to , so
You must use the first law to find and explain the reasoning (i.e. show how you obtained from and ).
Approach
- Find the signed work using the result from (iii) and the sign from (iv).
- Rearrange the first law to find .
- Use to solve for .
Step-by-Step Reasoning
-
From (iii), the magnitude of the work associated with expansion is .
-
From (iv), because the block expands it does work on the surroundings, so work done on the block is negative:
- Apply the first law:
Rearrange for :
Substitute values:
(Notice this is essentially because is tiny compared with , but including it shows correct use of the law.)
- Now use the definition of specific heat capacity:
So
- Substitute and :
Compute denominator: .
Key Takeaways
- First law links internal energy change to heat transfer and work: .
- For expansion, work done on the system is negative.
- Once is found, use to obtain .
Common Mistakes
- Using (wrong sign convention for this syllabus).
- Taking as for expansion when is defined as work done on the system.
- Using as if it were different from (temperature difference is the same, but you must write it consistently).
- Forgetting to convert to joules.
Things to Be Careful About
- Quote to three significant figures as requested, and include the unit .
- Keep track of whether a quantity is a magnitude (part iii) or a signed value (part iv/v).
- The work term here is extremely small compared with ; a small arithmetic slip in will not change the final much, but the reasoning/sign is what the marks test.
Without further calculation, suggest with a reason how doubling the pressure in (b) is likely to affect the answer in (b)(v).
Answer
Doubling doubles the magnitude of , so the (negative) becomes about twice as large in magnitude.
From , therefore increases slightly, so the calculated would increase very slightly (negligible change because ).
Calculated specific heat capacity would be very slightly larger (effect negligible).
Background Concept
At constant external pressure, the work term scales as
With the first law (Cambridge convention)
rearranging gives
So changing changes the required heat transfer for the same .
Understanding the Question
You are asked to predict, without calculation, what happens to the answer for in (b)(v) if the external pressure is doubled.
The key idea is how depends on pressure and then how affects and hence .
Approach
- Note that for the expansion is essentially a material property for a given temperature change (so assume it is roughly unchanged).
- Doubling doubles the magnitude of .
- Use the sign of (negative for expansion) in .
- Since , infer how changes.
Step-by-Step Reasoning
- The block expands when heated, so (work done on the block) is negative.
- Magnitude of the work is . If is doubled and is approximately the same, then doubles.
- Because is negative, making its magnitude larger means becomes more negative.
- From
if becomes more negative, becomes more positive, so increases slightly.
5. Since
an increase in gives a (very slightly) larger value of .
6. The change is negligible because, in this question, is only of order whereas is of order .
Key Takeaways
- work scales linearly with pressure.
- For expansion, work done on the system is negative.
- If is fixed, changing changes the required , and hence the inferred .
Common Mistakes
- Saying decreases because “more work is done” without considering the sign.
- Assuming doubling pressure doubles (it doesn’t; is given as fixed in the question stem).
Things to Be Careful About
- The question asks “likely to affect” and “without further calculation”: a qualitative statement with a reason is sufficient.
- You must mention that the effect is very small in this case because is tiny compared with .
The equation of state for an ideal gas may be written as
where is the pressure of the gas, is the volume of the gas, is the Avogadro constant, is another constant and is the number of molecules of the gas.
Answer
is the thermodynamic (absolute) temperature of the gas (in kelvin).
Thermodynamic (absolute) temperature in kelvin.
Background Concept
In the ideal gas equation, temperature must be on an absolute scale so that it is proportional to the average kinetic energy of the molecules. The absolute (thermodynamic) temperature scale is the kelvin scale, with corresponding to absolute zero.
Understanding the Question
The question shows an ideal-gas-type equation and asks what the symbol means in that equation. It is not asking for a unit conversion or calculation—just the physical meaning.
Approach
Recognise that ideal gas equations use absolute temperature, not degrees Celsius. State this explicitly and include the kelvin scale.
Step-by-Step Reasoning
- The equation given is a form of the ideal gas equation.
- In all forms of the ideal gas equation, represents the absolute temperature.
- Therefore is measured in kelvin.
Key Takeaways
- In ideal gas equations, temperature is always absolute temperature ().
Common Mistakes
- Saying “temperature in degrees Celsius”: Celsius is not an absolute scale and is not used directly in relationships.
- Forgetting to indicate that it is the thermodynamic/absolute temperature.
Things to Be Careful About
- If numbers are involved (not here), convert from to using .
Working
For an ideal gas,
Multiply by :
So .
Answer
is the molar gas constant .
B is the molar gas constant R.
Background Concept
There are two common forms of the ideal gas equation:
- Using number of molecules :
where is the Boltzmann constant.
- Using amount of substance (in moles):
where is the molar gas constant and .
Understanding the Question
You are given
and told is the Avogadro constant () and is the number of molecules. You must identify what constant must be.
Approach
Rewrite the standard form into a form containing so you can match the coefficient of with .
Step-by-Step Reasoning
Start from the standard molecular form:
Multiply both sides by (where ):
Compare this with the given equation:
So the constant multiplying must match:
But , so:
Key Takeaways
- Matching algebraic forms is a fast way to identify unknown constants.
- links the “molecules” and “moles” versions of the ideal gas law.
Common Mistakes
- Stating : that would be true only if the equation were without the extra factor .
- Confusing (number of molecules) with (number of moles).
Things to Be Careful About
- Check which particle-count variable is used: (molecules) vs (moles).
- Ensure the constant you identify has the correct dimensional role: must be a constant that makes proportional to .
The product for an ideal gas is also given by
Answer
: mass of one molecule.
: mean value of (average of the square of the molecular speed).
m: mass of one molecule; <c^2>: mean square speed (average of c^2).
Background Concept
In kinetic theory, molecules in a gas have a distribution of speeds. We often work with averages:
- is the speed of one molecule.
- means “the average of over all molecules”.
The equation
relates macroscopic quantities (, ) to microscopic motion.
Understanding the Question
The question gives the kinetic theory expression for and asks for the meanings of:
So you must state what physical quantity each symbol represents.
Approach
Use the standard interpretation of symbols in the kinetic theory equation:
- is particle mass.
- is an average of the square of the speed.
Step-by-Step Reasoning
- counts molecules, so must be the mass per molecule (not per mole).
- Angle brackets denote an average.
- Therefore is the mean of across all molecules: the mean square speed.
Key Takeaways
- is a mean square quantity, not the square of the mean speed.
- RMS speed is related by .
Common Mistakes
- Writing “ is the r.m.s. speed”: the r.m.s. speed is the square root of .
- Taking to be molar mass instead of mass of one molecule.
Things to Be Careful About
- Be precise with wording: “mean square speed” (for ) vs “root-mean-square speed” (for ).
Use the equations in (a) and (b) to derive an expression, in terms of , and , for the mean kinetic energy of a molecule of the gas.
= ______
Working
From (a):
From (b):
Equate:
Mean kinetic energy per molecule:
Answer
EK = (3/2)(B/A)T
Background Concept
There are two key results being connected:
- Ideal gas equation (in a molecular form): is proportional to .
- Kinetic theory result:
The mean translational kinetic energy of one molecule is
so if you can express in terms of , you immediately get in terms of .
Understanding the Question
You are told two different expressions for :
- From (a): .
- From (b): .
You must combine them to find (mean kinetic energy of a molecule) in terms of , , and only.
Approach
- Rearrange the equation in (a) to make the subject.
- Set that equal to the kinetic theory expression for .
- Rearrange to find .
- Use .
Step-by-Step Reasoning
From (a):
Divide by :
From (b):
Since both equal the same quantity , equate them:
Cancel from both sides:
Multiply by :
Now convert mean square speed into mean kinetic energy per molecule:
This matches the well-known result because .
Key Takeaways
- If two expressions equal the same physical quantity (here ), you can set them equal to eliminate unwanted variables.
- The kinetic theory link between microscopic motion and temperature leads to .
Common Mistakes
- Using but then forgetting that .
- Forgetting to first rearrange (a) to get alone.
- Losing the factor of when equating the two expressions.
Things to Be Careful About
- Be clear that is per molecule (not total kinetic energy of all molecules).
- Algebraic cancellation: cancelling is valid because it appears as a factor on both sides.
- Keeping symbols consistent: is and is , so .
On Fig. 4.1, sketch the variation with of the root-mean-square (r.m.s.) speed of the molecules of an ideal gas.
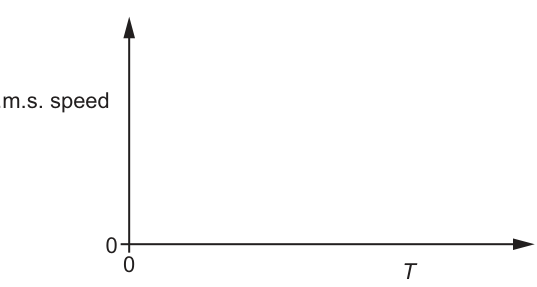
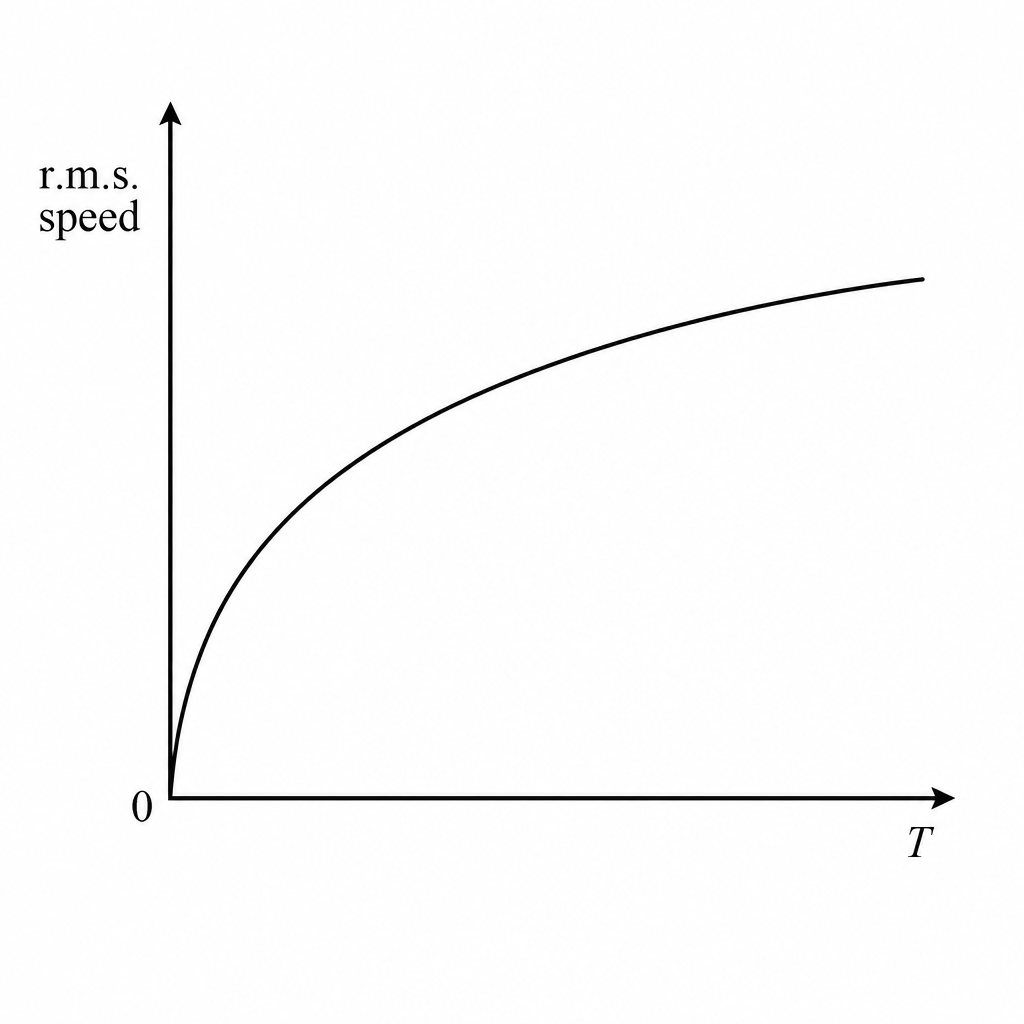
Answer
: curve passes through the origin and increases with decreasing gradient (concave down).
c_rms ∝ √T: through origin, increasing concave-down curve.
Background Concept
For an ideal gas, kinetic theory gives
so
The root-mean-square speed is defined by
Hence
So is proportional to .
Understanding the Question
You are asked to sketch how r.m.s. speed varies with on axes that both start at . This means your sketch should show:
- whether it passes through the origin,
- whether it is a straight line or a curve,
- whether the gradient increases or decreases.
Approach
Use the relationship . A square-root graph starts at the origin, rises quickly at first, and then rises more slowly (decreasing gradient).
Step-by-Step Reasoning
- From kinetic theory, .
- Taking the square root gives .
- At , , so the curve passes through .
- As increases, increases but with a decreasing slope, so the curve is concave down.
Key Takeaways
- For an ideal gas, molecular speeds scale as the square root of absolute temperature.
- Knowing a functional dependence () lets you sketch the correct qualitative graph.
Common Mistakes
- Drawing a straight line (): that would correspond to , which is incorrect.
- Drawing a curve that does not pass through the origin when axes begin at .
- Sketching a curve that is concave up (increasing gradient), which is not the shape of .
Things to Be Careful About
- must be in kelvin; the square-root relationship is with absolute temperature.
- The question asks for a sketch (shape), not numerical values or a detailed scale.
Answer
Simple harmonic motion is motion in which the acceleration is proportional to the displacement from a fixed equilibrium position and is directed towards the equilibrium.
Acceleration is proportional to displacement from equilibrium and directed towards equilibrium (a = -ω^2 x).
Background Concept
In oscillations, simple harmonic motion (SHM) is a special type of periodic motion where the restoring effect gets stronger the further you are from equilibrium.
The defining mathematical condition is:
where:
- is the displacement from equilibrium,
- is the acceleration,
- is the angular frequency,
- the negative sign means the acceleration is always towards equilibrium (opposite to the displacement).
Understanding the Question
You are asked to state what is meant by SHM. That means you must give the definition clearly (not derive anything), ideally including the idea of proportionality and direction.
Approach
Give the core statement: acceleration is proportional to displacement and directed towards equilibrium. Writing the standard equation makes this precise.
Step-by-Step Reasoning
- In SHM, when the object is displaced by , a restoring acceleration acts.
- The size of this acceleration increases in direct proportion to .
- The acceleration always points back towards equilibrium, so it has the opposite sign to .
- Hence the defining relation is .
Key Takeaways
- SHM is defined by an acceleration–displacement relationship.
- “Towards equilibrium” is captured by the negative sign in .
Common Mistakes
- Saying only “motion is sinusoidal” without linking acceleration to displacement.
- Missing the idea that the acceleration is towards equilibrium.
- Writing (wrong sign) without the negative.
Things to Be Careful About
- The definition uses acceleration, not velocity.
- “Proportional to displacement” and “directed towards equilibrium” are both required for full credit.
A block is suspended by a spring. The block oscillates vertically with simple harmonic motion.
The velocity of the block varies with time according to
where is in and is in .
Working
From , the angular frequency is .
Answer
0.39 s
Background Concept
For SHM, displacement, velocity, and acceleration are sinusoidal functions with the same angular frequency .
If a quantity is written in the form or , then the coefficient of is the angular frequency (in ).
Period and angular frequency are related by:
Understanding the Question
You are given the velocity-time equation:
and asked to calculate the period of the oscillation. The number multiplying is the key.
Approach
- Read off from the cosine.
- Substitute into .
Step-by-Step Reasoning
- Compare with , so .
- Compute the period:
So .
Key Takeaways
- In or , the coefficient of is .
- Always use when is given.
Common Mistakes
- Treating as the frequency (in Hz). It is not ; it is .
- Using which would only be correct if were .
Things to Be Careful About
- Units: is in , in .
- Rounding: giving or is appropriate.
Working
From :
For SHM, .
Answer
3.5 × 10^-2 m
Background Concept
In SHM, displacement can be written as:
Differentiating gives velocity:
So the maximum speed is:
This is a standard SHM result: the larger the amplitude and the higher the angular frequency , the larger the peak speed.
Understanding the Question
You are given:
This matches . So:
- the amplitude of the cosine, , is the maximum speed ,
- the coefficient of , , is .
You must find .
Approach
Use and rearrange to .
Step-by-Step Reasoning
- Identify the two key parameters:
- Substitute into the SHM relation:
- Express neatly:
This is .
Key Takeaways
- For SHM: .
- The amplitude of the velocity-time cosine/sine is the maximum speed.
Common Mistakes
- Using (confusing displacement amplitude with velocity amplitude).
- Using incorrectly because is already given.
Things to Be Careful About
- Keep units consistent: in .
- Recognise that , which helps for the next graph part where the -axis is in cm.
Use your answer in (b)(ii) to determine the equation for in terms of the displacement of the block, where is in and is in .
= ______
Working
For SHM,
With and ,
Answer
v = ±16√((0.035)^2 − x^2)
Background Concept
In SHM there is a standard link between speed and displacement.
Starting with:
we can write the velocity as:
Eliminate time using :
Rearranging gives the commonly used form:
The speed can be positive or negative depending on direction, so:
Understanding the Question
You have already found from part (ii). Now you must write an equation for in terms of (not ).
That means you must use a relationship that connects instantaneous speed to instantaneous displacement.
Approach
Use:
and substitute the numerical values of and .
Step-by-Step Reasoning
- Take the SHM speed–displacement equation:
- Substitute and :
- Square root both sides:
The is important: for the same value, the block passes twice each cycle with opposite velocity directions.
Key Takeaways
- You can eliminate time in SHM and relate directly to .
- The – relationship forms an ellipse when plotted.
Common Mistakes
- Forgetting the sign.
- Writing (wrong sign inside the root).
- Mixing units (e.g. using in cm while is in m) in the equation.
Things to Be Careful About
- The expression under the square root must be non-negative, so it only makes sense for .
- Ensure is in because the question states is in for this part.
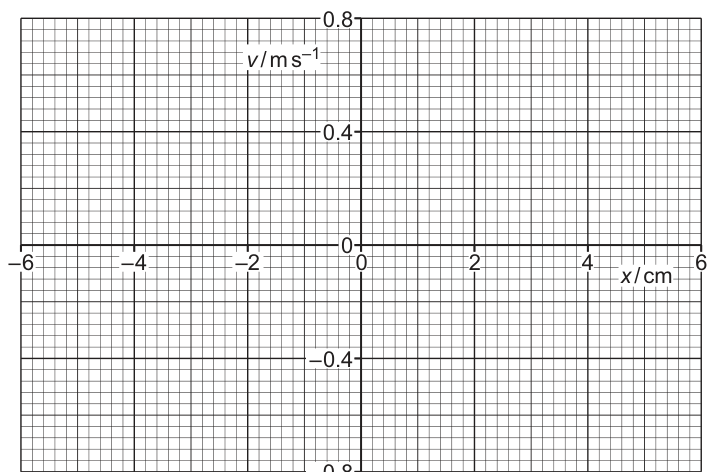
Answer
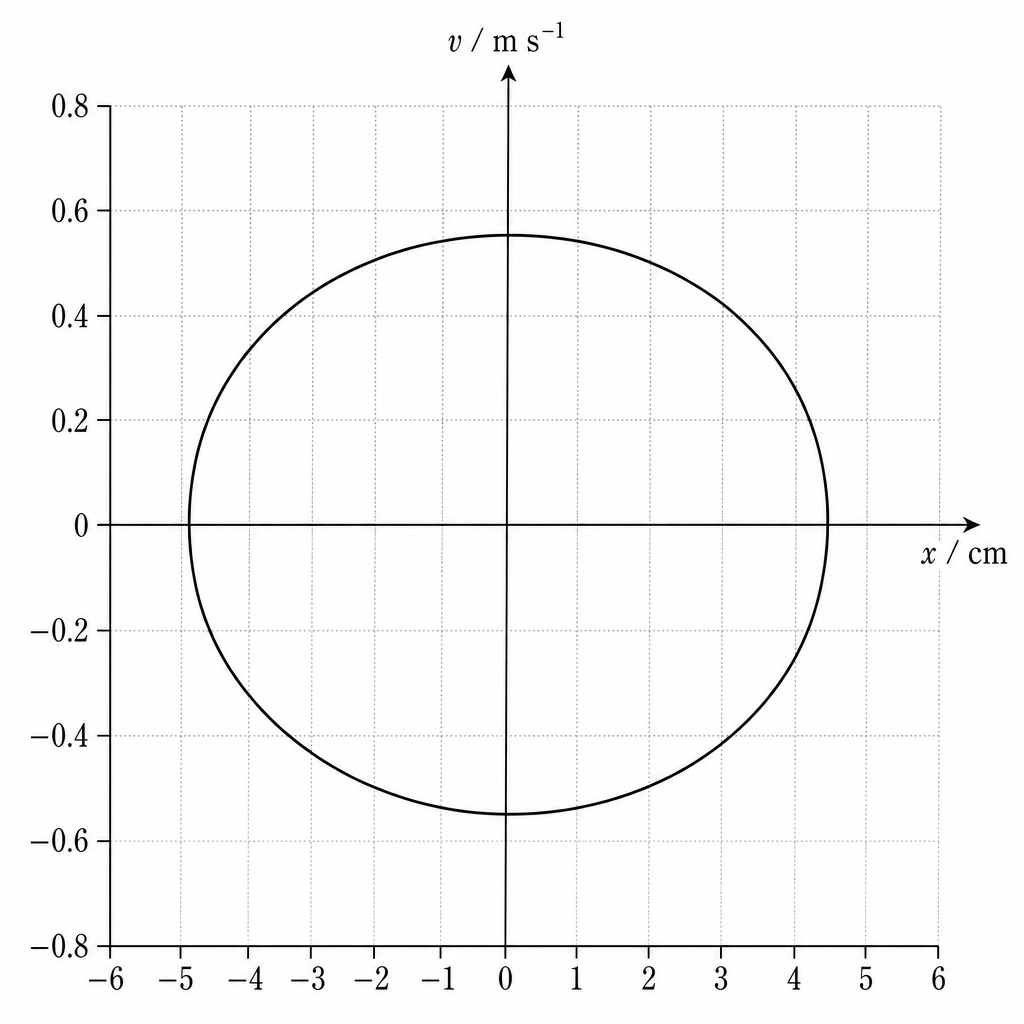
Ellipse on v–x axes with intercepts v = ±0.56 m s^-1 at x = 0 and x = ±3.5 cm at v = 0.
Background Concept
For SHM, velocity and displacement are related by:
This is the equation of an ellipse centered at the origin in an – plot.
Key features:
- When (passing equilibrium), is maximum: .
- When (turning points), .
- The graph is symmetric about both axes.
Understanding the Question
You must sketch against on axes where:
- vertical axis is from about to ,
- horizontal axis is from to .
From earlier parts:
- ,
- .
Approach
Mark the four key points first:
- and ,
- and .
Then draw a smooth ellipse through them, symmetric about both axes.
Step-by-Step Reasoning
- Convert amplitude to cm because the provided axis is in cm:
- Identify intercepts:
- At turning points, , so giving x-intercepts at .
- At equilibrium, , so giving y-intercepts at .
- Sketch:
- The curve must be closed (because the motion repeats).
- It must be smooth and symmetric about both axes.
- It should look like an ellipse that just touches those intercepts.
Key Takeaways
- A – graph for SHM is an ellipse.
- The intercepts correspond to turning points () and equilibrium ( maximum).
Common Mistakes
- Drawing a sine curve (that would be vs or vs , not vs ).
- Using directly on an axis labelled in cm (placing intercept at instead of ).
- Drawing two separate curves instead of one closed loop.
Things to Be Careful About
- Units on the axis: is in cm on the figure, so the amplitude must be plotted at .
- Ensure the maximum velocities are at , not at the ends.
- The sketch should be centered on the origin and symmetric (important for full sketch marks).
Two parallel metal plates X and Y are separated by a distance of , as shown in Fig. 6.1.
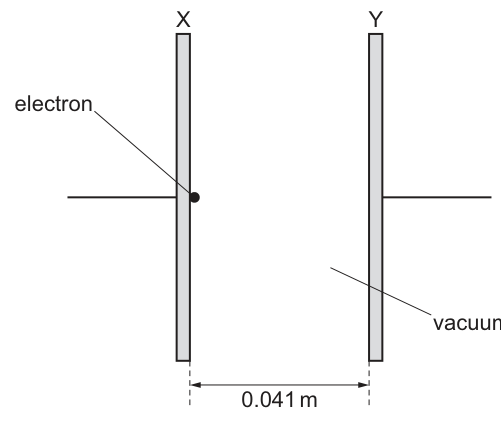
There is a vacuum between the plates. An electron is at rest at the centre of plate X.
A potential difference (p.d.) of is applied across the plates. This causes the electron to accelerate towards plate Y.
On Fig. 6.1, use the symbols + and – to indicate which of plates X and Y is the positive plate and which is the negative plate.
The electron accelerates towards plate Y, so the force on the electron is towards Y.
Since and is negative for an electron, the electric field is opposite to the force.
Hence is towards X, so Y must be the positive plate and X the negative plate.
Answer
Plate Y is and plate X is .
Plate Y is + and plate X is −.
Background Concept
The electric field direction is defined as the direction of the force on a positive test charge. In a uniform field between parallel plates, the field lines go from the positive plate to the negative plate.
For any charge in an electric field,
- If is positive, the force is in the same direction as .
- If is negative (an electron), the force is opposite to .
Understanding the Question
An electron starts from rest at plate X and accelerates towards plate Y. We must label which plate is positive and which is negative.
Approach
- Use the given acceleration direction to identify the force direction on the electron.
- Use with to relate force direction to field direction.
- Use the fact that points from to to decide the plate signs.
Step-by-Step Reasoning
- The electron accelerates towards Y, so its net force is towards Y (Newton's second law: acceleration is in direction of net force).
- For an electron, , so in the force is opposite to the electric field direction.
- Therefore the electric field must point towards X.
- Since electric fields point from the positive plate to the negative plate, the plate the field points towards is negative.
- So X is negative and Y is positive.
Key Takeaways
- Electric field direction is defined using a positive charge.
- Electrons move opposite to the electric field direction.
Common Mistakes
- Assuming the electron accelerates in the same direction as the electric field (forgetting the electron is negative).
- Reversing the rule that field lines go from to .
Things to Be Careful About
- Always separate these two ideas: (i) acceleration direction equals force direction, (ii) field direction is force direction only for a positive charge.
- Do not confuse the electron's motion direction with the field direction.
Calculate the electric field strength between the plates. Give a unit with your answer.
= ______ unit ______
Working
Answer
1.4 × 10^6 V m⁻1
Background Concept
Between large parallel plates with a potential difference and separation , the electric field is approximately uniform and has magnitude
Units: in volts, in metres, so is in (equivalently ).
Understanding the Question
We are given:
- separation
- potential difference
We need the electric field strength between the plates.
Approach
Use the uniform-field relation , ensuring is in volts and in metres, then quote the unit.
Step-by-Step Reasoning
Convert the p.d.:
Apply the formula:
Calculate:
Key Takeaways
- For uniform fields between parallel plates, is found from .
- Always convert kV to V and keep in metres.
Common Mistakes
- Using instead of (forgetting kilo).
- Using in cm or mm without converting to metres.
- Omitting the unit.
Things to Be Careful About
- Quote to a sensible number of significant figures (typically 2 s.f.).
- Use or , not both together.
Working
Answer
2.5 × 10^17 m s⁻2
Background Concept
A charge in an electric field experiences a force
The resulting acceleration is found from Newton's second law:
For an electron, the magnitude of charge is and its mass is .
Understanding the Question
We have already found the uniform field between the plates. The question asks for the acceleration of the electron due to the electric force.
Approach
- Find the magnitude of the electric force using (use magnitude ).
- Convert that force into acceleration using .
Step-by-Step Reasoning
Using the field from part (i), .
Force magnitude on the electron:
Acceleration magnitude:
So to 2 s.f.:
(Direction would be towards plate Y because the force on the electron is towards Y.)
Key Takeaways
- Combine with to get .
- For electrons, direction is opposite to the field, but the magnitude uses .
Common Mistakes
- Using for an electron and then giving the wrong direction (or mixing sign errors into the magnitude).
- Using the proton mass instead of the electron mass.
- Carrying forward an incorrect from part (i) due to kV conversion errors.
Things to Be Careful About
- Keep track of powers of ten: .
- The question asks for acceleration in ; ensure the final unit is correct.
Many electrons are now accelerated from rest from plate X to plate Y in Fig. 6.1. When the electrons hit plate Y, the absorption of their kinetic energies results in the emission of electromagnetic waves.
Working
Maximum photon energy equals the electron energy gain:
Answer
21 pm
Background Concept
Electrons accelerated through a potential difference gain kinetic energy equal to the electrical work done:
For an electron, the magnitude of this energy gain is .
When fast electrons strike a metal target, electromagnetic radiation can be produced. The maximum possible photon energy occurs if one electron transfers all its kinetic energy to a single photon:
Photon energy is related to wavelength by
So the maximum photon energy corresponds to the minimum wavelength:
Understanding the Question
Electrons start from rest at plate X and accelerate to plate Y through . When they hit plate Y, electromagnetic waves are emitted. We must show that the minimum wavelength is .
Approach
- Calculate the maximum energy available from one electron: .
- Assume a photon can take up to this energy, so set .
- Use to find .
Step-by-Step Reasoning
Energy gained by one electron:
Minimum wavelength occurs at maximum photon energy:
Convert metres to picometres ():
Key Takeaways
- Accelerating a charge through a p.d. gives energy .
- Minimum wavelength corresponds to maximum photon energy.
- Use to link energy and wavelength.
Common Mistakes
- Using instead of .
- Using unnecessarily (you are not asked to find ).
- Failing to convert metres to picometres correctly.
Things to Be Careful About
- Keep and in SI units so energy comes out in joules.
- Check powers of ten carefully; wavelength should be of order for X-rays.
Answer
X-rays.
X-rays
Background Concept
The electromagnetic spectrum is often identified by wavelength ranges:
- ultraviolet: roughly to
- X-rays: roughly to (i.e. to )
- gamma rays: typically shorter than about (definitions can overlap)
Understanding the Question
The minimum wavelength found is , which is . We must state the spectrum region.
Approach
Compare with typical wavelength ranges.
Step-by-Step Reasoning
Convert to nm:
This lies in the X-ray range, so the radiation is X-rays.
Key Takeaways
- Picometre to fraction-of-a-nanometre wavelengths correspond to X-rays.
Common Mistakes
- Stating gamma rays just because the wavelength is “very small” (but is commonly still classed as X-ray).
- Mixing up nm and pm.
Things to Be Careful About
- Spectrum boundaries are approximate; exam mark schemes usually expect “X-rays” for wavelengths around tens of pm from an X-ray tube.
Explain how these electromagnetic waves may be used to form images of internal body structures.
Answer
- X-rays pass through the body and are absorbed (attenuated) by different amounts in different tissues.
- Bone absorbs more than soft tissue, so the intensity reaching a film/detector varies across the beam, producing a contrast image of internal structures.
Different tissues attenuate X-rays by different amounts; a detector records the transmitted intensity pattern to give a contrast image.
Background Concept
X-ray imaging relies on attenuation: as X-rays pass through matter, their intensity decreases because photons are absorbed or scattered.
A simple model is:
where is incident intensity, is transmitted intensity, is thickness, and depends on the material (denser / higher atomic number materials generally attenuate more strongly).
An image is formed because different regions in the body attenuate the X-rays differently, leading to different transmitted intensities at the detector.
Understanding the Question
The waves produced when electrons hit plate Y are X-rays. The question asks how these waves are used to form images of internal body structures (i.e. the basic principle behind radiographs).
Approach
Explain:
- X-rays are partially transmitted through the body.
- Different tissues absorb different fractions of the X-rays (contrast).
- A detector (film or digital sensor) measures the transmitted intensity pattern to create the image.
Step-by-Step Reasoning
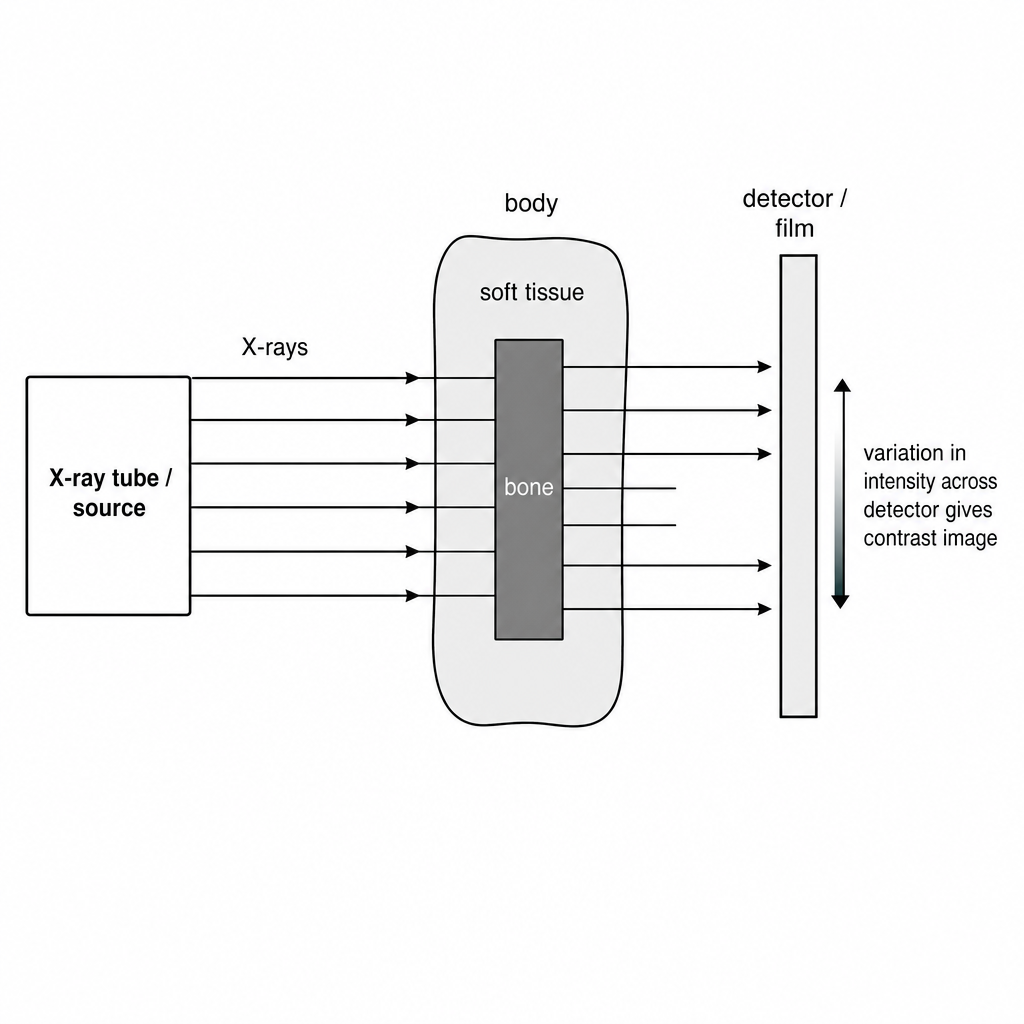
- A beam of X-rays is directed through the body towards a detector.
- As the beam passes through, some photons are removed from the beam by absorption/scattering.
- Bone (higher density and effective atomic number) attenuates X-rays more strongly than soft tissue, so fewer X-rays reach the detector behind bones.
- The detector records a spatial pattern of intensity: regions with low transmitted intensity correspond to more absorption (appear lighter on a negative film / different shade on a digital image), and regions with high transmitted intensity correspond to less absorption.
- This contrast reveals internal structures such as bones and some organs.
Key Takeaways
- Imaging needs two ingredients: transmission through the body and different attenuation in different tissues.
- The detector converts the transmitted intensity pattern into a visible image.
Common Mistakes
- Saying only “X-rays go through the body” without mentioning different absorption/attenuation (no mechanism for contrast).
- Claiming X-rays are “reflected” to form images (standard radiographs use transmission, not reflection).
Things to Be Careful About
- Use the term attenuation/absorption and link it to tissue type (bone vs soft tissue).
- Mention a detector/film; without it, there is no recorded image.
Fig. 7.1 shows a circuit containing a capacitor of capacitance and a resistor of resistance .
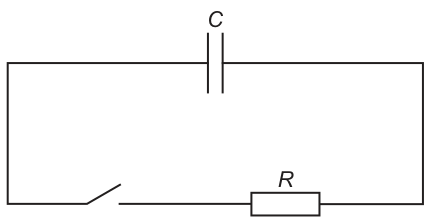
Initially, the switch is open and the potential difference (p.d.) across the capacitor is .
The switch is closed at time and the capacitor discharges through the resistor.
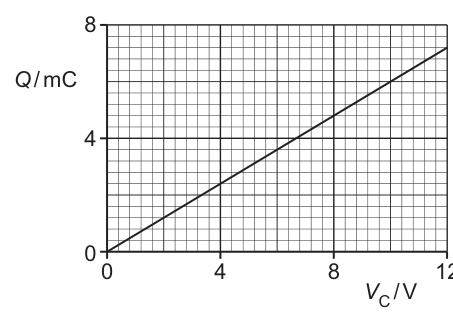
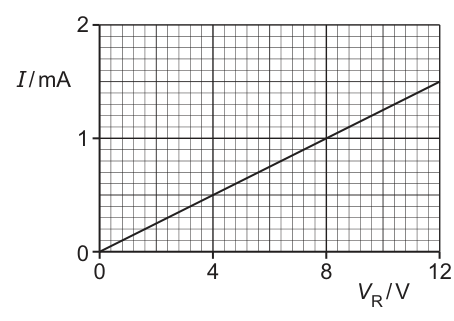
Fig. 7.2 shows the variation of the charge on the capacitor with the p.d. across the capacitor as the capacitor discharges. Fig. 7.3 shows the variation of the current in the resistor with the p.d. across the resistor as the capacitor discharges.
Answer
In the single-loop circuit during discharge, the p.d.s have the same magnitude:
Background Concept
When components are connected in a single loop, Kirchhoff’s loop law applies: the algebraic sum of potential differences around the loop is zero. For a discharging capacitor through a resistor, the capacitor provides a p.d. and the resistor has a p.d. drop.
Understanding the Question
You have just one resistor and one capacitor in a loop (with a switch). After the switch is closed and the capacitor discharges, the question asks how the p.d. across the capacitor is related to the p.d. across the resistor at the same instant.
Approach
Use Kirchhoff’s loop law for the only loop: the capacitor’s p.d. and the resistor’s p.d. must balance (equal magnitude, opposite sense).
Step-by-Step Reasoning
Going around the loop, the rise provided by the capacitor equals the drop across the resistor. Therefore their magnitudes are equal:
(If signs/polarities were included, you could also write depending on the chosen loop direction and polarity conventions.)
Key Takeaways
- In a single-loop discharge circuit, the only two p.d.s must match in magnitude.
- Polarity/sign depends on convention, but magnitude equality is the key idea.
Common Mistakes
- Saying is “greater than” during discharge; in this simple series loop they match at every instant.
- Forgetting that the sign can be opposite if you write a signed loop equation.
Things to Be Careful About
- The question asks for the relationship between and (usually magnitude). If writing a signed equation, make your polarity convention clear.
Determine:
Working
From Fig. 7.2, using point :
Answer
Background Concept
Capacitance is defined by
so a graph of against for a capacitor is a straight line through the origin with gradient equal to .
Understanding the Question
Fig. 7.2 gives a straight-line graph of charge (in mC) against capacitor p.d. (in V) as it discharges. You are asked to determine in .
Approach
Pick a clear point on the straight line (the mark scheme typically expects you to use the labelled point), calculate , then convert from farads to microfarads.
Step-by-Step Reasoning
Using the point shown: at , .
Convert charge to coulombs:
Now apply the definition:
Convert to microfarads using :
Key Takeaways
- The gradient of a – graph is the capacitance.
- Always convert mC to C before using .
Common Mistakes
- Treating as .
- Inverting the ratio and calculating .
- Giving the answer in F without converting to when asked.
Things to Be Careful About
- Use a point actually on the straight line (here the labelled point makes this unambiguous).
- Keep units consistent (C and V give F).
Working
From Fig. 7.3, using point :
Answer
Background Concept
For a resistor, Ohm’s law is
So a graph of against is a straight line through the origin with gradient .
Understanding the Question
Fig. 7.3 shows (in mA) against (in V) for the resistor during the discharge. You need in k.
Approach
Take a clear point on the straight line, convert mA to A, and use .
Step-by-Step Reasoning
From the labelled point: when , .
Convert current:
Now calculate resistance:
Key Takeaways
- From an – straight line, you can get using (or from gradient as ).
- Convert mA to A to avoid powers-of-ten errors.
Common Mistakes
- Using instead of .
- Forgetting to convert to , giving smaller by a factor of .
Things to Be Careful About
- Ensure you are using the resistor p.d. (not ), though in this circuit their magnitudes are equal during discharge.
Working
Answer
Background Concept
For a capacitor discharging through a resistor, the time constant is
It sets the timescale of the exponential decay: after time , and fall to of their initial values.
Understanding the Question
You have already determined and from the two straight-line graphs. This part asks for the time constant .
Approach
Multiply (in ) by (in F) to get in seconds.
Step-by-Step Reasoning
Using and :
Unit check:
So
Key Takeaways
- Time constant for an RC discharge is the simple product .
- Converting prefixes (k, ) correctly is essential.
Common Mistakes
- Using .
- Using as .
Things to Be Careful About
- Always convert to SI before multiplying: and F give seconds cleanly.
Use Fig. 7.2, Fig. 7.3 and your answer in (a) to explain why the variation of with is exponential in nature.
Answer
From Fig. 7.2, (straight line through origin).
From Fig. 7.3, (straight line through origin).
From (a), .
Since
then
so decays exponentially with (i.e. ).
Because , varies exponentially with .
Background Concept
In an RC discharge, the key ideas are:
- Capacitor relation:
- Resistor relation:
- Current is the rate of change of charge:
The minus sign shows that during discharge the charge on the capacitor is decreasing.
If you can show that the rate of decrease of is proportional to itself,
then the solution is an exponential decay:
For an RC circuit, .
Understanding the Question
You are given two straight-line graphs:
- Fig. 7.2: against .
- Fig. 7.3: against .
You must use those graphs plus the relationship from (a) between and to explain why vs is exponential.
Approach
Use each straight-line graph to extract a proportionality:
- Straight line through the origin means “directly proportional”.
Then connect the proportionalities using to show .
Finally use to obtain the differential equation whose solution is exponential.
Step-by-Step Reasoning
- From Fig. 7.2, the graph of against is a straight line through the origin. Therefore:
(Equivalently, where is the gradient.)
- From Fig. 7.3, the graph of against is also a straight line through the origin, so:
(Equivalently, where is the gradient.)
- From part (a) for this single-loop discharge circuit, the magnitudes of the p.d.s are equal at any instant:
So we can replace with in the proportionality from step 2:
- Combine with step 1 (): if both and are proportional to , then is proportional to :
More explicitly using the circuit equations:
- Now connect current to charge change:
Substitute :
or
- This has the form , whose solution is an exponential decay:
Hence varies exponentially with time.
Key Takeaways
- Straight line through origin on a graph implies direct proportionality.
- Using , the resistor’s – relation links directly to the capacitor’s – relation.
- Exponential decay comes from the differential equation .
Common Mistakes
- Claiming “it’s exponential because it’s an RC circuit” without showing the proportionality steps.
- Missing the key link .
- Forgetting to use the result from (a) to connect and .
Things to Be Careful About
- The negative sign matters: must decrease during discharge.
- Be clear that the graphs are straight lines through the origin; that is what justifies the proportionalities.
- If you write , remember this is the magnitude relation; the time-rate equation carries the negative sign via .
Fig. 8.1 shows a circuit that produces rectification of an alternating input voltage.
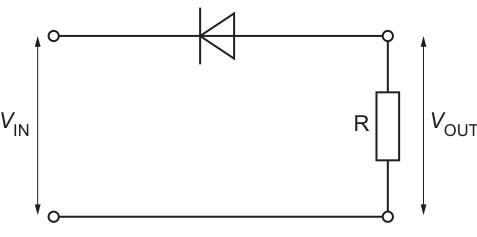
The input voltage is sinusoidal. The rectified output voltage is applied across resistor .
The variation of with time has amplitude and period , as shown in Fig. 8.2.
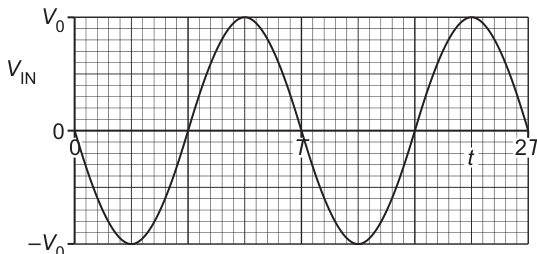
The root-mean-square (r.m.s.) value of is .
Answer
Half-wave rectification.
Half-wave rectification.
Background Concept
Rectification is the process of converting an alternating voltage (a.c.), which changes polarity, into a voltage that has only one polarity (d.c. pulses).
A diode is a component that conducts current in only one direction (forward bias) and blocks current in the reverse direction (reverse bias). In an a.c. circuit:
- During one half-cycle, the diode may be forward-biased and conduct.
- During the opposite half-cycle, the diode is reverse-biased and does not conduct.
If only one half of each cycle reaches the load resistor, the circuit produces half-wave rectification.
Understanding the Question
The circuit in Fig. 8.1 has a single diode in series with a resistor , and the output is taken across . The question asks what type of rectification results from this arrangement.
Approach
Decide whether the diode arrangement allows current through on:
- both half-cycles (full-wave), or
- only one half-cycle (half-wave).
A single diode in series means only one polarity of the input will produce current.
Step-by-Step Reasoning
- When the input polarity forward-biases the diode, current flows through and there is a non-zero .
- When the input polarity reverse-biases the diode, current is (ideally) zero, so .
- Therefore only one half-cycle appears across .
Hence the rectification is half-wave rectification.
Key Takeaways
- A single diode in series with a load gives half-wave rectification.
- Full-wave rectification requires a bridge rectifier (4 diodes) or a centre-tapped transformer with 2 diodes.
Common Mistakes
- Saying “full-wave” just because the output is always positive; you must check whether both halves are used.
- Confusing rectification with smoothing (which requires a capacitor).
Things to Be Careful About
- In ideal analysis (as used later in the question), assume the diode has zero p.d. when conducting and blocks completely when reverse-biased.
Working
For a sinusoid,
So
Answer
8.5 V
Background Concept
For a sinusoidal voltage
is the peak (amplitude). The r.m.s. value is defined as the square root of the mean value of over one full period. For a pure sine wave this leads to the standard result:
This is used because many electrical power equations (e.g. ) work with r.m.s. values for a.c.
Understanding the Question
The graph shows a sinusoidal input voltage with amplitude . You are told has r.m.s. value , and you must find the amplitude .
Approach
Use the sinusoidal relationship and rearrange to find .
Step-by-Step Reasoning
Start with
Rearrange:
Substitute :
To 2 significant figures (matching 6.0 V):
Key Takeaways
- For a sine wave, peak and r.m.s. are related by a factor of .
- Keep significant figures consistent with the data given.
Common Mistakes
- Using (inverting the relationship).
- Rounding too early (e.g. using can be okay, but keep enough precision).
Things to Be Careful About
- This part is about the input , which is a full sinusoid, not the rectified output.
- Quote the final answer with unit and sensible s.f.
Resistor has resistance .
Assume that there is no p.d. across the diode when it is conducting.
Working
Peak output p.d. across is (ideal diode).
Answer
1.6 W
Background Concept
For a resistor, instantaneous power is
and since ,
If the voltage across the resistor varies with time, then the power also varies with time.
In a half-wave rectifier with an ideal diode (zero p.d. when conducting), the load resistor sees:
- the positive half-cycle of the input voltage,
- and approximately on the negative half-cycle.
The peak output voltage across the resistor is therefore the same as the input peak .
Understanding the Question
You are given and told to assume the diode has no p.d. across it when conducting (ideal). You must find the peak power in the resistor. Peak power occurs when the resistor voltage is at its maximum value.
Approach
- Identify the peak voltage across (here it is ).
- Use .
Step-by-Step Reasoning
- At the top of a conducting half-cycle, the resistor has voltage .
- The corresponding power is
- Substitute and :
So .
Key Takeaways
- Peak power in a resistor depends on the square of the peak voltage.
- For an ideal diode, the peak output voltage equals the peak input voltage (during the conducting half-cycle).
Common Mistakes
- Using (missing the square).
- Using r.m.s. voltage instead of peak voltage when asked for peak power.
Things to Be Careful About
- The diode assumption matters: a real diode drop would slightly reduce the peak voltage and hence reduce .
- Keep enough precision in before squaring.
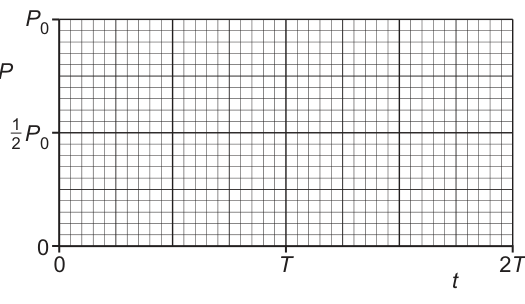
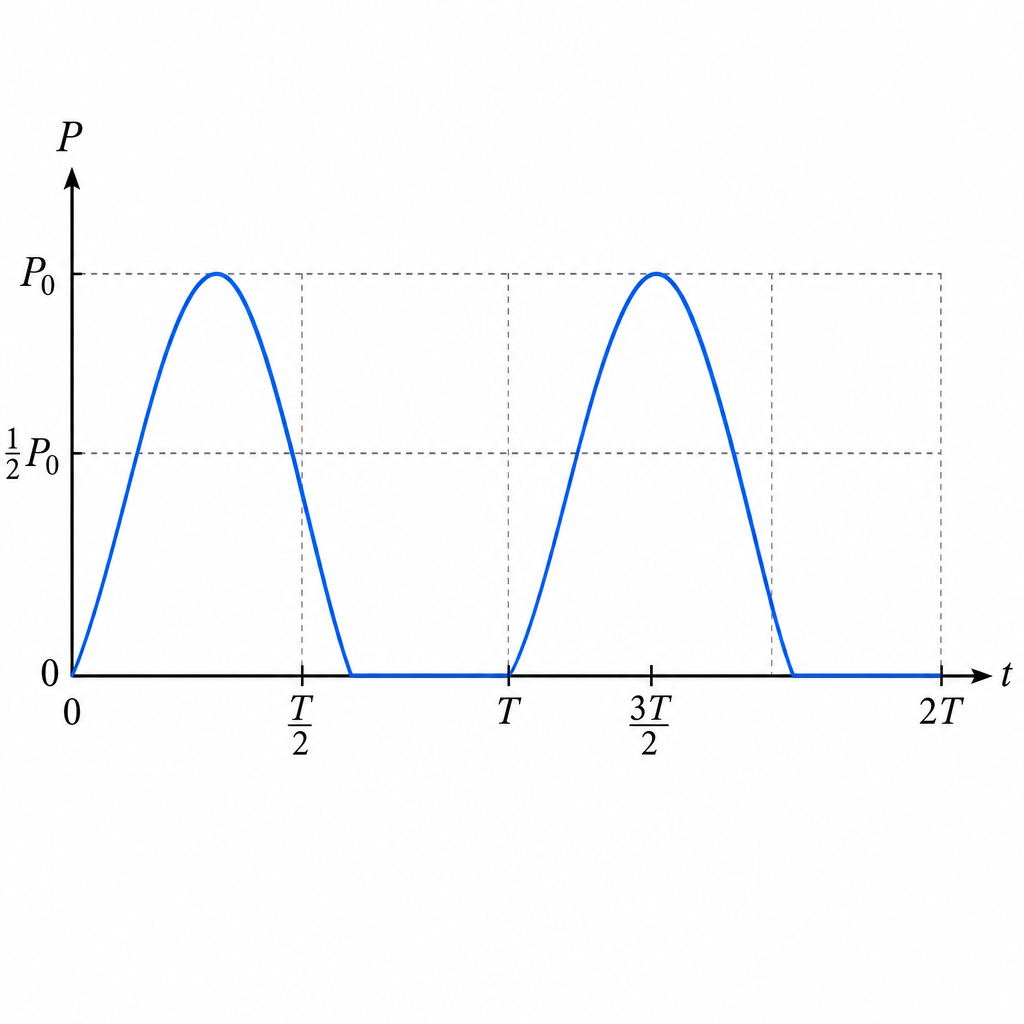
Answer
for each negative half-cycle.
For each positive half-cycle, follows a shape from up to and back to (peaks at and ).
Power is a sin^2 hump during each positive half-cycle (peak P0 at T/4 and 5T/4) and zero during each negative half-cycle.
Background Concept
If the voltage across a resistor is , the instantaneous power is
So if is sinusoidal, power involves the square of a sinusoid. Squaring makes all values non-negative and changes the shape:
For a half-wave rectifier, the output voltage across is:
- during the conducting half-cycle,
- during the blocked half-cycle.
Understanding the Question
You must sketch against from to . The axes are already provided, including the labelled levels , , and . The key is to show:
- two identical pulses in the interval to ,
- and zero power over the half-cycles when the diode does not conduct.
Approach
- Write power in terms of output voltage: .
- Determine for a half-wave rectifier.
- Sketch :
- when , then ;
- when is sinusoidal, follows a pulse.
Step-by-Step Reasoning
During a conducting (positive) half-cycle:
So
where
This pulse:
- starts at when ,
- rises to when (quarter-period into the pulse),
- falls back to at the end of that half-cycle.
During the non-conducting (negative) half-cycle, , so
Over to , you therefore draw:
- a “hump” from to peaking at ,
- a flat line at from to ,
- the same pattern again from to (peak at ).
Key Takeaways
- Power in a resistor depends on , so it is always non-negative.
- Half-wave rectification makes the output zero for half of each cycle.
- Squaring a sine gives a pulse with maximum at .
Common Mistakes
- Sketching negative power for the negative half-cycle (power cannot be negative in a resistor).
- Drawing a sine-shaped power graph instead of a -shaped graph.
- Forgetting the power is zero for an entire half-cycle (not just smaller).
Things to Be Careful About
- Place the peaks at and , not at .
- Ensure the curve touches the time axis at .
- Use the given vertical labels ( and ) to set the peak height correctly.
Working
When conducting,
Mean of over a half-cycle is , so mean power over the conducting half-cycle is .
Power is zero for the other half-cycle, so mean over a full cycle is
Answer
Mean power .
Mean power = (1/4) P0.
Background Concept
Mean power over a time interval is found by averaging :
Graphically, this is:
- area under the – graph over one period,
- divided by the period.
Also, a key mathematical result for a sinusoid is:
Understanding the Question
From your sketch in (b)(ii), power is present only during the conducting half-cycle and is zero for the other half-cycle. The question asks you to use that sketch to justify why the overall mean power is .
Approach
Break the cycle into two halves:
- Conducting half-cycle: , whose average value is .
- Non-conducting half-cycle: .
Then average those two halves over the full period.
Step-by-Step Reasoning
During the positive (conducting) half-cycle,
Over that half-cycle, the average of is , so the average power during the conducting half is
However, the diode blocks for the other half-cycle, so for half the time .
So over a full period, you spend:
- half the time at an average level ,
- half the time at .
Therefore the overall mean is
This matches the result required.
Key Takeaways
- Mean power is linked to area under the – curve.
- Squaring a sine gives a function with mean value over its cycle.
- Half-wave rectification introduces an additional factor of because power is zero for half the time.
Common Mistakes
- Using the mean of (which is zero) instead of the mean of .
- Forgetting that the power is exactly zero during the blocked half-cycle.
Things to Be Careful About
- The mean value applies to over the interval where it completes a full “arch” (e.g. to ).
- Keep clear which average you are taking: average during conduction vs average over the whole cycle.
Use the information in (b)(iii) to determine the r.m.s. value of .
r.m.s. voltage = ______
Working
But and , so
Hence
Answer
r.m.s. voltage
4.2 V
Background Concept
For a resistor, mean power can be written using r.m.s. voltage:
This is why r.m.s. values are so useful in a.c. circuits: they let you use the same form as for d.c. power.
Understanding the Question
You have already shown in (b)(iii) that the mean power in the resistor is , where is the peak power. You must use that to find the r.m.s. value of the rectified output voltage .
Approach
- Write in terms of using .
- Substitute and .
- Solve for .
Step-by-Step Reasoning
Start with the r.m.s. power relation for the output:
From (b)(iii):
Also from (b)(i):
Substitute into the mean power equation:
The cancels:
Take the square root:
With :
Key Takeaways
- Mean power in a resistor is linked to r.m.s. voltage by .
- For a half-wave rectified sine, leads to .
Common Mistakes
- Using (that would be for an un-rectified sine wave).
- Forgetting to square-root at the end (treating as ).
Things to Be Careful About
- This is for the rectified waveform, not the original input.
- Because , it is consistent that halving r.m.s. voltage would quarter the power, and vice versa.
Answer
The photoelectric effect is the emission of electrons from a metal surface when electromagnetic radiation is incident on it (provided the radiation has frequency above a threshold value).
Emission of electrons from a metal surface due to incident electromagnetic radiation (for frequency above a threshold).
Background Concept
The photoelectric effect is evidence that electromagnetic radiation transfers energy in discrete packets called photons. For a given metal, electrons are bound in the surface and require a minimum energy (the work function) to escape.
Understanding the Question
You are asked to state what the photoelectric effect means. The key points are: electrons are emitted from a metal surface, and the emission is caused by incident electromagnetic radiation (light, UV, etc.), with the important condition that the frequency must be sufficiently high.
Approach
Give a precise definition: what happens (electron emission), from where (metal surface), and what causes it (incident EM radiation), including the threshold-frequency condition.
Step-by-Step Reasoning
- Identify the phenomenon: electrons leave the metal surface.
- Identify the cause: incident electromagnetic radiation.
- Include the condition: emission occurs only if the frequency is above a threshold value for that metal.
Key Takeaways
- Photoelectric effect = electron emission due to incident EM radiation.
- There is a threshold frequency for each metal.
Common Mistakes
- Saying “more intense light always ejects electrons” (intensity affects current, not whether emission happens).
- Missing that electrons are emitted from a metal surface.
- Not mentioning the threshold frequency condition.
Things to Be Careful About
- Use “electrons” (or “photoelectrons”), not “photons are emitted”.
- Frequency/threshold is more fundamental than “brightness” for the onset of emission.
The photoelectric effect is investigated in two stages using the circuit shown in Fig. 9.1.
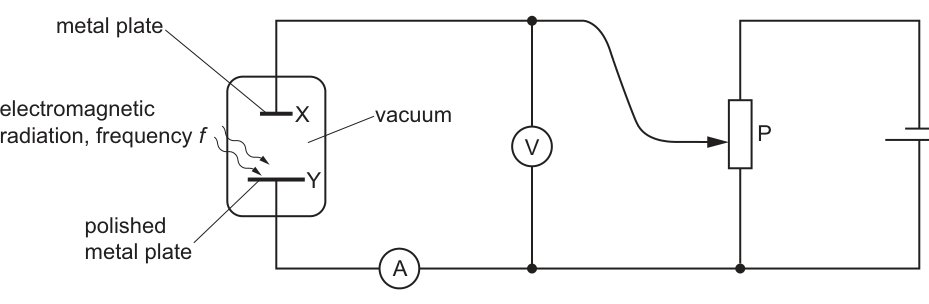
The polished metal plate Y is illuminated with electromagnetic radiation of frequency and constant power.
In stage 1 of the investigation, frequency is set to a constant value of . The current in the ammeter is varied by adjusting the potentiometer P. Fig. 9.2 shows the variation of with the voltmeter reading . There is a value of at which the current just falls to zero.
In stage 2 of the investigation, stage 1 is repeated for different values of frequency. As frequency is varied, the voltmeter reading at which the current just falls to zero is measured. Fig. 9.3 shows the variation of with .
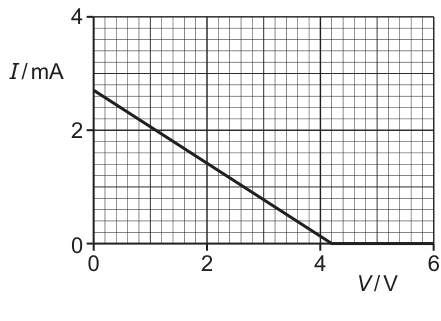
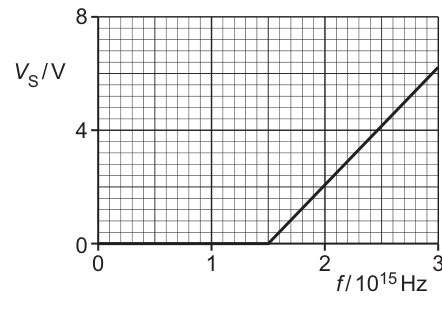
Explain, with reference to photons, why depends on the frequency of the incident electromagnetic radiation.
Answer
Photon energy is . Electrons require energy (work function) to escape, so
The stopping potential is when even the most energetic electrons are stopped:
Hence increases when increases (since increases).
Because photon energy increases with , so increases and therefore gives larger for higher .
Background Concept
Light can be treated as photons with energy
where is the Planck constant and is the radiation frequency. In the photoelectric effect, an electron needs at least the work function (energy needed to escape the metal). Any extra photon energy becomes the electron’s maximum kinetic energy:
A stopping potential is a reverse potential difference that just prevents the fastest photoelectrons from reaching the collector. The electrical work done in stopping an electron of charge is , so at the stopping condition:
Understanding the Question
In the experiment, the frequency is changed (while power is constant). The question asks why the measured stopping potential changes when changes, and it specifically wants the explanation in terms of photons.
Approach
Connect the chain:
- photon energy depends on frequency ();
- maximum electron kinetic energy depends on photon energy minus work function ();
- stopping potential is proportional to via .
Therefore, changing changes .
Step-by-Step Reasoning
- Increase frequency .
- Photon energy increases because .
- The metal requires the same work function (property of the metal surface), so the “leftover” energy for the fastest electrons increases:
- To stop these faster electrons, the reverse potential difference must do more work per electron, i.e. must be larger.
- Using
a larger means a larger .
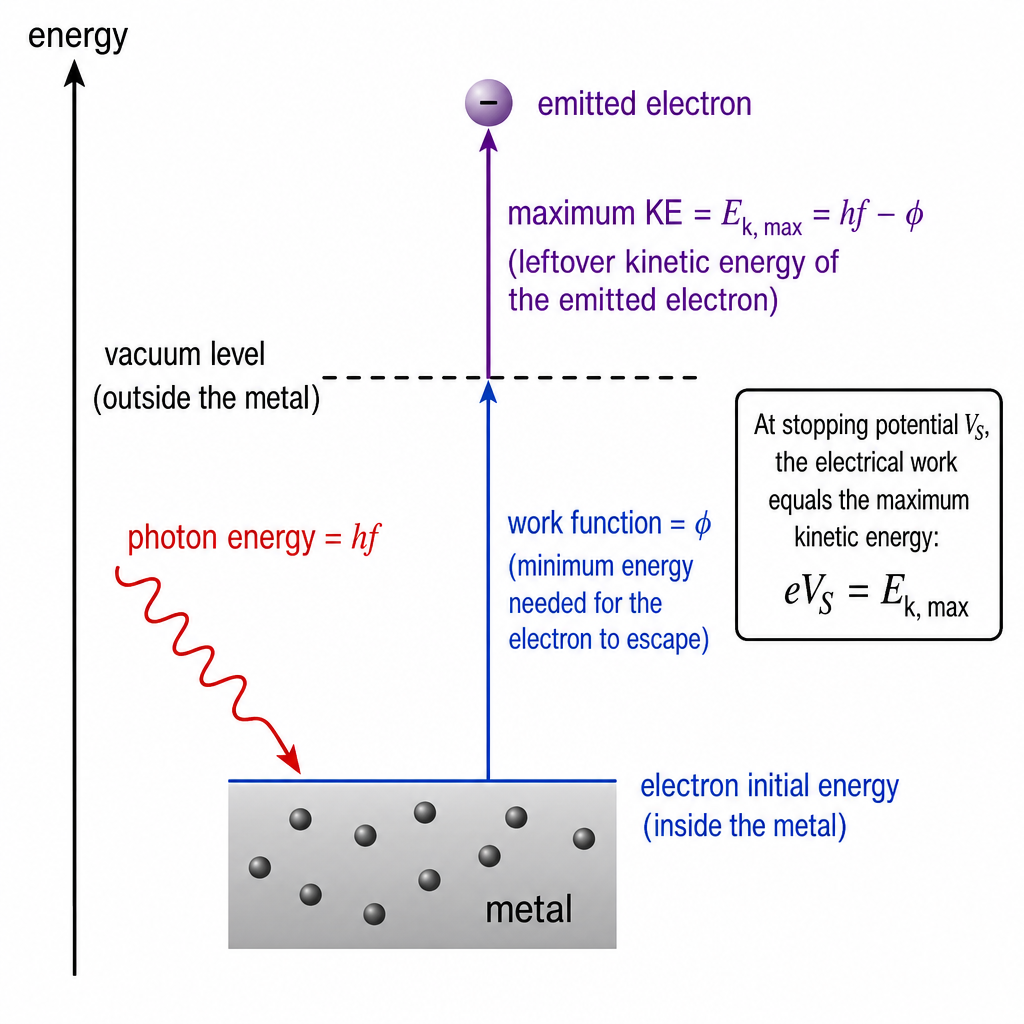
Key Takeaways
- Frequency controls photon energy.
- Work function is a fixed “energy cost” for a given metal.
- Stopping potential measures maximum kinetic energy: .
Common Mistakes
- Saying depends on intensity/power (with constant frequency, intensity mainly changes the current, not the stopping potential).
- Forgetting the work function term .
- Mixing up with (you must multiply by charge to get energy).
Things to Be Careful About
- is linked to the maximum kinetic energy, not the average.
- Use the electron charge as if a numerical conversion is needed.
- The graph of vs should be linear for a clean photoelectric effect because .
State three quantitative conclusions that can be drawn from the results in Fig. 9.2 and Fig. 9.3. Use the space for any working.
Working
From Fig. 9.2, stopping voltage:
From Fig. 9.3, threshold frequency ():
Gradient of Fig. 9.3:
Since , gradient so
Answer
(for );
;
.
V_S ≈ 4.4 V; f0 ≈ 1.4×10^15 Hz; h ≈ 6.6×10^-34 J s.
Background Concept
Two standard photoelectric results are used here:
- Stopping potential is related to the maximum kinetic energy of emitted electrons:
- Photoelectric equation:
Combining gives a straight-line relationship:
So on a graph of against :
- gradient ,
- -axis intercept (where ) is the threshold frequency .
Understanding the Question
You have two graphs:
- Fig. 9.2: current vs applied potential difference for a fixed frequency. The key quantitative point is where the current becomes zero (the stopping potential for that frequency).
- Fig. 9.3: stopping potential vs frequency . The key quantitative points are the threshold frequency (where ) and the gradient (to obtain and hence ).
You are asked for three quantitative conclusions, so you should extract numerical values (with units) from these graphs, possibly using calculation.
Approach
Pick three solid numerical outcomes available from the graphs:
- from Fig. 9.2 (the value where ).
- from Fig. 9.3 (the value where ).
- Use the straight-line gradient of Fig. 9.3 to calculate via gradient .
Step-by-Step Reasoning
-
Stopping potential from Fig. 9.2
- Find the point where the line meets .
- Read .
- This is the stopping voltage for the stage-1 frequency.
-
Threshold frequency from Fig. 9.3
- Threshold frequency is where emitted electrons have zero maximum KE, so .
- Read the -axis intercept: .
-
Planck constant from gradient of Fig. 9.3
- Choose two well-separated points on the best-fit line (the question provides a clear point at and the intercept ).
- Calculate gradient:
- From , gradient .
- Multiply by to get :
(Other valid quantitative conclusions could include the saturation current from Fig. 9.2, or the work function from , but only three are required.)
Key Takeaways
- is read where on an – graph.
- is read where on a – graph.
- The linear form lets you obtain constants from gradient/intercept.
Common Mistakes
- Using the point at to read (stopping potential is where , not where ).
- Forgetting that the frequency axis in Fig. 9.3 is scaled by .
- Calculating the gradient using instead of .
- Treating the gradient as rather than .
Things to Be Careful About
- Include units: in volts, in hertz, gradient in , and in .
- Use two far-apart points to reduce percentage reading error in the gradient.
- Keep consistent significant figures with what can be read from the graphs (typically 2–3 s.f.).
Radioactive decay is a spontaneous process.
State the meaning, in this context, of the term spontaneous.
Answer
Spontaneous means the decay occurs randomly by itself and is not triggered or affected by external physical conditions (e.g. temperature/pressure).
Decay occurs randomly by itself and is not affected by external physical conditions.
Background Concept
Radioactive decay happens because an unstable nucleus can change into a more stable nucleus by emitting radiation (alpha, beta, gamma). The key idea is that we cannot predict exactly when any particular nucleus will decay.
"Spontaneous" in this topic means:
- the decay event is not caused by an external trigger, and
- the probability of decay is not changed by ordinary external conditions such as temperature, pressure, chemical state, or electric/magnetic fields.
Understanding the Question
The question is asking for the meaning of the word spontaneous specifically in the context of radioactive decay. It wants the standard physics meaning (random/untriggered), not a general English meaning.
Approach
State the two essential features that exam mark schemes usually credit:
- decay is random for an individual nucleus, and/or
- decay is independent of external conditions.
Step-by-Step Reasoning
- A nucleus decays without needing anything to “start” it, so it is not triggered by collisions, heating, shining light, etc.
- You also cannot say when a particular nucleus will decay: it is random (only the statistical behaviour of many nuclei is predictable).
Key Takeaways
- Spontaneous = random and not influenced by external physical conditions.
- Predictable behaviour comes from large numbers of nuclei, not individual ones.
Common Mistakes
- Saying only “it happens quickly” or “it happens naturally” (too vague).
- Confusing spontaneous with “instantaneous”.
Things to Be Careful About
- The question says “in this context”: use the nuclear-physics definition, not a general one.
- It is safest to include the idea “not affected by external conditions” because it is a common marking point.
Two radioactive isotopes X and Y each decay to form a stable isotope.
A sample initially contains only atoms of isotope X. At this time, its activity is .
Another sample initially contains only atoms of Y. At this time, its activity is .
Fig. 10.1 shows the variation of the activity of each sample with time between and .
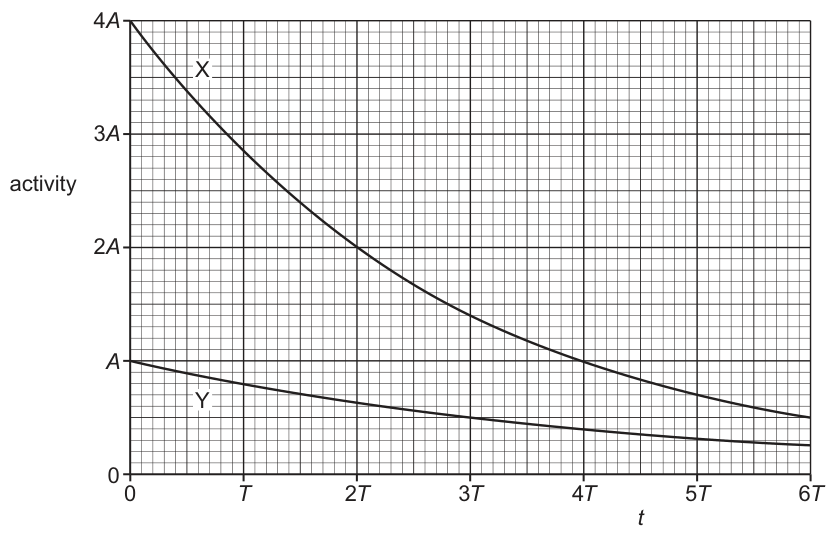
Complete Table 10.1 to give expressions, in terms of either or both of and , for the quantities indicated for each of the samples.
Table 10.1
| sample | half-life | decay constant | initial activity | initial number of nuclei |
|---|---|---|---|---|
| X | ||||
| Y |
Working
From the graph:
- For X: at and at so .
- For Y: at so .
Decay constant:
So
Initial number of nuclei, using :
Answer
- Sample X: half-life , decay constant , initial number .
- Sample Y: half-life , decay constant , initial number .
X: t1/2 = T, λ = (ln2)/T, N0 = 4AT/(ln2). Y: t1/2 = 4T, λ = (ln2)/(4T), N0 = 4AT/(ln2).
Background Concept
Two key relationships are used in this question.
-
Half-life is the time for the activity (or number of undecayed nuclei) to halve.
-
Decay constant is related to half-life by
- Activity is the rate of decay:
where is activity in (Bq) and is the number of undecayed nuclei.
Understanding the Question
You are given two separate samples:
- sample X has initial activity and its activity drops faster,
- sample Y has initial activity and drops more slowly.
From the activity-time graph you must:
- read the half-life of each sample,
- calculate each decay constant,
- use to find the initial number of nuclei in each sample.
Approach
- Use the graph to find the time taken for the activity to halve (that is the half-life).
- Convert half-life to decay constant using .
- Rearrange to and substitute each sample’s initial activity.
Step-by-Step Reasoning
1) Half-life of X
- X starts at .
- One half-life later it should be .
- The graph indicates this occurs at (and at it has reached , which is two halvings).
So
2) Half-life of Y
- Y starts at .
- Half of this is .
- The graph shows at .
So
3) Decay constants
Use
So
4) Initial number of nuclei
Rearrange :
For X, initial activity is :
For Y, initial activity is :
It is not a problem that and come out the same here: X has a larger initial activity because it has a larger decay constant.
Key Takeaways
- Read half-life directly from the graph by finding the time to halve the activity.
- Convert between and using .
- Use to link activity to number of nuclei.
Common Mistakes
- Using (missing ).
- Taking X’s half-life as because it reaches at (but is one quarter of , i.e. two half-lives).
- Forgetting to use the initial activity when calculating .
Things to Be Careful About
- Check whether the graph point corresponds to a half () or a quarter () of the initial activity.
- Keep symbols clear: is used as a labelled activity unit on the vertical axis; is the decay constant.
Determine, in terms of , the time at which the two samples will have equal activities.
time = ______
Working
For X, :
For Y, :
Equal activities:
Write :
So
Answer
8/3 T
Background Concept
Radioactive activity decreases exponentially. In terms of half-life, it is often convenient to write
where is the initial activity and is the half-life.
This form works because each interval of one half-life multiplies the activity by .
Understanding the Question
You have two samples with different starting activities and different half-lives (found from the graph in part (b)(i)). The question asks for the time (as a multiple of ) when their activities are the same.
Given (from the graph):
- Sample X: ,
- Sample Y: ,
Unknown: the time when .
Approach
- Write an activity-time expression for each sample using the half-life form.
- Set them equal and solve for .
- Use powers of 2 to avoid messy logarithms (because half-life naturally uses factors of ).
Step-by-Step Reasoning
1) Write activity expressions
For X:
For Y:
2) Set them equal
Cancel :
3) Convert to base 2 and solve
Since and :
Combine the left-hand powers:
If the bases are equal, the exponents must be equal:
Multiply by :
So
Key Takeaways
- Use when half-lives are given.
- When equating two exponentials with the same base, equate the exponents.
- A faster-decaying sample can start higher but still meet a slower-decaying one later.
Common Mistakes
- Using the wrong half-lives (e.g. taking X’s half-life as ).
- Forgetting to include the different initial activities and .
- Adding exponents incorrectly when manipulating powers of 2.
Things to Be Careful About
- Keep the ratio dimensionless.
- Give the final answer in the requested form “___ ”; is the clean exact form.
A radiation detector is placed near to one of the samples in (b).
Explain why the count rate measured by the detector is less than the activity of the sample.
Answer
The activity is the total decay rate of the source, but the detector counts only decays whose radiation reaches it.
- Only a fraction of the emitted radiation enters the detector (limited solid angle / some absorbed in air or container).
- The detector does not detect every particle/quantum that enters (detection efficiency / dead time).
Only a fraction of emitted radiation reaches the detector and the detector is not 100% efficient (e.g. absorption/geometry and detector efficiency/dead time).
Background Concept
Activity is defined as the number of decays per second occurring in the source:
This counts all decay events in the sample, regardless of where the emitted radiation goes.
A radiation detector measures a count rate, which is the number of detection events per second recorded by the detector. The count rate depends on how much of the emitted radiation reaches the detector and how well the detector detects it.
Understanding the Question
A detector is placed near one sample. You are asked why the measured count rate is smaller than the sample’s activity. So you must compare:
- activity = total decays per second in the sample,
- count rate = detected events per second at the detector.
Approach
Give two separate, creditworthy reasons:
- geometrical/absorption reason: not all emitted radiation reaches the detector,
- detector reason: even radiation that reaches the detector may not be counted.
Step-by-Step Reasoning
- When nuclei decay, radiation is emitted in many directions. If the detector has a finite area at some distance, it subtends only a small solid angle, so it intercepts only a fraction of the emissions.
- Some radiation may be absorbed or scattered before reaching the detector (by the source material itself, its container, and the air), further reducing the number arriving.
- Even for radiation that enters the detector, the detector may have efficiency < 1: not every particle/photon produces a count (depends on detector type and energy).
- Many detectors also have dead time, a short time after each event when they cannot register another event, reducing measured count rate when activity is significant.
Key Takeaways
- Activity refers to the source; count rate refers to the detector.
- Count rate is reduced by geometry, absorption, and detector inefficiency (including dead time).
Common Mistakes
- Saying only “some radiation is lost” without stating how (solid angle, absorption, efficiency).
- Confusing activity with count rate and implying they should be identical.
Things to Be Careful About
- State at least two distinct reasons for 2 marks.
- Avoid vague statements like “human error”; this is a physical limitation of detection.