Physics 9702/42 — October/November 2024
Cambridge A-Level · A Level Structured Questions · worked solutions for every part, with the mark scheme
Topics Electric Fields · Motion in a Circle · Magnetic Fields · Gravitational Fields · Astronomy and Cosmology · Temperature · +7 more
A metal wheel consists of an axle A, eight spokes and a rim, as shown in Fig. 1.1.
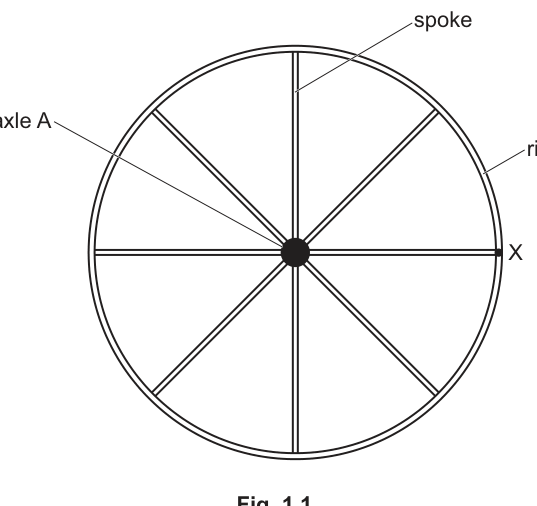
Point X is on the rim at the end of one of the spokes.
The rim has a radius of .
The wheel is rotating clockwise with an angular speed of .
For point X, determine:
Working
Answer
1.2 × 10^2 m s^-1
Background Concept
For motion in a circle, a point at radius has tangential (linear) speed related to angular speed by
Here:
- is in ,
- is in ,
- comes out in .
Understanding the Question
Point X is on the rim, so its distance from the axle is the wheel radius . The wheel rotates with angular speed . The question asks for the speed (magnitude of tangential velocity) of X.
Approach
Use the direct circular-motion link between angular and linear speed:
- Identify for point X.
- Calculate .
- Round sensibly based on given data (both and are 2 s.f.).
Step-by-Step Reasoning
- Write the relationship:
- Substitute and :
- Quote to 2 s.f. (limited by inputs):
Key Takeaways
- For uniform circular motion, linear speed is proportional to radius: .
- Use the radius of the point in question (rim point uses the wheel radius).
Common Mistakes
- Using diameter instead of radius.
- Using or unnecessarily and then introducing an arithmetic error.
- Rounding to too many significant figures compared with the data.
Things to Be Careful About
- Ensure is in metres and in .
- "Speed" is a scalar; no direction is required here.
Working
Answer
1.7 × 10^4 m s^-2
Background Concept
In uniform circular motion, the velocity direction changes continuously, requiring an inward (centre-seeking) acceleration called the centripetal acceleration:
This acceleration always points towards the centre of the circle.
Understanding the Question
Point X is on the rim, so . The angular speed is . We must calculate the magnitude of centripetal acceleration of X.
Approach
Use the form that matches the data given. Since and are given directly, use
Step-by-Step Reasoning
- Start with
- Substitute:
- Calculate :
- Round to 2 s.f.:
Key Takeaways
- Centripetal acceleration depends on both angular speed and radius: doubling makes four times bigger.
- Use when is given.
Common Mistakes
- Using (missing the square).
- Using incorrectly as (diameter).
- Forgetting units or writing incorrect units.
Things to Be Careful About
- Even though the wheel rotates clockwise, the question asks only for the magnitude; direction (towards the centre) is not required unless asked.
There is a uniform magnetic field of flux density into the plane of the page.
Answer
The induced e.m.f. (and current) is in a direction such that the magnetic field it produces opposes the change in magnetic flux (flux linkage) that causes it.
Induced e.m.f./current acts to oppose the change in magnetic flux (linkage) producing it.
Background Concept
Electromagnetic induction occurs when the magnetic flux (or flux linkage) through a circuit changes, producing an induced e.m.f. Faraday’s law gives the magnitude:
The negative sign is Lenz’s law: it sets the direction of the induced e.m.f./current.
Understanding the Question
You are asked to state Lenz’s law (no numbers needed). The wheel later rotates in a magnetic field, so the law will be used to decide the direction of induced effects.
Approach
Give a clear one-sentence statement connecting:
- induced e.m.f./current direction
- opposition to the change in flux (or flux linkage) that produces it.
Step-by-Step Reasoning
A correct statement must include two ideas:
- A changing flux causes an induced e.m.f./current.
- The induced current produces a magnetic field that opposes the change in flux.
So, you state that the induced e.m.f./current acts to oppose the change in magnetic flux (linkage).
Key Takeaways
- Lenz’s law is about direction: induced effects oppose the change that created them.
- It is effectively an energy-conservation idea: you cannot get energy “for free” from induction.
Common Mistakes
- Saying the induced current opposes the magnetic field itself (it opposes the change in flux).
- Only stating “the induced e.m.f. is negative” without explaining what is opposed.
Things to Be Careful About
- Either “flux” or “flux linkage” is acceptable if used correctly.
- Mentioning “opposes the change” is essential; leaving out “change” loses the key meaning.
Working
Answer
45 ms
Background Concept
For uniform circular motion, angular speed and period are related by
because one full revolution corresponds to an angular displacement of radians.
Understanding the Question
You are given and asked to show the time for one revolution is . That time is the period .
Approach
- Use .
- Rearrange to .
- Calculate in seconds then convert to milliseconds.
Step-by-Step Reasoning
Rearrange:
Substitute :
Convert using :
Key Takeaways
- One revolution is always radians.
- is often the quickest route.
Common Mistakes
- Using (missing the ).
- Forgetting to convert seconds to milliseconds.
Things to Be Careful About
- Radians are dimensionless, so in is consistent with .
- Rounding: is correctly written as .
Calculate the magnetic flux cut by spoke AX during one revolution of the wheel.
Give a unit with your answer.
magnetic flux = ______ unit ______
Working
Area swept by spoke in one revolution:
Magnetic flux cut:
Answer
0.41 Wb
Background Concept
Magnetic flux through an area is
where:
- is magnetic flux density,
- is the area,
- is the angle between and the normal to the area.
Here the field is into the page and the wheel is in the plane of the page, so is perpendicular to the wheel. That makes and , so .
The phrase “flux cut” in this context refers to the amount of flux associated with the area swept out by the conductor as it rotates.
Understanding the Question
Spoke AX has length equal to the wheel radius . In one full revolution, the spoke sweeps out the entire circular area of radius . With uniform into the page, the flux corresponding to that swept area is required.
Approach
- Work out the swept area in one revolution: a full circle of radius .
- Use (since the field is normal to the area).
- Include the correct unit: webers (Wb), because .
Step-by-Step Reasoning
- Swept area in one revolution:
Calculate:
so
- Flux through that area (field perpendicular):
- Convert unit to Wb:
Key Takeaways
- If is perpendicular to the plane, .
- A rotating radius sweeps out a full circle in one revolution, so .
- Flux unit: .
Common Mistakes
- Using (confusing area with circumference).
- Using (only a semicircle).
- Forgetting that here and incorrectly including a cosine less than 1.
- Missing the unit or giving without recognising it as Wb.
Things to Be Careful About
- The radius is , not the diameter.
- Keep enough precision in intermediate steps to avoid rounding error; round at the end.
Determine the magnitude of the electromotive force (e.m.f.) induced across spoke AX.
induced e.m.f. = ______
Working
From (iii), flux cut in one revolution:
Time for one revolution:
Average induced e.m.f.:
Answer
9.1 V
Background Concept
Faraday’s law links induced e.m.f. to the rate of change of magnetic flux linkage. For one conductor cutting flux, an average e.m.f. over a time interval can be found from
(The sign is set by Lenz’s law, but this question asks for the magnitude.)
Understanding the Question
Over one full revolution, spoke AX sweeps out a full circular area, so it “cuts” a certain amount of magnetic flux (found in part (iii)). The time for one revolution is the period (found in part (ii)). The question asks for the magnitude of induced e.m.f. across the spoke.
Approach
- Take as the flux cut in one revolution.
- Take as the time for one revolution.
- Use .
Step-by-Step Reasoning
- Use the value from (iii):
- Use the period from (ii):
- Apply Faraday’s law (average over the revolution):
So
(You may also see the equivalent generator result for a rotating spoke: , which gives the same number.)
Key Takeaways
- Induced e.m.f. magnitude is proportional to how quickly flux is cut.
- Using one-revolution quantities: .
Common Mistakes
- Using but taking as or (wrong geometry).
- Forgetting to convert to seconds before dividing.
- Including a negative sign when the question asks for magnitude.
Things to Be Careful About
- Use consistent units: Wb and s gives volts directly.
- Keep at least 2–3 significant figures through the division; round at the end.
Use Lenz’s law to explain whether the potential is higher at end A or end X of the spoke.
Answer
To oppose the clockwise rotation (Lenz’s law), the magnetic force on the spoke must be opposite to the motion, so the induced conventional current in AX is from X to A. Hence end X is at higher potential than end A.
Potential is higher at X.
Background Concept
When a conductor moves through a magnetic field, charges in it experience a magnetic force , causing a separation of charge and an induced e.m.f.
If the conductor forms part of a complete circuit, an induced current flows. By Lenz’s law, the induced current produces a magnetic effect that opposes the change producing it. In a generator situation (mechanical motion producing e.m.f.), this usually shows up as a magnetic force that opposes the motion (a resisting torque), ensuring energy conservation.
The direction of force on a current-carrying conductor is given by
where points in the direction of conventional current.
Understanding the Question
The wheel rotates clockwise in a uniform magnetic field directed into the page. The spoke AX is a conductor from the axle (centre) to the rim (point X). You must decide whether end A or end X is at higher potential, using Lenz’s law.
Approach
- Lenz’s law tells us the induced effects must oppose the cause (the rotation cutting flux). That means the magnetic force on the spoke must oppose the motion (produce a counter-torque).
- Choose a current direction in the spoke and use to see whether the force would be in the direction of motion or against it.
- The correct current direction gives the higher-potential end (conventional current flows from higher to lower potential through the conductor).
Step-by-Step Reasoning
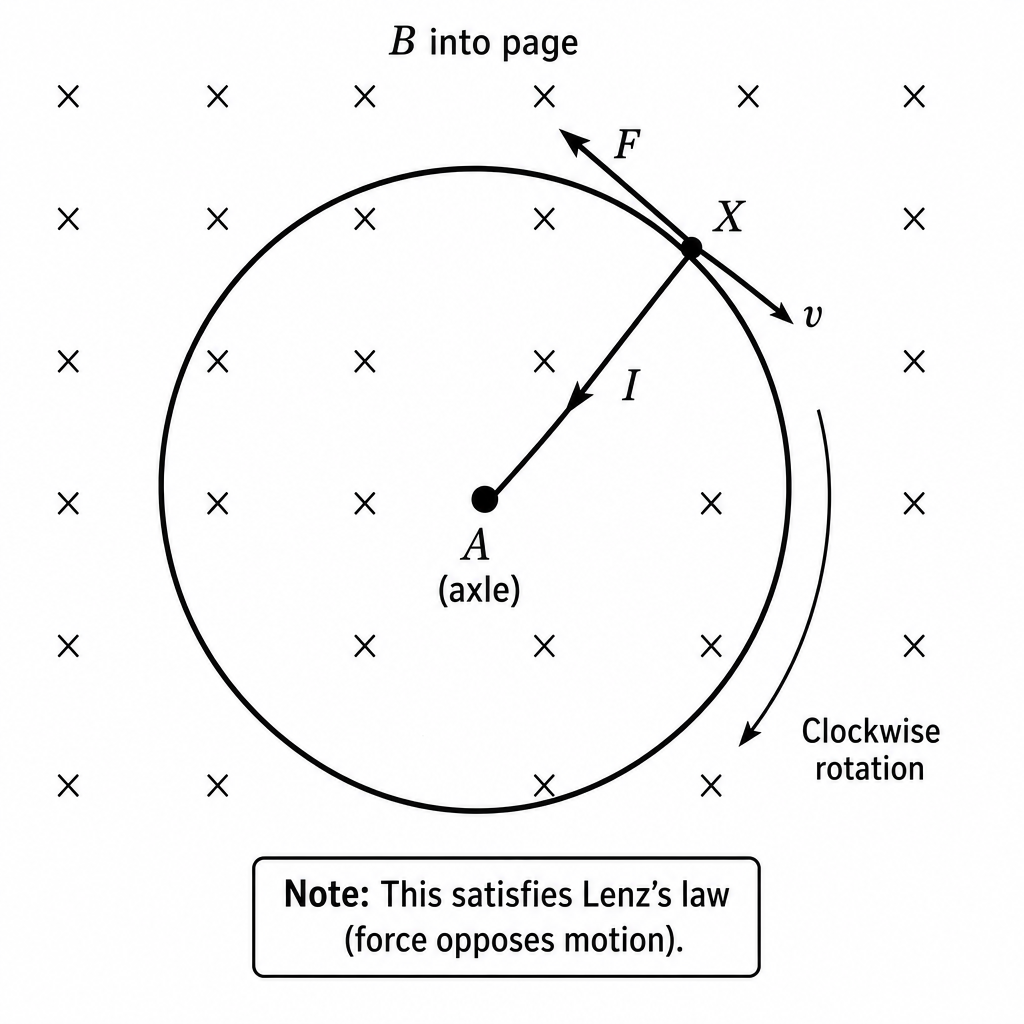
-
The wheel is rotating clockwise. For the induced current to oppose this, the magnetic force on the spoke must act tangentially anticlockwise (opposite the motion).
-
The magnetic field is into the page.
-
Test current direction:
- If conventional current were from A to X (radially outward), then is outward. With into the page, is tangential clockwise, i.e. it would help the rotation. That contradicts Lenz’s law.
- Therefore the induced conventional current must be from X to A (radially inward). Then is inward and is tangential anticlockwise, opposing the motion, consistent with Lenz’s law.
- Since conventional current in the spoke is from X to A, end X must be at higher potential than end A.
Key Takeaways
- Lenz’s law often means: induced current causes a magnetic force that resists the motion producing it.
- Use to check which current direction gives an opposing force.
- Conventional current direction tells you which end is at higher potential.
Common Mistakes
- Claiming the induced current aids the motion (violates Lenz’s law / energy conservation).
- Mixing up electron flow and conventional current: electrons move opposite to conventional current.
- Using Fleming’s rules with inconsistent directions for field and motion.
Things to Be Careful About
- The conclusion (which end is higher potential) must match the requirement that the induced magnetic effect opposes the clockwise rotation.
- You are asked about potential, so state clearly which end is at higher potential (not just the current direction).
The Sun may be considered as a uniform sphere with a mass of and a surface temperature of .
A probe with a mass of moves in a straight line towards the Sun.
When it is at a distance from the centre of the Sun, the probe measures the gravitational field strength due to the Sun and the radiant flux intensity of radiation from the Sun.
Answer
Gravitational field strength at a point is the force per unit mass on a small test mass placed at that point.
Force per unit mass on a small test mass at the point.
Background Concept
A mass produces a gravitational field around it. We quantify the field using the gravitational field strength at a point, defined by
where is the gravitational force on a small test mass placed at that point. The test mass is taken as “small” so it does not significantly change the field.
Understanding the Question
You are asked for a definition: what we mean by the gravitational field (in practice, gravitational field strength) at a point.
Approach
Give the standard Cambridge definition in terms of force per unit mass on a test mass.
Step-by-Step Reasoning
- Place a small test mass at the point.
- The gravitational force on it is .
- By definition, field strength is , so it is “force per unit mass”.
Key Takeaways
- Gravitational field strength is a local property of space around masses.
- Definition: .
Common Mistakes
- Defining gravitational field vaguely (“an area where gravity acts”) without mentioning force per unit mass when the mark expects .
- Mixing up with gravitational potential (energy per unit mass).
Things to Be Careful About
- Include “per unit mass” (or the equation ).
- Make clear it is at a point and uses a small test mass.
For the position of the probe where :
Working
For the Sun,
Answer
6.1 × 10^-3 N kg^-1
Background Concept
For a spherically symmetric mass (like the Sun treated as a uniform sphere), the gravitational field outside it is the same as if all the mass were concentrated at the centre. The gravitational field strength at distance from the centre is
where is the gravitational constant and is the mass producing the field.
Understanding the Question
Given:
- Mass of Sun
- Distance of probe from Sun’s centre
Find due to the Sun at that position.
Approach
Use the inverse-square gravitational field formula and substitute the given values.
Step-by-Step Reasoning
- Write the equation:
- Substitute:
- Square the distance:
- Divide:
This is much smaller than Earth’s (about ) because the probe is very far from the Sun.
Key Takeaways
- Outside a sphere, treat the mass as concentrated at the centre.
- Gravitational field decreases as .
Common Mistakes
- Using instead of .
- Forgetting that is from the centre of the Sun (the question states this explicitly).
- Power-of-ten errors when squaring .
Things to Be Careful About
- Keep units consistent (SI units).
- Square both the number and the power of ten: .
- Quote in (or ).
Working
Gravitational potential energy (zero at infinity):
Answer
-2.4 × 10^9 J
Background Concept
Taking gravitational potential energy to be zero at infinity, the gravitational potential energy of a mass at distance from a spherical mass is
The negative sign arises because work must be done against the attractive gravitational force to move the mass from out to infinity.
Understanding the Question
Given:
- (Sun)
- Probe mass
- Position from the Sun’s centre
Find the probe’s gravitational potential energy due to the Sun (with the usual reference at infinity).
Approach
Use and substitute values in SI units.
Step-by-Step Reasoning
- Start with
- Compute (as in part (b)(i)):
- Multiply by :
- Divide by :
- Apply the negative sign:
Key Takeaways
- in a gravitational field is negative when zero is defined at infinity.
- For a spherical mass, use the point-mass formula outside the sphere.
Common Mistakes
- Missing the negative sign (very common).
- Using in the denominator (confusing with the formula).
Things to Be Careful About
- State or imply the reference level (here it is the standard “zero at infinity”).
- Check that the magnitude is sensible: large mass but huge distance gives a large-but-not-astronomical value for a small probe mass.
Show that, for any particular value of , the numerical values of and are related by
where is the mass of the Sun, is the luminosity of the Sun and is the gravitational constant.
Working
For distance from the Sun’s centre,
Radiant flux intensity from luminosity :
So
Substitute into :
Answer
g = (4πGM/L) F
Background Concept
Two key inverse-square results for a spherical source:
- Gravitational field strength due to a spherical mass at distance :
- Radiant flux intensity (power per unit area) at distance from a star of luminosity :
The is the surface area of a sphere of radius over which the power spreads.
Understanding the Question
You must show that, at the same location of the probe (same ), the numerical values of and are related by a linear equation
So you need to eliminate between the expressions for and .
Approach
- Write down both inverse-square laws.
- Rearrange one (usually the radiation one) to express .
- Substitute into the other.
Step-by-Step Reasoning
- Start with the two equations:
- Rearrange the flux equation for :
- Substitute into the expression for :
This shows is directly proportional to (straight line through the origin on a – graph).
Key Takeaways
- Both gravity and radiation from a spherical source follow inverse-square behaviour.
- Eliminating the common gives a linear relation between two measurable quantities.
Common Mistakes
- Using instead of .
- Algebra slip when rearranging for .
- Forgetting that both formulas use the same distance measured from the centre.
Things to Be Careful About
- Keep consistent: it is the distance from the centre of the Sun.
- The relationship predicts the line passes through the origin because both and go to zero as .
Fig. 2.1 shows the variation of with .
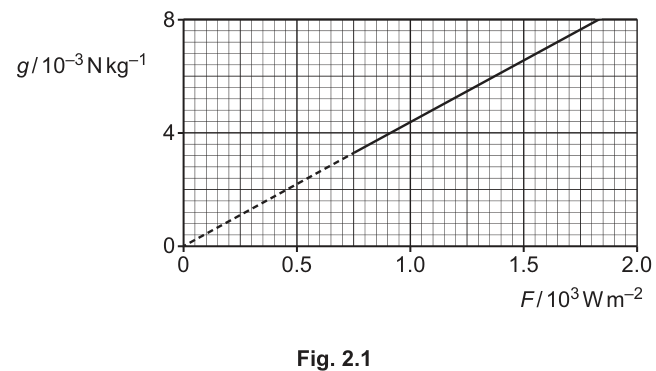
Determine a value for the luminosity of the Sun. Give a unit with your answer.
= ______ unit ______
Working
From the graph, using in the plotted scales:
From (c)(i),
Answer
4.2 × 10^26 W
Background Concept
From part (c)(i), we have a linear relationship:
Comparing with , the gradient of the – graph is
So if we can read the gradient, we can rearrange to find the luminosity .
Understanding the Question
The graph shows plotted against with scaled axes:
- vertical axis labelled
- horizontal axis labelled
The line passes through and approximately in these plotted units.
Approach
- Determine the numerical gradient using two points on the straight line.
- Convert that gradient into SI units (undo the axis scaling).
- Use and rearrange for .
Step-by-Step Reasoning
- Gradient from the plotted coordinates:
Plotted change in is units of , so
Plotted change in is units of , so
Hence
- Use the theoretical gradient:
Rearrange:
- Substitute and :
Key Takeaways
- A straight-line graph through the origin suggests direct proportionality.
- Always undo axis scaling before calculating a physical gradient.
- The gradient links measured quantities to constants like .
Common Mistakes
- Using the plotted numbers (e.g. ) as the gradient without including the and scale factors.
- Inverting the gradient (using by mistake).
- Forgetting the factor .
Things to Be Careful About
- The unit of luminosity is the watt (W).
- Choose points far apart on the line to reduce percentage uncertainty in the gradient.
- Keep powers of ten consistent: here the gradient is very small because is tiny compared with in SI units.
Working
Stefan–Boltzmann law:
Using , and :
Answer
7.2 × 10^8 m
Background Concept
A star can be approximated as a black-body radiator. The Stefan–Boltzmann law gives the luminosity (total power emitted) in terms of its surface area and surface temperature:
where
- is the star’s radius,
- is surface temperature,
- is the Stefan–Boltzmann constant ().
Understanding the Question
You are given the Sun’s surface temperature and, from part (c)(ii), its luminosity . You must calculate the Sun’s radius .
Approach
Rearrange the Stefan–Boltzmann law for :
Then substitute values in SI units.
Step-by-Step Reasoning
- Start with
- Rearrange:
- Substitute the numbers (taking from the graph):
- First compute ; since is a few thousand kelvin, is a very large number.
- Evaluate the denominator (this represents total power emitted per unit ).
- After substitution you obtain
This is of the correct order of magnitude for the solar radius (about ).
Key Takeaways
- Luminosity depends strongly on temperature: .
- If you know and , you can estimate radius using Stefan–Boltzmann.
Common Mistakes
- Forgetting the square root when solving for .
- Using (missing the factor of for total surface area).
- Not keeping in kelvin.
Things to Be Careful About
- Use consistent SI units throughout.
- Because is very large, calculator entry errors are common; bracket the entire denominator.
- The final unit for radius must be metres (m).
Answer
Specific latent heat is the thermal energy required per unit mass to change the state of a substance with no change in temperature.
Specific latent heat is the thermal energy required per unit mass to change the state of a substance with no change in temperature.
Background Concept
When a substance changes state (e.g. melting or boiling), energy supplied does not raise its temperature; instead it is used to change the molecular arrangement and intermolecular potential energy. The specific latent heat quantifies this energy requirement per unit mass.
The relationship is
where is the thermal energy transferred, is the mass, and is the specific latent heat (units ).
Understanding the Question
You are asked to define specific latent heat. This means stating what it is, including the key condition that the temperature does not change during the state change, and that it is an energy per unit mass.
Approach
Give a concise definition that includes:
- energy required (or released),
- per unit mass,
- to change state,
- at constant temperature.
Step-by-Step Reasoning
- “Specific” means per unit mass (i.e. per ).
- “Latent heat” refers to energy associated with change of state.
- During a phase change, temperature remains constant, so you must say “no change in temperature”.
A complete definition is: thermal energy required per unit mass to change state with no temperature change.
Key Takeaways
- Use .
- Temperature stays constant during the phase change.
- Must include “per unit mass”.
Common Mistakes
- Forgetting “per unit mass”.
- Missing the condition “no temperature change”.
- Saying “heat” without clarifying it is energy transferred.
Things to Be Careful About
- Do not confuse specific latent heat with specific heat capacity (which involves temperature change).
- Units should be (or if stated).
A dish containing of a substance rests on a laboratory bench. The substance is initially a liquid of density . Atmospheric pressure is .
The liquid is heated at its boiling point so that it completely vaporises. The increase in the internal energy of the substance during this process is . The final volume of the vapour is .
Working
Change in volume:
Work done (magnitude) against atmospheric pressure:
Answer
1.7 kJ
Background Concept
When a substance expands at (approximately) constant external pressure , it does work on the surroundings. The work done by the gas/substance is
If the system expands, so . The work done on the system is the negative of this:
Questions often ask for the magnitude, which is just .
Understanding the Question
The liquid boils and becomes vapour, so its volume increases from to while pushing back the atmosphere at . You must show that the work involved has magnitude .
Approach
- Find .
- Use .
- Convert from joules to kilojoules.
Step-by-Step Reasoning
Compute the volume change:
Now multiply by atmospheric pressure:
Convert to kJ:
This matches the required value.
Key Takeaways
- Expansion at constant pressure: .
- For expansion, work is done by the substance on the atmosphere.
- “Magnitude” avoids sign convention issues.
Common Mistakes
- Using and getting a negative magnitude.
- Forgetting to convert to .
- Using the vapour volume only (not the change in volume).
Things to Be Careful About
- The pressure is in pascals (), so the volume must be in .
- Keep enough significant figures during calculation; round at the end to .
Use the information in (b)(i) to calculate the thermal energy , in kJ, supplied to the substance to cause it to vaporise.
= ______
Working
First law (with = work done on the substance):
Expansion so .
Answer
19.3 kJ
Background Concept
The first law of thermodynamics links the change in internal energy to heating and work:
where:
- is the increase in internal energy of the system,
- is thermal energy transferred to the system,
- is work done on the system.
If the system expands and pushes back the atmosphere, it does work on the surroundings, so the work done on the system is negative.
Understanding the Question
You are told the increase in internal energy during vaporisation is . From part (i), the magnitude of work associated with expansion is . You must find the thermal energy supplied .
Approach
Use the first law with the paper’s stated convention ( = work done on the substance). Because the volume increases, set , then solve for .
Step-by-Step Reasoning
Start with:
Given .
During boiling the substance expands, so it does work on the atmosphere; therefore work done on the substance is negative:
Substitute:
So:
This means the heater supplies enough energy both to raise internal energy and to provide the mechanical work of expansion.
Key Takeaways
- Use with correct sign convention.
- Expansion implies .
- Heating must cover both internal energy increase and expansion work.
Common Mistakes
- Taking and getting .
- Mixing conventions ( vs ) without consistency.
Things to Be Careful About
- The question in (i) gave the magnitude of the work; you must decide the sign in (ii).
- Keep units consistent (all in here).
Use your answer in (b)(ii) to determine a value for the specific latent heat of vaporisation , in , of the substance.
= ______
Working
Mass of liquid:
Specific latent heat of vaporisation:
Answer
3.78×10^2 kJ kg^-1
Background Concept
For a phase change at constant temperature, the thermal energy transferred is related to the mass and the specific latent heat:
So
To find mass from density, use
Understanding the Question
You have already found the thermal energy supplied to vaporise the liquid: . You are given the liquid density and the initial liquid volume , which lets you find the mass that vaporised. Then compute .
Approach
- Calculate using the liquid volume (because that’s the known volume of the material before it changes state).
- Use .
- Keep units in since is in kJ.
Step-by-Step Reasoning
Find the mass:
Now use :
This is the specific latent heat of vaporisation.
Key Takeaways
- Use to find how much substance changed state.
- Then use .
- Be consistent with energy units (kJ gives ).
Common Mistakes
- Using the final vapour volume () with the liquid density to find mass (wrong: density changes enormously).
- Using instead of in (latent heat is based on thermal energy supplied).
- Converting to joules but leaving the answer in (unit mismatch).
Things to Be Careful About
- Significant figures: input data are typically 2 s.f. (e.g. ), so to 3 s.f. is reasonable ().
- Ensure you use the same mass that actually vaporised (the whole initial liquid).
The substance in (b) has a specific latent heat of fusion .
Suggest and explain whether is likely to be less than, the same as, or greater than the answer in (b)(iii).
Answer
is likely to be less than .
On melting, intermolecular bonds are only partially overcome so molecules become mobile but remain close together, so the increase in intermolecular potential energy is smaller.
On vaporisation, molecules separate much more and the substance also expands greatly, so more energy is needed (including work against atmospheric pressure).
LF is less than LV.
Background Concept
Latent heats measure the energy needed to change state at constant temperature:
- Fusion (solid (\to) liquid): energy mainly goes into loosening the solid lattice so particles can move past each other.
- Vaporisation (liquid (\to) gas): energy goes into separating particles much further, greatly increasing intermolecular potential energy, and typically doing significant expansion work against the surroundings.
Generally,
for the same substance.
Understanding the Question
You found a numerical value for the specific latent heat of vaporisation in (b)(iii). Now you must suggest and explain how the specific latent heat of fusion compares with that value.
Approach
Use qualitative particle/energy arguments:
- Compare the change in molecular separation and intermolecular potential energy.
- Mention that vaporisation involves much greater volume change and therefore work done against atmospheric pressure.
Step-by-Step Reasoning
- In a solid, particles are in fixed positions with strong intermolecular attractions.
- During melting, energy is used to break enough of these bonds to allow particles to move, but particles in the liquid remain close together. So the increase in intermolecular potential energy is relatively modest.
- During boiling, particles must become essentially independent in the gas phase, so attractions are overcome much more completely; particle separation increases dramatically. This requires a much larger increase in intermolecular potential energy.
- Additionally, boiling usually involves a large increase in volume, so the substance does work on the surroundings (), increasing the required thermal energy. (This is consistent with part (b)(i), where a non-negligible work term existed.)
Therefore should be less than .
Key Takeaways
- is linked to changes in intermolecular potential energy.
- Vaporisation needs more energy than fusion because it separates molecules far more and often includes significant expansion work.
Common Mistakes
- Saying they are the same because “both are changes of state” (ignores different energy changes).
- Claiming without justification.
- Only stating “less than” without explaining in terms of molecular separation/forces.
Things to Be Careful About
- Make the comparison explicitly: “less than”, “same as”, or “greater than”.
- Include an explanation tied to physics (intermolecular forces, potential energy, expansion work), not vague statements like “takes more heat”.
Answer
Any three of:
- Gas contains a large number of identical molecules (treated as point particles).
- Molecular volume is negligible compared with the volume of the container.
- Molecules move in constant random motion and obey Newton’s laws.
- No intermolecular forces except during collisions.
- Collisions between molecules and with the walls are perfectly elastic (collision time negligible).
Any three valid kinetic theory assumptions (see solution).
Background Concept
The kinetic theory of gases is a model that explains macroscopic gas behaviour (pressure, temperature) by assuming a simple picture of microscopic particles (molecules/atoms). Because it is a model, it starts from a set of simplifying assumptions (e.g. point particles, no forces) that make it possible to derive results such as
and
These derivations only work if the assumptions are stated clearly.
Understanding the Question
The question asks for three basic assumptions used in kinetic theory. It is not asking for derived equations, and it is not asking for conditions for an ideal gas law; it wants statements about what molecules are like and how they interact.
Approach
Recall the standard list of kinetic theory assumptions. Select any three distinct ones and write them as short, unambiguous statements.
Step-by-Step Reasoning
- Start with particle description: many identical molecules, treated as point particles (so their size is negligible).
- State the nature of motion: random motion, obeying Newton’s laws (straight lines at constant speed between collisions).
- State interactions: no intermolecular forces except during collisions.
- State collision behaviour: collisions are perfectly elastic (and collision time is negligible compared to time between collisions).
Any three of these earn the marks (provided they are clearly different points).
Key Takeaways
- Kinetic theory assumptions describe: (i) particle size, (ii) particle motion, (iii) forces between particles, (iv) collision properties.
- You only need three distinct assumptions for full credit.
Common Mistakes
- Stating a gas law (e.g. “”) instead of an assumption about molecules.
- Saying “molecules move fast” (too vague) rather than “random motion” and “straight lines between collisions”.
- Forgetting “elastic” when describing collisions.
Things to Be Careful About
- Make each assumption a separate, mark-point-ready statement.
- Don’t repeat the same idea in different words (e.g. “negligible size” and “negligible volume” are essentially the same point unless clearly distinguished).
Answer
Gas molecules move randomly and repeatedly collide with the container walls.
On each collision a molecule changes momentum (velocity reverses component normal to the wall), so the wall experiences an equal and opposite impulse.
The continual rate of change of momentum gives a steady force on the wall, and pressure is this force per unit area.
Pressure is due to continual molecular collisions with the walls causing a net force (rate of momentum change) per unit area.
Background Concept
Pressure is defined as
where is the normal force on area . In mechanics,
(force equals rate of change of momentum). Kinetic theory connects these by considering the momentum changes when molecules collide with the container walls.
Understanding the Question
You are asked to explain the mechanism for gas pressure: what molecules do, what happens at the wall, and how that produces a force (and hence pressure).
Approach
Describe (1) random molecular motion, (2) collisions with walls, (3) momentum change during collisions, (4) force as rate of momentum change, (5) pressure as force per unit area.
Step-by-Step Reasoning
- Molecules in a gas move in random directions with a range of speeds.
- When a molecule hits a wall, it rebounds. The component of its velocity perpendicular to the wall reverses direction, so its momentum changes.
- A momentum change requires a force; equivalently, the molecule exerts an impulse on the wall and the wall exerts an equal and opposite impulse on the molecule (Newton’s third law).
- Many molecules collide with the wall every second. Adding all these tiny impulses gives a continuous average force on the wall:
- The pressure is then this force spread over the wall area:
Higher molecular speeds or more molecules per unit volume produce more frequent/larger momentum changes, increasing the pressure.
Key Takeaways
- Pressure comes from collisions with container walls.
- The microscopic link is: collision (\rightarrow) momentum change (\rightarrow) force (\rightarrow) pressure.
Common Mistakes
- Saying “molecules push on the walls” without mentioning collisions/momentum change.
- Confusing pressure with energy; pressure is linked to momentum transfer, not directly to kinetic energy.
- Forgetting the definition of pressure as force per unit area.
Things to Be Careful About
- The force is an average result of many collisions; instantaneous forces fluctuate.
- Only the velocity component perpendicular to the wall changes sign in a rebound; mentioning this helps show correct understanding, but keep it brief in an exam answer.
Fig. 4.1 shows the variation with thermodynamic temperature of the mean-square speeds for two gases X and Y.
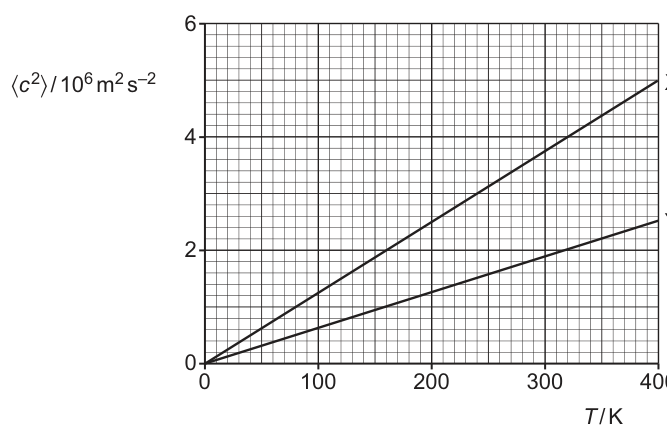
Fig. 4.2 shows the variation with of the product for samples of the two gases, where is the pressure of the gas and is the volume of the gas.
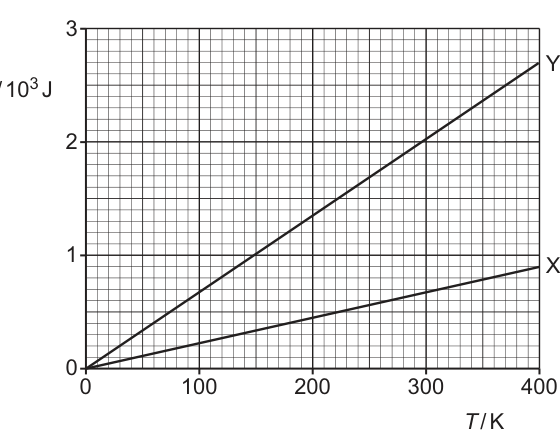
State three conclusions about the gases and their samples that may be drawn from Fig. 4.1 and Fig. 4.2. The conclusions may be qualitative or quantitative. Use the space below for any working that you need.
Working
From Fig. 4.2, for both gases and line passes through origin both behave as ideal gases with .
From Fig. 4.1,
At : for X, ; for Y, .
So
From Fig. 4.2 at : and , hence
Answer
Three conclusions:
- Both gases (both samples) behave as ideal gases: (straight line through origin).
- Gas X has smaller molecular mass than gas Y; .
- The sample of gas Y contains more molecules (more moles) than the sample of gas X; .
Both gases are ideal; Y has about twice the molecular mass of X; the Y sample has about 2.9 times as many molecules (moles) as the X sample.
Background Concept
Two key kinetic theory results connect microscopic motion to macroscopic variables:
- Ideal gas equation (microscopic form):
where is the number of molecules, is the Boltzmann constant, and is thermodynamic temperature.
- Pressure in terms of mean-square speed:
where is the mass of one molecule and is the mean of over molecules (related to by ).
Equating the two expressions for gives
So a graph of against should be a straight line through the origin for an ideal gas, and the gradient is inversely proportional to molecular mass .
Understanding the Question
You are given two graphs:
- Fig. 4.1: versus for gases X and Y.
- Fig. 4.2: versus for samples of X and Y.
You must state three conclusions about the gases and their samples. “Conclusions” can include statements like “it behaves ideally”, “one gas has larger molecular mass”, or “one sample contains more moles”, supported by what the graphs show.
Approach
- Use Fig. 4.2 to decide whether each sample obeys (ideal gas behaviour) and to compare amounts of gas via .
- Use Fig. 4.1 and to compare molecular masses by comparing gradients.
- Extract simple ratios using a convenient common temperature (e.g. ) because both lines pass through the origin.
Step-by-Step Reasoning
1) Ideal gas behaviour from the – graph
Both lines in Fig. 4.2 are straight and pass through the origin. That means
for both, which is exactly the behaviour predicted by for an ideal gas sample of fixed .
So a valid conclusion is: both gases (their samples) behave ideally over the range shown.
2) Compare molecular masses from the – graph
From
the gradient of vs is . Larger gradient means smaller .
At , the graph gives roughly:
- X:
- Y:
So the gradient ratio is , hence
Conclusion: Y molecules are about twice as massive as X molecules.
3) Compare the amounts of gas in each sample from the – graph
Using , at the same temperature the ratio of values equals the ratio of values:
At , graph values are approximately:
Thus
Conclusion: the Y sample contains about times as many molecules (and therefore about times as many moles) as the X sample.
Key Takeaways
- Straight line through origin on a vs graph indicates ideal gas behaviour ().
- For an ideal gas, and the gradient gives information about molecular mass ().
- At fixed , comparing compares the amount of gas because .
Common Mistakes
- Using (wrong direction); it is inversely proportional to .
- Comparing the values of at one temperature without recognising this is equivalent to comparing gradients only because both pass through the origin.
- Saying “gas Y has higher pressure” from Fig. 4.2 without noting that depends on both and and also on the amount of gas.
Things to Be Careful About
- Keep track of what refers to the gas type (molecular mass) versus what refers to the sample (amount of gas ).
- Use consistent powers of ten from the axis labels (e.g. and ).
- Ratios are often easiest and avoid needing to calculate the gradient explicitly when lines pass through the origin.
Fig. 5.1 shows a pendulum consisting of a metal sphere suspended by a thin string.
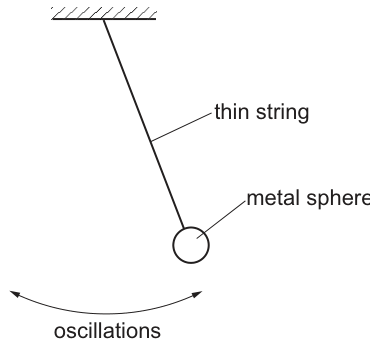
The sphere undergoes small oscillations about its equilibrium position. The oscillations may be considered to be simple harmonic.
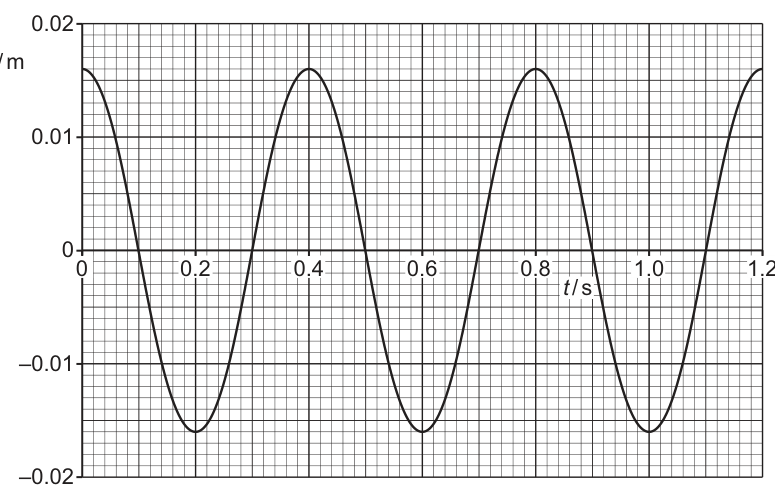
Fig. 5.2 shows the variation with time of the displacement of the sphere from its equilibrium position.
On Fig. 5.1, draw an arrow, from the centre of the sphere, to represent the direction of the resultant force acting on the sphere when it is in the position shown.
Answer
The resultant force is directed towards the equilibrium position (tangential to the arc, not along the string).
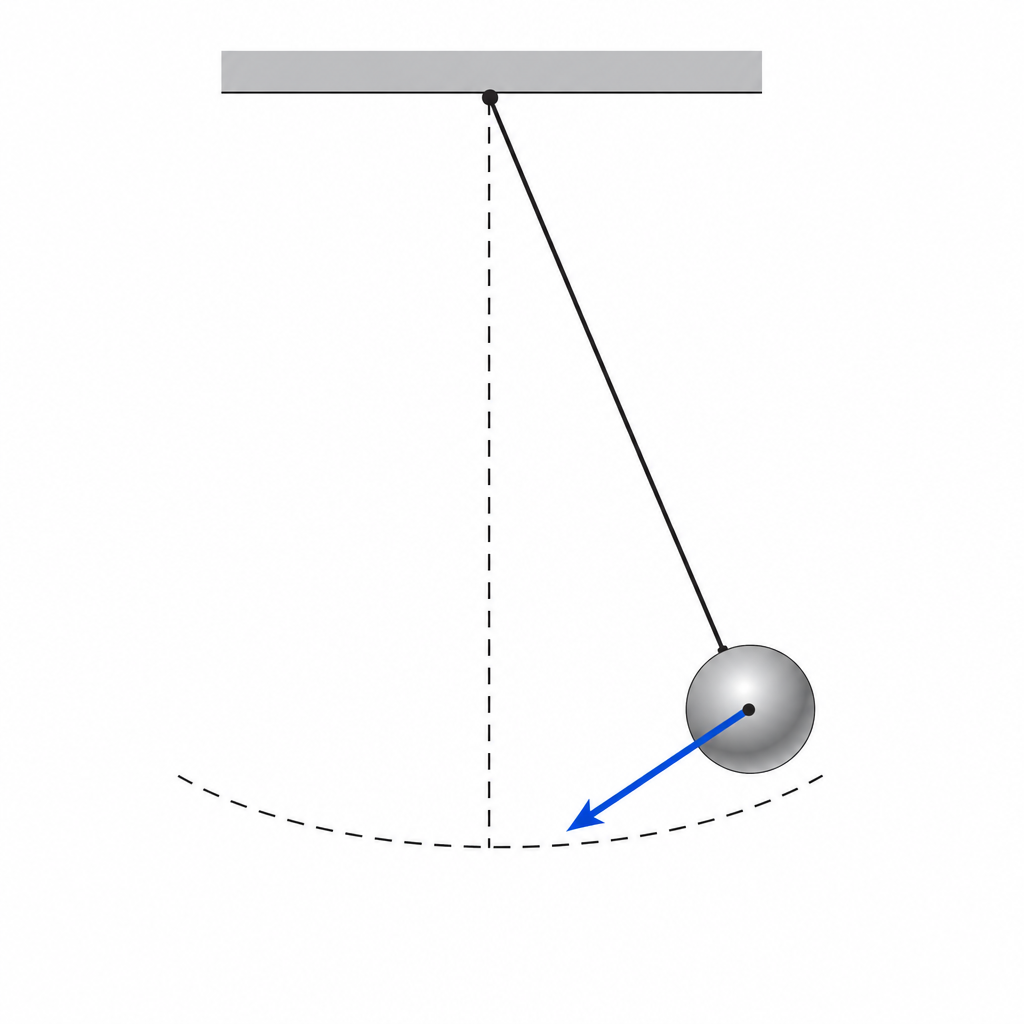
Resultant force towards equilibrium position (tangential to the arc).
Background Concept
For small oscillations of a pendulum, the motion can be treated as simple harmonic. A key feature of SHM is that the resultant force is a restoring force: it always acts towards the equilibrium position and is proportional to the displacement (for small angles).
For a pendulum bob displaced to one side, there are two main forces: weight vertically down and tension along the string. The resultant (net) force is not simply one of these; it is the vector sum. The component that causes the bob to accelerate along its path is the component of weight along the tangent to the arc, which points back towards equilibrium.
Understanding the Question
The diagram shows the bob displaced from the vertical (equilibrium) position. You are asked to draw an arrow from the centre of the sphere showing the direction of the resultant force at that instant.
Because it is displaced, the bob will accelerate back towards the centre position, so the resultant force must point that way.
Approach
- Identify the equilibrium position (the lowest point, string vertical).
- For a displaced pendulum bob, the motion is along a circular arc, so the restoring effect is along the tangent to the arc.
- Draw an arrow from the bob pointing towards equilibrium along the direction of motion back to the centre.
Step-by-Step Reasoning
- The bob is shown away from the equilibrium (string not vertical).
- In SHM, the acceleration (and hence resultant force) is always towards the equilibrium position.
- Therefore, the resultant force arrow must point from the bob back towards the lowest point, along the tangent to the path.
Key Takeaways
- In SHM, the resultant force is a restoring force: it points towards equilibrium.
- For a pendulum, the restoring effect is tangential to the arc (for the oscillatory motion).
Common Mistakes
- Drawing the force along the string (tension direction) rather than towards equilibrium.
- Drawing (straight down) instead of the resultant force.
Things to Be Careful About
- The question asks for the resultant force, not one of the individual forces.
- The arrow should be drawn from the centre of the sphere, as stated.
The mass of the sphere is .
Answer
From Fig. 5.2, maximum displacement .
Amplitude .
0.015 m
Background Concept
In simple harmonic motion, the amplitude is defined as the maximum displacement from the equilibrium position.
On a displacement–time graph, amplitude is read as the largest magnitude of (either the highest peak above zero or the lowest trough below zero). It is always a positive quantity.
Understanding the Question
You are given a graph of displacement against time (Fig. 5.2). The question asks for the amplitude of the oscillations, so you must read the maximum value of from the graph.
Approach
- Locate the highest point (or lowest point) of the sinusoidal curve.
- Read off the corresponding value on the vertical axis.
- Quote it in metres.
Step-by-Step Reasoning
- The curve starts at a maximum at .
- That maximum displacement is .
- Therefore the amplitude is
Key Takeaways
- Amplitude is the maximum value of .
- On a sinusoidal graph, it is the height of a peak above the equilibrium line.
Common Mistakes
- Using peak-to-peak value (which would be ) instead of .
- Giving a negative value (amplitude is not negative).
Things to Be Careful About
- Check the axis scale carefully (units are metres).
- If the curve does not start at a peak, still find the largest anywhere on the graph.
Working
From Fig. 5.2, period .
Answer
.
15.7 rad s^-1
Background Concept
For SHM, angular frequency is related to the period by
- is the time for one complete cycle (e.g. peak to next peak).
- is measured in .
Understanding the Question
The displacement–time graph shows a repeating sinusoidal motion. You must:
- determine the period from the graph, and
- calculate using .
Approach
- Pick two identical points one cycle apart (e.g. successive maxima).
- Read the time difference to find .
- Substitute into .
Step-by-Step Reasoning
- From the graph, one full cycle takes (e.g. from a maximum to the next maximum).
- Compute angular frequency:
Key Takeaways
- Period is obtained directly from the graph by measuring one full repeat.
- Angular frequency is found using .
Common Mistakes
- Using frequency directly without converting: remember and .
- Measuring half a cycle (peak to trough) and using it as .
Things to Be Careful About
- Choose two points that are clearly identical in the cycle (two peaks are usually easiest).
- Keep enough significant figures; gives to about 3 s.f.
Working
For SHM,
Answer
.
4.2 × 10^-3 J
Background Concept
In SHM, energy continually swaps between kinetic and potential forms, but the total energy remains constant (if damping is negligible).
For an object of mass undergoing SHM with amplitude and angular frequency , the total energy is
This is also equal to the maximum kinetic energy (at ) and equal to the maximum potential energy (at ).
Understanding the Question
You are told the mass . From earlier parts (or from the graph) you obtain:
- amplitude
- angular frequency
The question asks for the total energy of the oscillations.
Approach
Use the SHM energy formula
and substitute the given values, keeping units in SI.
Step-by-Step Reasoning
- Write the formula:
- Substitute:
- Calculate stepwise:
So
Key Takeaways
- Total energy in SHM depends on , , and via .
- The total energy equals the maximum kinetic energy at equilibrium.
Common Mistakes
- Using without finding .
- Forgetting to square or .
- Using in cm rather than m.
Things to Be Careful About
- Keep in metres and in .
- Quote the answer to a sensible number of significant figures consistent with the data (typically 2 s.f. here).
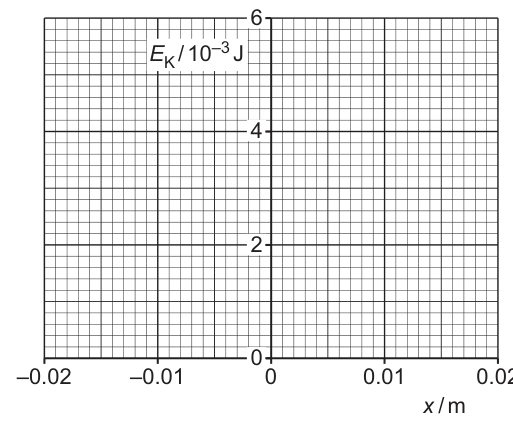
Answer
Using , the graph of against is a downward-opening parabola, symmetric about .
- maximum at equal to total energy .
- at .
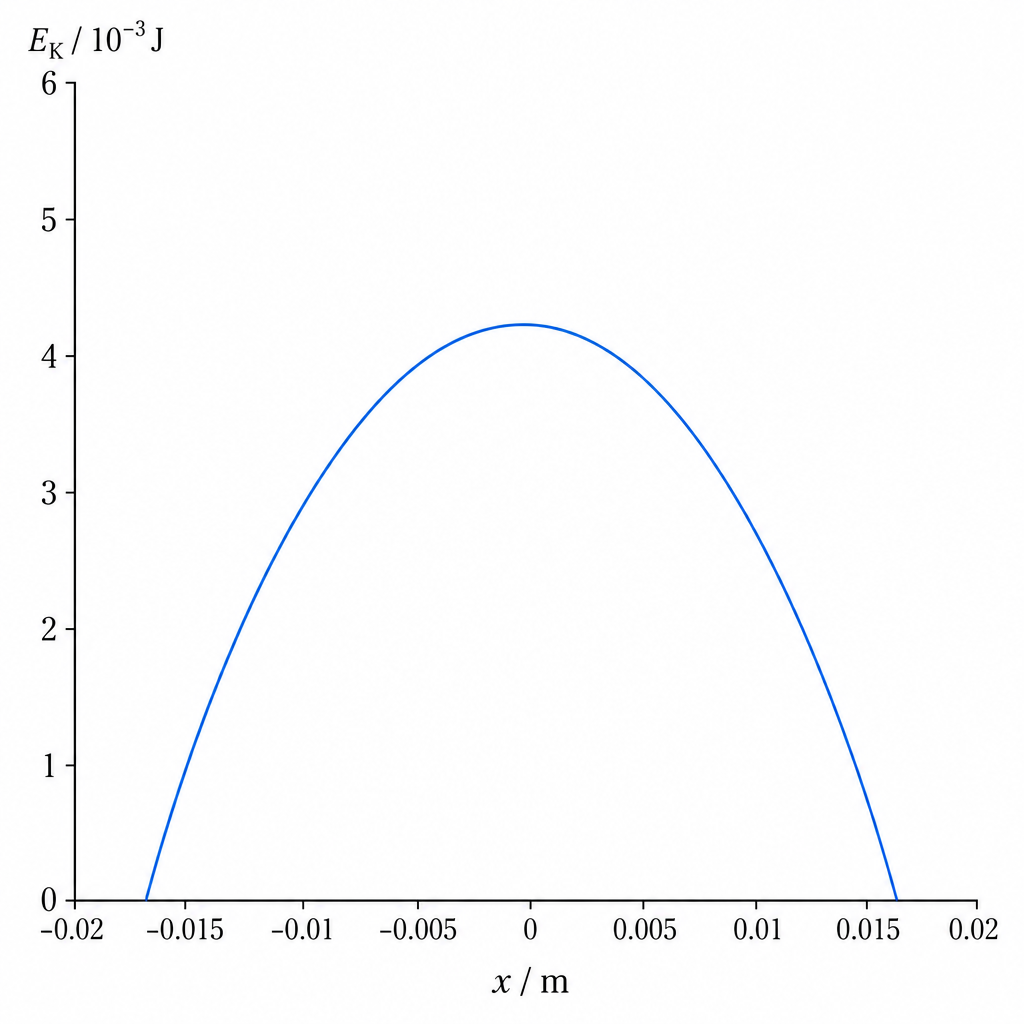
Downward-opening parabola: EK max at x=0 (≈4.2×10^-3 J), zero at x=±0.015 m.
Background Concept
In SHM, the total energy is constant and is shared between kinetic energy and potential energy :
For a mass-spring SHM model,
so
This shows depends on , so the vs graph is a parabola, with:
- maximum at (equilibrium),
- at (turning points), where speed is zero.
Understanding the Question
You must sketch (vertical axis) against displacement (horizontal axis) on the provided axes. The scale suggests energies of a few and displacements up to .
From earlier parts:
- amplitude
- total energy
These give the key points needed for the sketch.
Approach
- Use the turning points: at , speed is zero, so .
- Use equilibrium: at , speed is maximum, so is maximum and equals the total energy.
- Connect with a smooth, symmetric downward-opening parabola.
Step-by-Step Reasoning
- At the extremes :
- At equilibrium :
- Since , the dependence on makes the curve symmetric about and concave down.
So the sketch is a parabola passing through and with a maximum at .
Key Takeaways
- is maximum at equilibrium and zero at turning points.
- Because depends on , the – graph is a symmetric parabola.
Common Mistakes
- Sketching a sine/cosine curve (energy is not sinusoidal with ).
- Putting maximum kinetic energy at instead of at .
- Drawing a straight line or a V-shape instead of a parabola.
Things to Be Careful About
- Use the amplitude value from the graph: the intercepts should be at , not .
- The maximum should match the previously calculated total energy and fit the provided vertical scale.
Answer
For two point charges and separated by distance , the force is along the line joining them and has magnitude
Like charges repel and unlike charges attract.
For two point charges separated by distance r, F = (1/4πϵ0)(Q1Q2/r^2) along the line joining them; like charges repel, unlike attract.
Background Concept
Coulomb’s law describes the electrostatic force between two point charges (or spherically symmetric charge distributions acting as point charges from outside). The key ideas are:
- The force is an inverse-square force: it decreases with the square of separation .
- The magnitude is proportional to the product of the charges.
- The force acts along the straight line joining the charges.
- The constant of proportionality in SI units is written using the permittivity of free space .
Mathematically,
for the magnitude, and the direction is such that like charges repel and unlike charges attract.
Understanding the Question
You are asked to state Coulomb’s law, so the examiner expects a clear statement of:
- how depends on , , and (proportionalities or formula), and
- the direction/nature of the force (along the line; attraction/repulsion).
Approach
Write the standard Coulomb’s law expression (with ), then add one short sentence about direction and whether the force is attractive/repulsive.
Step-by-Step Reasoning
- Identify the variables: two point charges and separated by distance .
- State the inverse-square and product dependence using the full SI expression:
- Add the directional information required for a complete “law”: the force is along the line joining the charges, with repulsion for like charges and attraction for unlike charges.
Key Takeaways
- Coulomb’s law is an inverse-square law: .
- The force depends on the product of charges and acts along the line joining them.
Common Mistakes
- Forgetting to mention the direction (along the line joining charges).
- Giving only proportionalities and omitting the constant when a full equation is expected.
- Mixing up attraction/repulsion for like/unlike charges.
Things to Be Careful About
- Use (not ) in the denominator.
- may be positive or negative; the sign indicates whether the force is repulsive or attractive, but you should still state that in words.
Fig. 6.1 shows an isolated hollow conducting sphere that is positively charged.
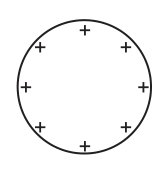
On Fig. 6.1, draw field lines to represent the electric field outside the sphere.
Answer
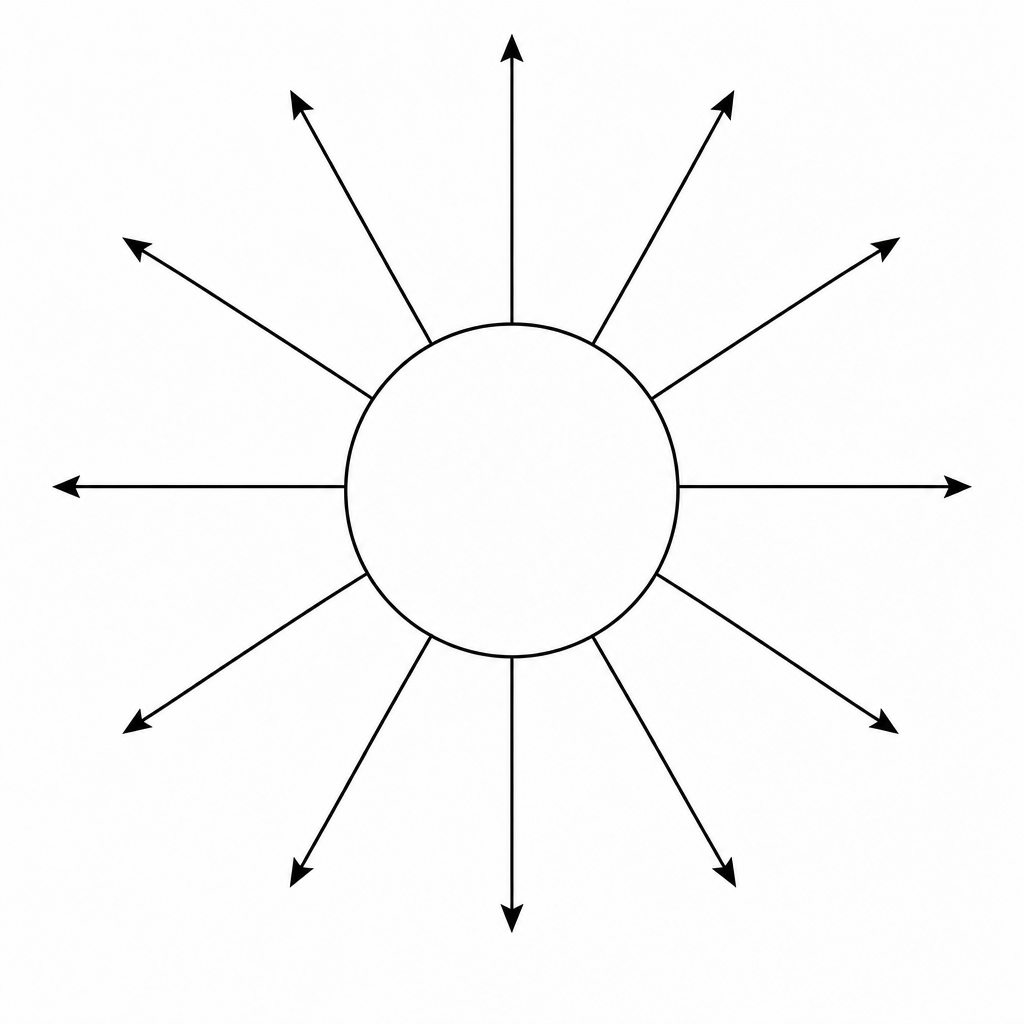
Field lines are radial, perpendicular to the surface, with arrows pointing outwards, and are symmetrically spaced around the sphere.
Radial field lines perpendicular to the surface with arrows pointing outwards (symmetric spacing).
Background Concept
Electric field lines are a way to represent the direction and relative strength of an electric field:
- The direction of the electric field at a point is the direction of the force on a positive test charge.
- Field lines point away from positive charge and towards negative charge.
- The density (spacing) of field lines indicates the field strength (closer lines mean a stronger field).
For a charged conducting sphere in electrostatic equilibrium:
- charge resides on the outer surface,
- the surface is an equipotential, and
- the electric field just outside the surface is perpendicular to the surface.
Understanding the Question
You are shown a positively charged isolated hollow conducting sphere and asked to draw the field lines outside the sphere.
So you must:
- draw lines starting on the surface,
- make them perpendicular to the surface everywhere,
- show arrows pointing outward (positive charge),
- and draw a symmetric pattern (because a sphere is spherically symmetric).
Approach
Use spherical symmetry: outside a charged sphere the field behaves like that of a point charge at the centre, so field lines are straight radial lines. Apply the conductor rule: field lines meet the surface at right angles.
Step-by-Step Reasoning
- Start several lines on the outer surface of the sphere at different points around it.
- Draw each line as a straight line going directly away from the centre (radial).
- Add arrowheads pointing away from the sphere (since it is positively charged).
- Space the lines evenly around the sphere to show symmetry.
(You are not asked to draw inside the sphere here; if you did, there should be no lines inside for a conductor in electrostatic equilibrium.)
Key Takeaways
- Positive charge: field lines point outwards.
- Charged conducting sphere: field lines outside are radial and perpendicular to the surface.
Common Mistakes
- Drawing curved lines or lines that are not radial.
- Missing arrowheads or drawing arrows pointing inward.
- Drawing field lines that touch the surface at an angle (not perpendicular).
- Drawing an asymmetric pattern for a sphere.
Things to Be Careful About
- Field lines should not cross.
- Use enough lines to make the pattern clear and symmetric.
- The lines should begin on the surface (for a positively charged isolated conductor).
Fig. 6.2 shows the variation of the electric field strength with distance from the centre of the sphere in (b).
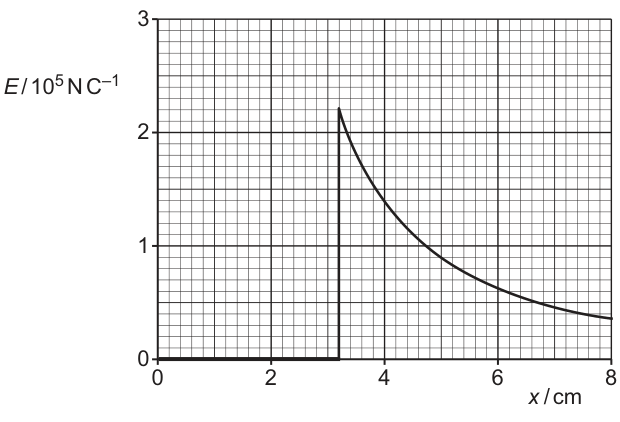
Answer
From the graph, up to , so the sphere radius is
3.2 cm
Background Concept
For a conducting sphere in electrostatic equilibrium:
- The electric field inside the conductor (and inside the hollow region if there is no charge inside) is zero.
- The electric field becomes non-zero outside the surface.
So, on a graph of against distance from the centre, the radius corresponds to the value of where the field changes from zero (inside) to non-zero (outside).
Understanding the Question
You are given a graph of electric field strength versus distance from the centre of the sphere. The graph shows close to the centre and then a jump to a non-zero value at the surface. You need the sphere’s radius in cm.
Approach
Locate the point on the -axis where stops being zero and becomes non-zero. That distance from the centre is the radius.
Step-by-Step Reasoning
- Read the region where : the graph shows from up to about .
- At there is a sharp jump to a finite value of , indicating the sphere’s surface.
- Therefore, the radius is
Key Takeaways
- For a conductor, the radius can be found from where the field changes from zero (inside) to non-zero (outside) on an vs graph.
Common Mistakes
- Reading the diameter instead of the radius.
- Choosing a point further along the curve rather than the jump point at the surface.
Things to Be Careful About
- Ensure you read the value at the discontinuity (the jump), not where the curve later reaches some chosen value.
- Keep the unit in cm as requested.
Working
At the surface, and from the graph .
For a charged sphere,
so
Answer
+2.5 × 10^-8 C
Background Concept
Outside a spherically symmetric charge distribution (including a charged conducting sphere), the electric field is the same as if all the charge were concentrated at the centre. The magnitude of the electric field at distance from the centre is
where:
- is electric field strength in ,
- is charge in C,
- is distance from the centre in m,
- is the permittivity of free space.
This is closely related to Coulomb’s law, since and .
Understanding the Question
You are given a graph of against distance from the centre. You must calculate the charge on the sphere.
From the graph you can read:
- the radius of the sphere (where first becomes non-zero), and
- the value of just outside the surface.
Then you substitute into the spherical field equation and solve for .
Approach
- Read from part (i) and convert to metres.
- Read at the surface (the jump value).
- Use
and rearrange to get .
Step-by-Step Reasoning
- Radius from the graph:
- Electric field just outside the sphere (from the jump on the graph):
- Rearrange the field equation:
- Substitute values:
Compute :
So
The sphere is stated to be positively charged, so the sign is .
Key Takeaways
- Outside a charged conducting sphere, treat it like a point charge at the centre.
- Use and ensure is in metres.
Common Mistakes
- Forgetting to convert to (this causes a factor of error in ).
- Using the wrong value (e.g. reading at a different rather than just outside the surface).
- Missing the sign of the charge when the question context gives it.
Things to Be Careful About
- The graph’s vertical axis is scaled; interpret it correctly (here it is already described in with a scale).
- Use SI constants and SI units consistently.
- Quote a sensible number of significant figures based on graph readings (typically 2 s.f. here).
Suggest an explanation for the fact that the electric field inside the sphere is zero.
Answer
The sphere is a conductor in electrostatic equilibrium, so charge resides on the outer surface and the field inside cancels to zero (the interior is at constant potential).
In electrostatic equilibrium, charges lie on the outer surface of a conductor so the interior is at constant potential and the net electric field inside is zero.
Background Concept
In electrostatic equilibrium, free electrons in a conductor can move. If there were any electric field inside the conducting material, charges would experience a force and would continue to move. Equilibrium is only reached when:
- the electric field within the conducting material is zero, and
- the conductor becomes an equipotential (potential is constant throughout the conductor).
For an isolated charged hollow conductor with no charge inside the cavity, all excess charge resides on the outer surface. The resulting field in the cavity (and within the conductor) is zero: this is electrostatic shielding.
Understanding the Question
The graph shows for distances from the centre up to the inner region (and up to the surface), and you are asked to suggest why the field inside is zero.
So the expected explanation is based on the properties of conductors in electrostatic equilibrium and the fact that charges reside on the outside surface.
Approach
State the electrostatic equilibrium condition for conductors: if inside, charges would move. Therefore charges redistribute onto the surface such that the net field inside is zero, making the interior an equipotential.
Step-by-Step Reasoning
- The sphere is conducting, so it contains mobile charge carriers.
- If there were an electric field inside, these charges would feel a force and move, so the situation would not be static.
- Charges therefore redistribute themselves on the outer surface until the net electric field everywhere inside the conductor (and inside the hollow region, if empty) is zero.
- This redistribution also makes the potential constant inside.
Key Takeaways
- A conductor in electrostatic equilibrium has inside.
- Excess charge on an isolated conductor resides on the outer surface.
Common Mistakes
- Saying “there is no charge inside” without linking it to conductor equilibrium (the key idea is redistribution until ).
- Confusing the field inside the conductor with the field just outside (which is not zero).
Things to Be Careful About
- The correct reasoning is about mobile charges and equilibrium, not simply “the sphere is hollow”.
- If there were a charge placed inside the cavity, the field in the cavity would not generally be zero; the question refers to the given isolated charged sphere with no internal charge mentioned.
Answer
Capacitance is the charge stored per unit potential difference between the plates:
Capacitance is charge per unit potential difference: C = Q/V.
Background Concept
Capacitance describes how much charge a system can store for a given potential difference (p.d.). For any capacitor,
where:
- is capacitance in (farad),
- is charge stored (magnitude of charge on one plate) in ,
- is the p.d. between the plates in .
Understanding the Question
You are asked to define the capacitance of a parallel-plate capacitor. Even though the capacitor type is specified, the definition required is the general one: the ratio of charge stored to the p.d. across it.
Approach
Give a clear statement in words and the equation linking , and .
Step-by-Step Reasoning
- A capacitor stores equal and opposite charges on its plates; we use to mean the magnitude on one plate.
- The larger the p.d. , the more charge is stored.
- Capacitance is defined as the charge stored per volt:
Key Takeaways
- Capacitance measures “charge per volt”.
- The defining equation is .
Common Mistakes
- Writing (inverted).
- Saying “capacitance is the ability to store charge” without stating “per unit p.d.”
Things to Be Careful About
- is the charge on one plate (not the total of both plates).
- Include the relationship (equation) as well as the verbal definition for full credit.
An initially uncharged capacitor X, of capacitance , is gradually charged so that the final potential difference (p.d.) between its plates is and the final charge is .
On Fig. 7.1, sketch the variation of charge with p.d. for capacitor X as the p.d. increases from 0 to .
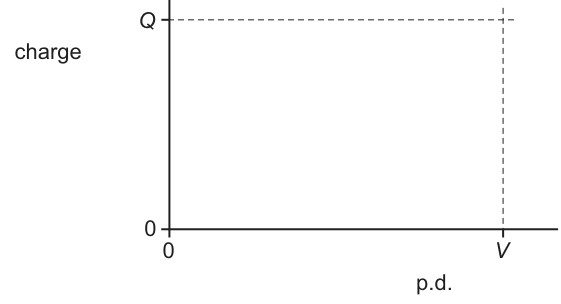
Answer
Since , charge is proportional to p.d.
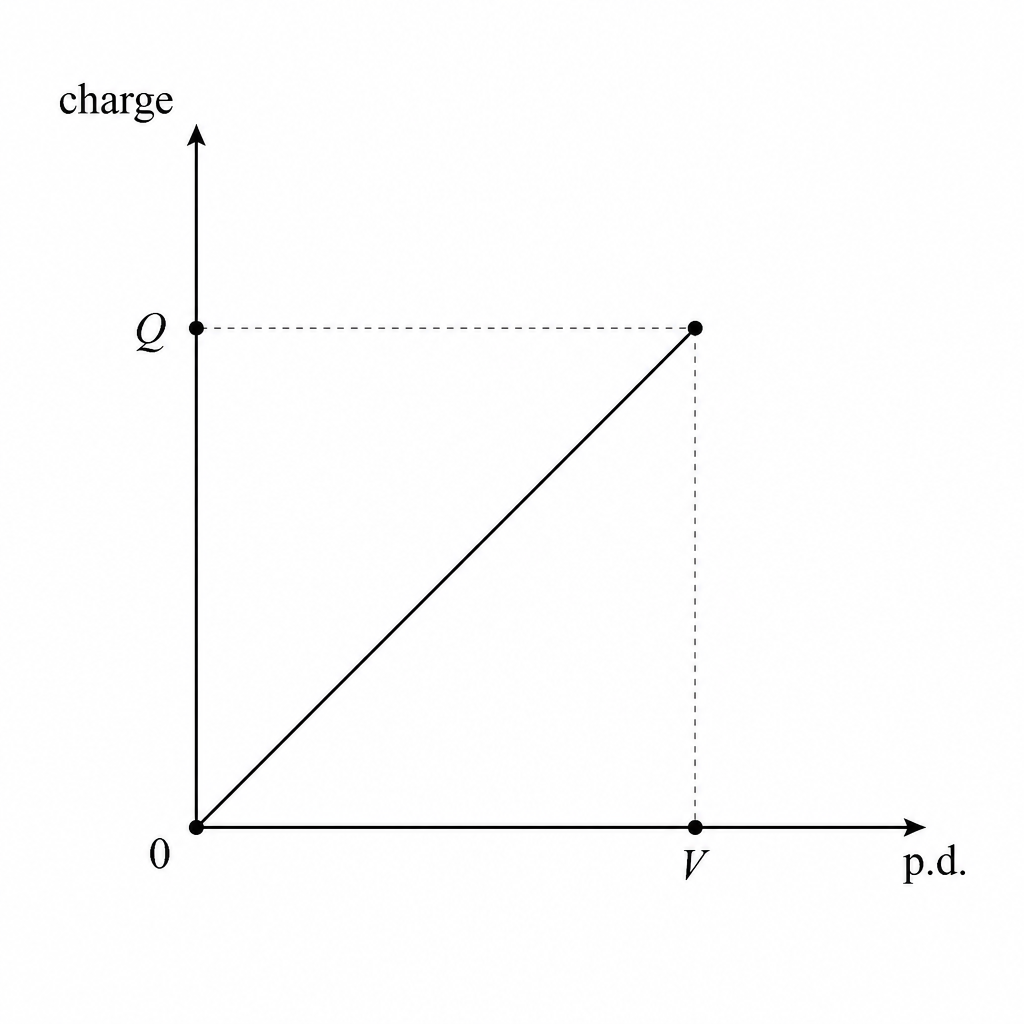
Straight line through the origin to the point .
A straight line through the origin reaching (V, Q).
Background Concept
For an ideal capacitor,
So if is constant, is directly proportional to . A graph of (y-axis) against (x-axis) is therefore a straight line through the origin with gradient .
Understanding the Question
Capacitor X has capacitance . It is charged gradually from to a final p.d. , storing a final charge . You must sketch how varies with p.d. between and , on axes where the point is indicated.
Approach
Use :
- at , ;
- at , .
Plot these and join with the correct trend (linear).
Step-by-Step Reasoning
- Start with the capacitor uncharged: , so the graph passes through the origin.
- For any intermediate p.d. , the charge is .
- Because is constant, doubling doubles , so the relationship is a straight line.
- The line must pass through the marked point .
Key Takeaways
- For a fixed capacitor, .
- The – graph is a straight line through the origin.
Common Mistakes
- Drawing a curve (confusing with capacitor discharge curves).
- Drawing a line that does not pass through .
- Not starting at the origin.
Things to Be Careful About
- Axes labels matter: here is on the y-axis and p.d. on the x-axis.
- The gradient is (not required to be written, but it supports the straight-line choice).
Determine an expression, in terms of and , for the work done on capacitor X during the charging process. Explain your reasoning.
= ______
Working
Work done is area under the – graph:
Since , this area is a triangle:
Answer
W = 1/2 QV
Background Concept
When charging a capacitor, the p.d. across it is not constant: it increases as more charge is placed on the plates. The small amount of work done to move an additional small charge onto the capacitor when the p.d. is is
So total work (energy stored) is
Geometrically, is the area under the graph of (y-axis) against (x-axis).
Understanding the Question
You know the capacitor ends with charge and p.d. . You must write in terms of just and and explain the reasoning (so you need either the integral argument or the area-under-graph argument).
Approach
Use that for a capacitor, so increases linearly with during charging. That makes the – graph a straight line from to , so the area under it is a triangle.
Step-by-Step Reasoning
- At some intermediate stage when the capacitor has charge , its p.d. is
- The work done to add a small extra charge is
- Integrate from to :
- Use (final state), giving
This matches the triangle-area idea: area .
Key Takeaways
- Energy stored in a capacitor is
- The factor appears because rises from to as charge builds up.
Common Mistakes
- Using (incorrect because is not constant during charging).
- Mixing up which graph gives the area: it must be against for area = .
Things to Be Careful About
- The question asks for an expression in terms of and , so the final form should be (not unless you then substitute ).
- State clearly that the relationship is linear, so the area is a triangle.
Another capacitor Y is initially uncharged. The fully charged capacitor X in (b) is now connected to capacitor Y, as shown in Fig. 7.2.
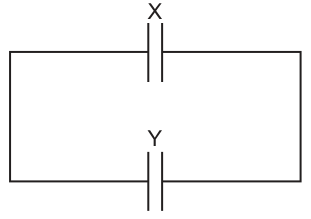
The capacitance of capacitor Y is .
Complete Table 7.1 to show expressions, in terms of and , for the final p.d.s across, and the final charges on, the two capacitors.
Use the space below for any working that you need.
Table 7.1
| X | Y | |
|---|---|---|
| final p.d. | ||
| final charge |
Working
Initial charge on X is and total charge is conserved.
For parallel capacitors, final p.d. is the same: .
Answer
Final p.d. across X and Y: each.
Final charge on X: .
Final charge on Y: .
Final p.d.s: V/4 on both; final charges: X = Q/4, Y = 3Q/4.
Background Concept
When capacitors are connected in parallel:
- they share the same final potential difference ;
- charges add: .
If the capacitors are isolated from any battery/external circuit, the total charge is conserved (it can move between capacitors, but cannot leave the system).
Also, for each capacitor:
Understanding the Question
Capacitor X (capacitance ) is initially charged to p.d. with charge (so ). Capacitor Y is initially uncharged and has capacitance . They are then connected together in parallel in a closed loop. You must find the final p.d. across each and the final charge on each, in terms of the original and .
Approach
- Let the common final p.d. be .
- Use and .
- Use conservation of total charge: initial , final .
- Solve for , then substitute back to get and .
Step-by-Step Reasoning
- After connection, X and Y are in parallel, so
- Express each final charge using :
- Total charge is conserved (system isolated), so
- Solve for :
Since initially , then
- Now find final charges:
Key Takeaways
- Parallel capacitors have the same final p.d.
- If disconnected from a supply, total charge is conserved.
- Charge divides in proportion to capacitance: larger gets larger at the same .
Common Mistakes
- Assuming the p.d. stays at (it drops because the total capacitance increases).
- Assuming charge stays the same on capacitor X (charge redistributes).
- Using series rules instead of parallel rules.
Things to Be Careful About
- The question wants expressions in terms of and ; using is fine if you then replace with .
- Be clear that Y was initially uncharged, but it gains charge after connection.
State whether the total energy stored in the two capacitors is less than, the same as, or greater than the energy initially stored in capacitor X.
Working
Initial energy in X:
Final common p.d. is and total capacitance is .
So .
Answer
Less than.
Less than.
Background Concept
Energy stored in a capacitor can be written as
When a charged capacitor is connected to another capacitor, charge flows through connecting wires until both reach the same p.d. If there is no external power supply, total charge is conserved but energy is not necessarily conserved: some energy can be transferred to internal energy of the circuit (heating) and electromagnetic radiation during the transient current.
Understanding the Question
Initially, only capacitor X (capacitance ) is charged to p.d. . Capacitor Y (capacitance ) is uncharged. After connecting them in parallel, both end up at a lower common p.d. You must state whether the total final energy stored in both capacitors is less than, the same as, or greater than the initial energy stored in X.
Approach
Compute and compare:
- initial energy stored in X: ;
- final energy stored in the equivalent parallel combination at the final p.d. .
Step-by-Step Reasoning
- Initial energy:
- From part (c)(i), the final p.d. is
- Two capacitors in parallel have equivalent capacitance
- Final total stored energy (sum of energies in both) equals energy of the equivalent capacitor at :
- Compare: is smaller than , so the final total energy is less.
Physically, the missing energy is dissipated mainly as heat in the connecting wires during the brief current flow (and a small amount as electromagnetic radiation).
Key Takeaways
- is very convenient for comparing energies before/after redistribution.
- Charge is conserved in an isolated capacitor system, but energy stored can decrease due to dissipation during charge flow.
Common Mistakes
- Saying “energy is conserved so it is the same” (not true here because resistive heating occurs).
- Using the original instead of the reduced .
Things to Be Careful About
- You are comparing stored energy in the capacitors, not total energy of the universe.
- Even if wires are said to be “negligible resistance” in circuit diagrams, in reality some energy loss still occurs during redistribution; exam questions expect the conclusion that final stored energy is less.
Answer
The frequency of an alternating current is the number of complete cycles (oscillations) per second.
Number of complete cycles (oscillations) per second.
Background Concept
For an alternating current (a.c.), the current varies periodically with time, repeating the same pattern over and over.
- The period is the time taken for one complete cycle.
- The frequency is the number of complete cycles per second.
They are related by
Understanding the Question
You are asked to state what frequency means for an alternating current. No calculation is required; it is a definition.
Approach
Give the standard physics definition: “how many complete cycles occur each second”. For full credit, include “per second” (or “in 1 second”).
Step-by-Step Reasoning
- An a.c. repeats a cycle (e.g. one full sine-wave pattern).
- Frequency counts how often this full repetition happens in one second.
So frequency is the number of complete cycles (oscillations) per second.
Key Takeaways
- Frequency is a rate: cycles per second.
- links frequency and period.
Common Mistakes
- Saying “time for one cycle” (that is the period, not the frequency).
- Missing “per second”, which is essential.
Things to Be Careful About
- Frequency unit is , meaning (though the unit is not required if you clearly state “per second”).
An alternating current in a resistor of resistance varies with time according to
where is in A and is in s.
Working
Given , so .
Answer
50 ms
Background Concept
A sinusoidal alternating quantity can be written as
where:
- is the peak current,
- is the angular frequency in ,
- is time.
The angular frequency and period are related by
Understanding the Question
You are given the current-time equation
and asked to show that the period is . So you must extract and then calculate .
Approach
- Compare the given equation with to identify .
- Use .
- Convert the result from seconds to milliseconds.
Step-by-Step Reasoning
From
we see the coefficient of inside the sine is the angular frequency:
Now calculate period:
Convert seconds to milliseconds ():
Key Takeaways
- In , the coefficient of is .
- Use for any sinusoid.
Common Mistakes
- Using (incorrect; that would only work if is forgotten).
- Treating as the frequency instead of angular frequency .
Things to Be Careful About
- Keep track of units: comes out in seconds from .
- Always convert to ms only at the end.
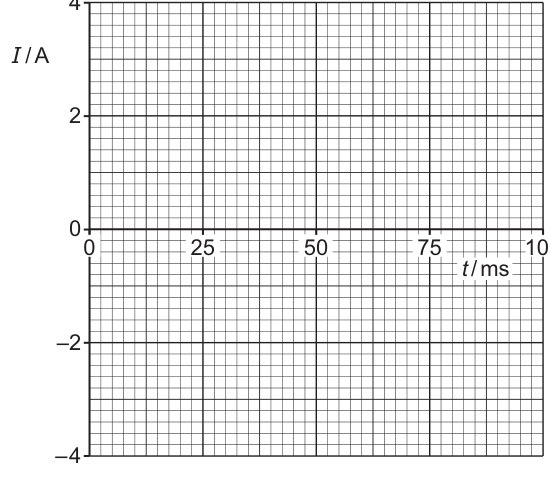
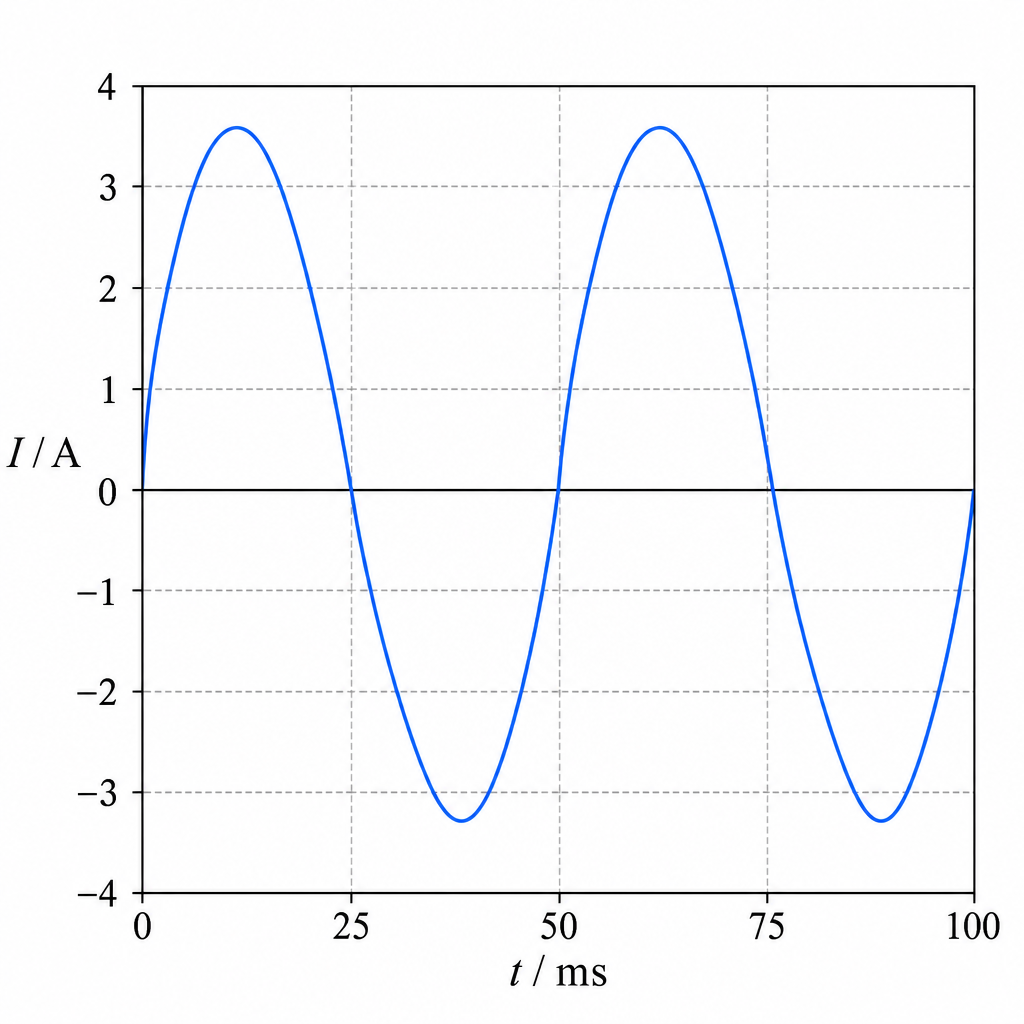
Answer
A sine wave of amplitude and period , starting at at with positive gradient, completing two full cycles between and .
Key points: at , at , at , at , then repeat to .
Sinusoidal I–t graph with amplitude 3.5 A, period 50 ms, starting at 0 with positive slope; two full cycles from 0 to 100 ms.
Background Concept
For a sinusoidal alternating current
- is the peak (amplitude).
- The period is .
A sine wave has standard features over one period:
- starts at zero and rises if it is a positive sine,
- reaches +peak at ,
- returns to zero at ,
- reaches -peak at ,
- returns to zero at .
Understanding the Question
You must sketch against from to for
So you need the correct amplitude (), the correct period ( from part (i)), and the correct phase (starts at going positive).
Approach
- Read off .
- Use .
- Mark the key quarter-period times and corresponding current values.
- Draw a smooth sine curve through these points for two periods (since ).
Step-by-Step Reasoning
- Peak current:
- Period from (i):
Quarter period:
Now list points for one cycle:
- at : (since ) and it rises (positive gradient).
- at : .
- at : .
- at : .
- at : .
Then repeat the same pattern for the second cycle from to .
Key Takeaways
- The amplitude sets the vertical scale; the period sets the horizontal repetition.
- For , the graph starts at zero and initially increases.
Common Mistakes
- Using amplitude instead of (confusing peak with r.m.s.).
- Drawing only one cycle instead of two between and .
- Starting at the peak at (that would correspond to a cosine).
Things to Be Careful About
- Ensure the curve crosses the time axis at .
- Peaks should align at and ; troughs at and .
- Use a smooth sinusoidal shape rather than straight line segments.
Determine the root-mean-square (r.m.s.) current in the resistor.
r.m.s. current = ______
Working
For a sinusoidal current,
Answer
2.47 A
Background Concept
The root-mean-square (r.m.s.) value of an alternating current is the value of a steady (d.c.) current that would produce the same mean power (heating effect) in a resistor.
For a sinusoidal current
the r.m.s. value is
Understanding the Question
The peak current is the amplitude in the given equation , so . You must calculate .
Approach
Identify and divide by . No use of resistance is needed for this part.
Step-by-Step Reasoning
From the equation,
Then
Numerically,
Key Takeaways
- For a sine wave: .
- r.m.s. relates to heating/power equivalence in resistors.
Common Mistakes
- Using (incorrect).
- Treating as the r.m.s. value rather than the peak value.
Things to Be Careful About
- Quote the r.m.s. current in amperes with appropriate significant figures (typically 3 s.f. here: ).
Use data from (b), including your answer in (b)(iii), to show by calculation that the mean power in the resistor is half of the peak power.
Working
Mean power:
Peak power:
Answer
Mean power is half of peak power (P_mean = 0.50 P_peak).
Background Concept
For a resistor of resistance , instantaneous electrical power is
For a sinusoidal current, the current changes continuously, so the instantaneous power also changes. The mean power over a cycle is found using the r.m.s. current:
The peak power occurs when the current is at its maximum magnitude :
For a sine wave, , which leads to a factor of 2 difference in the powers.
Understanding the Question
You have a resistor and a current
So and from part (b)(iii) . You must use these to show that the mean power is half the peak power.
Approach
- Calculate using .
- Calculate using .
- Compare by ratio (or show algebraically that using gives a factor ).
Step-by-Step Reasoning
Mean power:
Peak power (at ):
Compare:
Hence,
(You can also see this directly since for a sinusoid, so is half of .)
Key Takeaways
- For a resistor, power depends on .
- Mean power in a resistor with sinusoidal a.c. is found using .
- Because , mean power is half peak power.
Common Mistakes
- Using without having (or correctly relating) the voltage.
- Using (the mean current over a full cycle is zero, but mean power is not).
- Forgetting to square the current in .
Things to Be Careful About
- Distinguish clearly between peak current and r.m.s. current .
- When comparing powers, it is often easiest to form a ratio so units cancel and the factor of 2 is obvious.
- Quote powers in and use standard form where appropriate.
Electrons in a vacuum are accelerated from rest through a potential difference (p.d.) to form a beam. The electrons each have mass and charge .
The beam is incident on a graphite crystal that acts as a diffraction grating. After passing through the crystal, the beam reaches a fluorescent screen. An interference pattern is observed on this screen.
Answer
An interference pattern shows electrons undergo diffraction and interference, so electrons have wave nature (wave-particle duality).
Electrons show wave behaviour (wave-particle duality).
Background Concept
Interference and diffraction are characteristic behaviours of waves. Interference patterns (bright and dark fringes) arise when waves superpose and produce regions of constructive and destructive interference.
In quantum physics, particles such as electrons can also behave as waves. This is called wave-particle duality. Evidence for the wave nature of matter is provided when particles produce diffraction/interference patterns.
Understanding the Question
A beam of electrons is accelerated in a vacuum and then sent through a graphite crystal, which acts like a diffraction grating. A fluorescent screen shows an interference pattern after the electrons pass through the crystal.
The question asks what this observation implies about the nature of electrons.
Approach
Use the key idea: a diffraction grating produces an interference pattern only if the incident entity behaves like a wave with a wavelength comparable to the atomic spacing in the crystal.
Step-by-Step Reasoning
- The graphite crystal has a regular atomic structure, like a grating for waves.
- The observed pattern on the fluorescent screen is an interference pattern.
- Interference requires superposition of waves, so the electrons must be exhibiting wave behaviour.
- Therefore, electrons have wave properties (in addition to their known particle properties), i.e. wave-particle duality.
Key Takeaways
- Interference/diffraction patterns are direct evidence of wave behaviour.
- Electrons (matter) exhibit wave-particle duality.
Common Mistakes
- Saying only “electrons are waves” without acknowledging they also show particle behaviour (duality).
- Mentioning photons/light instead of electrons.
Things to Be Careful About
- The key mark point is the connection: interference pattern (\Rightarrow) wave nature.
- Keep the statement general: electrons have wave properties / behave like waves in this experiment.
Determine an expression, in terms of , and , for the momentum of an electron in the beam.
= ______
Working
Energy gained from p.d. :
Momentum :
Answer
p = \sqrt{2mqV}
Background Concept
When a charge moves through a potential difference (V), its electrical potential energy changes by
If the electron starts from rest in a vacuum, we usually assume (at these typical exam speeds) that this electrical energy transfer becomes kinetic energy:
Momentum for non-relativistic speeds is
Understanding the Question
Each electron starts from rest and is accelerated through a potential difference (V). You are asked to find an expression for the electron momentum (p) in terms of (m), (q), and (V).
So you need to connect (V) to the electron speed (v), then convert (v) to (p).
Approach
- Use the energy conversion (qV = \frac{1}{2}mv^2) to find (v).
- Substitute (v) into (p = mv).
Step-by-Step Reasoning
Start with the energy gained from the potential difference:
Solve for (v):
Now use (p = mv):
Take (m) inside the square root carefully:
This gives the required expression.
Key Takeaways
- Potential difference transfers energy (qV) to a charge.
- For an electron starting from rest: (qV = \frac{1}{2}mv^2).
- Combine with (p = mv) to get (p = \sqrt{2mqV}).
Common Mistakes
- Using (qV = mv^2) (missing the (\tfrac{1}{2})).
- Writing (p = \sqrt{\frac{2qV}{m}}) (forgetting the factor of (m) from (p=mv)).
- Confusing charge sign: the magnitude is used; momentum is a magnitude here.
Things to Be Careful About
- This derivation assumes non-relativistic speeds. At very large (V), relativity would be needed, but A-Level questions typically intend the classical result.
- Keep algebra under the square root consistent: (m\sqrt{\frac{1}{m}} = \sqrt{m}), not (\frac{m}{\sqrt{m}}) unless simplified correctly.
The p.d. through which the electrons are accelerated is now increased to a greater value.
Describe and explain the effect of this change on the interference pattern observed.
Answer
Increasing increases electron momentum (since ), so
decreases. Hence diffraction angles reduce and the interference fringes/rings become closer together (pattern contracts towards the centre).
Higher V gives smaller (\lambda), so smaller diffraction angle and reduced fringe/ring spacing (pattern contracts).
Background Concept
For matter waves, the de Broglie wavelength is
so higher momentum means shorter wavelength.
In diffraction/interference, the characteristic diffraction angle generally increases with wavelength. For a grating-like spacing (d), maxima satisfy a condition like
So if (\lambda) decreases, then for the same order (n) the angle (\theta) decreases.
Understanding the Question
The electrons are accelerated through a potential difference (V) and produce an interference pattern after passing through graphite. Now (V) is increased.
You must describe what happens to the pattern and explain why.
Approach
- Use the result from part (b): increasing (V) increases the electron speed and momentum.
- Use (\lambda = h/p): increasing (p) decreases (\lambda).
- Smaller (\lambda) gives smaller diffraction angles, so the pattern shrinks (fringes/rings get closer together).
Step-by-Step Reasoning
- From energy gain, (p = \sqrt{2mqV}). If (V) increases, then (p) increases.
- De Broglie wavelength:
So when (p) increases, (\lambda) decreases.
- Diffraction/interference depends on wavelength compared with the crystal spacing. A smaller (\lambda) leads to smaller values of (\theta) for the same diffraction order.
- On a screen a distance away, smaller (\theta) means the bright fringes/rings appear closer to the centre, i.e. smaller spacing between features and a more "compressed" pattern.
Key Takeaways
- Increasing accelerating p.d. increases momentum.
- Higher momentum (\Rightarrow) smaller de Broglie wavelength.
- Smaller wavelength (\Rightarrow) less diffraction, hence a more compact interference pattern.
Common Mistakes
- Saying “fringes get further apart” (it is the opposite when (\lambda) decreases).
- Forgetting to mention the link (V \uparrow \Rightarrow p \uparrow) before using (\lambda = h/p).
Things to Be Careful About
- Be explicit about both the description (what you see) and the explanation (why it changes).
- Use the correct direction of proportionality: (\lambda \propto 1/p), not (\lambda \propto p).
The electrons are now accelerated through different values of , resulting in pairs of corresponding values for and the de Broglie wavelength .
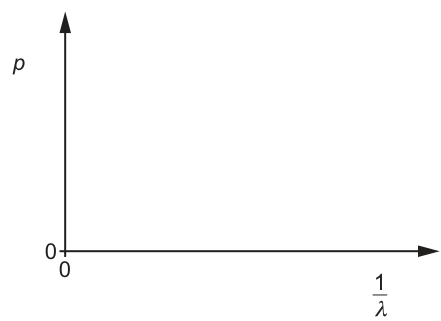
Working
From de Broglie relation:
Answer
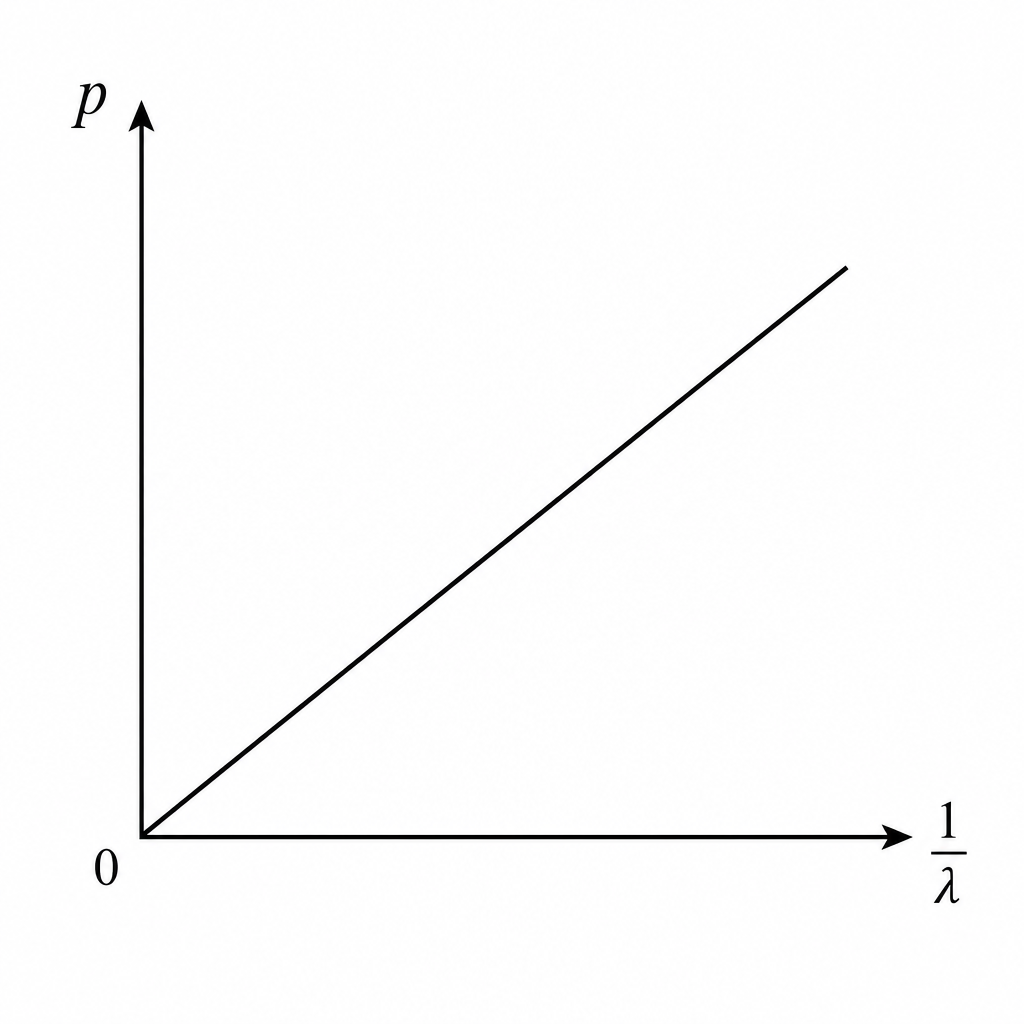
Straight line through the origin with positive gradient.
Straight line through origin, p proportional to 1/\lambda.
Background Concept
The de Broglie relation connects momentum and wavelength:
If you want to plot a straight-line graph, rewrite it in the form (y = mx + c). Here, choosing (p) as (y) and (\frac{1}{\lambda}) as (x) gives a linear relationship.
Understanding the Question
You are asked to sketch how electron momentum (p) varies with (\frac{1}{\lambda}) on axes that start at the origin.
So you need the mathematical relationship between (p) and (\frac{1}{\lambda}).
Approach
Rearrange (\lambda = \frac{h}{p}) to make (p) the subject and express it in terms of (\frac{1}{\lambda}). Then infer the graph shape (straight line, intercept, gradient sign).
Step-by-Step Reasoning
Start with:
Invert both sides:
Rearrange to make (p) the subject:
This is of the form (y = mx) with:
- (y \equiv p)
- (x \equiv \frac{1}{\lambda})
- gradient (m = h)
- intercept (c = 0)
So the sketch is a straight line through the origin with positive gradient.
Key Takeaways
- Rearranging equations to (y = mx + c) tells you the graph shape.
- (p) is directly proportional to (\frac{1}{\lambda}) with proportionality constant (h).
Common Mistakes
- Drawing a curve (it should be a straight line).
- Drawing a non-zero intercept (it passes through the origin).
- Plotting (p) against (\lambda) instead of (1/\lambda).
Things to Be Careful About
- The axes are labelled (p) and (1/\lambda), so your sketch must match those variables.
- Ensure the gradient is positive: as (1/\lambda) increases, (p) increases.
Answer
The gradient represents the Planck constant, .
Planck constant, h
Background Concept
If a graph is a straight line described by
the gradient is (m).
For de Broglie waves,
so rearranging can produce a straight-line relationship where the gradient equals (h).
Understanding the Question
The graph in Fig. 9.1 is (p) (vertical axis) against (\frac{1}{\lambda}) (horizontal axis). You are asked what physical quantity the gradient represents.
Approach
Write the relationship between (p) and (\frac{1}{\lambda}) in the form (p = (\text{constant})\left(\frac{1}{\lambda}\right)). The constant multiplying (\frac{1}{\lambda}) is the gradient.
Step-by-Step Reasoning
From de Broglie:
Rearrange:
Comparing with (y = mx):
- (y \equiv p)
- (x \equiv \frac{1}{\lambda})
- (m = h)
So the gradient is the Planck constant.
Key Takeaways
- Linearising an equation lets you interpret gradients physically.
- A plot of (p) against (1/\lambda) has gradient (h).
Common Mistakes
- Saying the gradient is (1/h) (that would be for a plot of (1/\lambda) against (p)).
- Confusing (h) with (\hbar) (reduced Planck constant).
Things to Be Careful About
- Always match the plotted variables to the rearranged equation before reading off what the gradient represents.
Radioactive decay is both random and spontaneous.
Answer
Random means it is impossible to predict which nucleus will decay, or the exact time at which any particular nucleus will decay.
Impossible to predict which nucleus decays or when a particular nucleus will decay.
Background Concept
Radioactive decay happens because some nuclei are unstable. For a large number of identical unstable nuclei, we can predict the average behaviour (for example, the activity decreases exponentially), but an individual decay event is governed by probability.
Understanding the Question
You are asked to define what “random” means in the statement “radioactive decay is random and spontaneous”. This is specifically about the unpredictability of individual decay events.
Approach
Give an exam-definition that mentions unpredictability at the level of a single nucleus (which one decays and when), not the overall half-life behaviour of a large sample.
Step-by-Step Reasoning
- Consider a sample containing many identical unstable nuclei.
- Even if two nuclei are identical, you cannot say “this nucleus will decay at time ”.
- You also cannot predict which nucleus in the sample will be the next to decay.
- You can only talk about probabilities per unit time (decay constant) and average count rates.
Key Takeaways
- “Random” refers to the unpredictability of individual decay events.
- Only statistical/average predictions are possible for large numbers of nuclei.
Common Mistakes
- Saying “random means it decays without warning” without mentioning unpredictability of which nucleus/when.
- Confusing randomness with spontaneity (external conditions not affecting decay).
Things to Be Careful About
- Include both aspects for full credit: (1) which nucleus, (2) exact time of decay.
Answer
Spontaneous means the decay occurs by itself without any external influence (and is not affected by physical/chemical conditions such as temperature or pressure).
Decay occurs without external influence; unaffected by physical/chemical conditions.
Background Concept
“Spontaneous” in radioactive decay means the nucleus decays on its own; it does not need to be triggered by collisions, heating, illumination, chemical reactions, etc. The decay probability per unit time is an inherent property of the nucleus.
Understanding the Question
You must state what “spontaneous” means when describing radioactive decay.
Approach
Write a brief definition: “no external cause/trigger” and (commonly credited) “independent of external conditions”.
Step-by-Step Reasoning
- If a process is spontaneous, it happens without requiring an outside action to start it.
- For radioactive decay, changing temperature, pressure, or chemical bonding does not change the decay constant in any significant way at A level.
Key Takeaways
- Spontaneous = occurs by itself, not initiated by outside factors.
Common Mistakes
- Writing about unpredictability of timing (that is “random”, not “spontaneous”).
- Saying “it happens quickly” or “it happens naturally” (too vague).
Things to Be Careful About
- Avoid mixing the two terms: “random” is about unpredictability; “spontaneous” is about lack of external trigger.
Answer
Successive measurements of count rate in equal time intervals fluctuate about a mean value (e.g. different counts in each interval / Poisson-type fluctuations).
Counts in equal time intervals fluctuate about a mean (statistical fluctuations).
Background Concept
If decay events are random, then even with a constant average activity, the actual number of decays detected in any fixed time interval will vary due to statistical fluctuations. This is typical of a Poisson process.
Understanding the Question
You must give one piece of evidence that supports the claim that decay is random. The evidence should come from an observation/experiment, not just a restatement of the definition.
Approach
Use the standard lab evidence: measure counts in equal intervals and show they vary around an average rather than being identical each time.
Step-by-Step Reasoning
- Set up a GM tube (or other detector) and count the number of decays detected in, say, .
- Repeat for many intervals under the same conditions.
- You find the counts are not the same each time; they scatter about a mean.
- This scatter is evidence that each decay is probabilistic rather than occurring at fixed, predictable times.
Key Takeaways
- Random processes produce fluctuations in repeated measurements.
- Radioactive count data shows statistical spread even when conditions are unchanged.
Common Mistakes
- Using “it has a half-life” as evidence (this shows exponential trend, but the clearer evidence of randomness is the count fluctuations).
- Saying “it cannot be stopped” (that relates more to spontaneity/independence from conditions).
Things to Be Careful About
- The question asks for one piece of evidence, so one clear experimental observation is enough.
- Make sure it is evidence for randomness (fluctuations), not spontaneity (independence from external factors).
Answer
- Fission: a heavy nucleus splits into two (or more) smaller nuclei, usually releasing neutrons.
- Fusion: two light nuclei combine to form a heavier nucleus.
- Fusion requires very high temperature/pressure to overcome electrostatic repulsion; fission can be initiated by neutron absorption and can lead to a neutron chain reaction.
Fission: heavy nucleus splits (releasing neutrons); Fusion: light nuclei combine; Fusion needs very high T/pressure, fission can be neutron-induced and can form a chain reaction.
Background Concept
In nuclear reactions, the nucleus changes identity. Two major energy-producing types are:
- Fission: breaking a heavy nucleus into smaller nuclei.
- Fusion: joining light nuclei to make a heavier nucleus.
Both can release energy because of changes in nuclear binding energy.
Understanding the Question
You must describe differences between fission and fusion (3 marks). Typically, marks are awarded for distinct contrasts: what happens to the nuclei, what particles are involved/produced, and what conditions are needed.
Approach
State at least three clear, separate differences:
- Nature of the reaction (split vs join)
- Typical nuclei involved (heavy vs light)
- Conditions/trigger/chain reaction (neutron-induced chain reaction vs high temperature/pressure)
Step-by-Step Reasoning
- What happens:
- Fission: a large nucleus (e.g. uranium/plutonium) splits into two medium-mass nuclei.
- Fusion: two small nuclei (e.g. hydrogen isotopes) combine to form a larger nucleus (e.g. helium).
- Particles involved/produced:
- Fission often releases 2 or 3 neutrons as well as gamma radiation.
- Fusion does not proceed via neutron-triggering; it may produce a neutron in some specific fusion reactions (e.g. D-T), but it is not a chain reaction mechanism in the same way.
- Conditions:
- Fusion requires extremely high temperatures so nuclei have enough kinetic energy to get close enough for the strong nuclear force to act (overcoming Coulomb repulsion).
- Fission can be started by absorbing a slow neutron and can be sustained as a chain reaction because emitted neutrons can cause further fissions.
Key Takeaways
- Fission: heavy nuclei split; can be neutron-induced; can form a chain reaction.
- Fusion: light nuclei join; needs very high temperature/pressure.
Common Mistakes
- Saying “fission happens in the Sun” (the Sun is mainly fusion).
- Only giving one difference (e.g. just “split vs join”) and expecting full marks.
- Stating “fusion releases neutrons and fission doesn’t” (not reliably true across all reactions).
Things to Be Careful About
- Keep the contrasts paired (what fission does vs what fusion does).
- If you mention neutrons, link them correctly to chain reaction for fission.
Explain, with reference to the variation of binding energy per nucleon with nucleon number, why the processes of nuclear fission and nuclear fusion both result in a release of energy.
Answer
For both processes the products have a greater binding energy per nucleon (they are closer to the peak near ).
So the total binding energy increases and the mass decreases; the increase in binding energy is released as energy ().
Products are closer to the peak of binding energy per nucleon, so total binding energy increases and the difference is released as energy (mass defect).
Background Concept
Binding energy is the energy needed to separate a nucleus into its individual nucleons. A convenient quantity is binding energy per nucleon, which shows how tightly bound nucleons are on average.
A key fact is the shape of the binding energy per nucleon curve:
- It rises steeply for light nuclei.
- It reaches a maximum around iron/nickel (roughly ).
- It then slowly decreases for very heavy nuclei.
If a nuclear reaction produces nuclei with higher binding energy per nucleon, then the nucleons are more tightly bound after the reaction. That means the total binding energy increases, and the difference appears as released energy (kinetic energy of products, gamma radiation, etc.). This corresponds to a mass defect via
Understanding the Question
You must explain (not just state) why both fission and fusion release energy, specifically referring to how binding energy per nucleon varies with nucleon number .
Approach
Use the binding energy per nucleon curve as the central argument:
- Fusion: light nuclei move up the curve toward the peak.
- Fission: very heavy nuclei split into medium nuclei closer to the peak.
In both cases, binding energy per nucleon increases, so energy is released.
Step-by-Step Reasoning
- Interpret the curve
- On the graph of binding energy per nucleon vs nucleon number , the maximum is around iron.
- “Moving toward the peak” means ending up with nuclei that have a larger binding energy per nucleon.
- Fusion releases energy
- Start with two light nuclei (small ), which lie on the rising part of the curve.
- After fusion you get a nucleus with larger that is higher on the curve (larger binding energy per nucleon).
- Since each nucleon is more tightly bound on average, the total binding energy of the final nucleus is larger than the total binding energy of the initial nuclei.
- The increase in binding energy must come from somewhere: it is released as energy to the surroundings.
- Fission releases energy
- Start with a very heavy nucleus (large ), which lies on the gently falling part of the curve.
- After fission you produce two medium-mass nuclei (smaller values) that are closer to and therefore higher on the curve.
- Again, binding energy per nucleon increases, so the total binding energy of the products is greater than that of the original heavy nucleus.
- The increase in binding energy is released (often as kinetic energy of fragments plus emitted neutrons and gamma radiation).
- Link to mass defect
- Greater binding energy means the final bound system has a smaller mass than the initial system.
- The “missing mass” is converted to energy according to .
Key Takeaways
- Energy is released when a reaction produces nuclei with higher binding energy per nucleon.
- Fusion (light nuclei) and fission (very heavy nuclei) both move nuclei toward the iron peak.
- Released energy corresponds to an increase in binding energy / mass defect.
Common Mistakes
- Saying “energy is released because products have lower mass” without linking it to the binding energy per nucleon curve (the question demands that reference).
- Claiming fission moves nuclei away from the peak.
- Confusing “binding energy per nucleon increases” with “binding energy decreases”: higher binding energy means more tightly bound.
Things to Be Careful About
- Use correct language: “binding energy per nucleon increases” or “products are more tightly bound”.
- Mention the peak near iron/nickel () as the reference point.
- Don’t imply fusion of all nuclei releases energy: fusion beyond iron would not be energetically favourable.