Physics 9702/41 — October/November 2024
Cambridge A-Level · A Level Structured Questions · worked solutions for every part, with the mark scheme
Topics Gravitational Fields · Motion in a Circle · Temperature · Ideal Gases · Thermodynamics · Oscillations · +8 more
Answer
For two point (or spherical) masses and separated by distance , the gravitational force has magnitude
and acts along the line joining their centres, attracting each mass towards the other.
F = G m1 m2 / r^2, attractive along the line joining the centres.
Background Concept
Newton's law of gravitation describes the gravitational force between two masses. For masses and with separation , the magnitude of the force is proportional to the product of the masses and inversely proportional to the square of the separation. The constant of proportionality is the gravitational constant .
Understanding the Question
You are asked to state the law, so you need the formula for the magnitude and a statement about the direction/nature of the force (that it is attractive and acts along the line joining the masses).
Approach
Write the inverse-square formula and then add the direction: along the line joining the centres, towards each other.
Step-by-Step Reasoning
- The magnitude is
- The force is attractive, so each mass experiences a force directed towards the other mass, along the line joining their centres.
Key Takeaways
- Gravitational force follows an inverse-square dependence on separation.
- The force acts along the line joining the centres and is always attractive.
Common Mistakes
- Omitting the (writing ).
- Forgetting to state the direction (line of centres) or that the force is attractive.
- Mixing up the symbols (e.g. writing instead of ).
Things to Be Careful About
- is the separation between the centres of the masses.
- The law is exact for point masses; for spherically symmetric masses it applies using centre-to-centre separation.
A planet may be considered as a uniform sphere.
A satellite is in circular orbit of period around the planet at a height above the surface.
The height of the orbit can be adjusted by use of the satellite’s rocket engines.
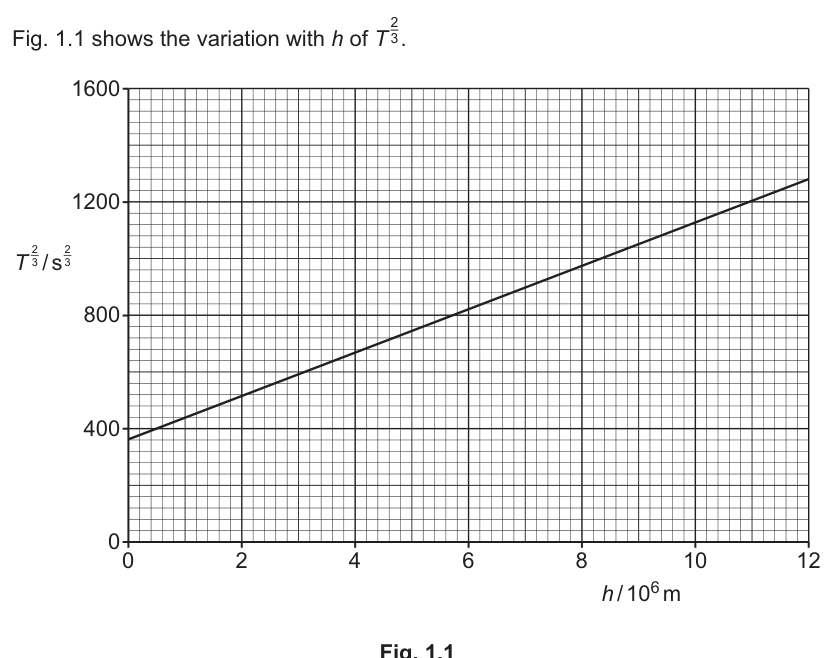
Fig. 1.1 shows the variation with of .
Answer
The satellite experiences a gravitational force towards the centre of the planet. This force provides the centripetal (resultant) force, so the satellite has centripetal acceleration towards the centre and hence follows a circular path.
Gravity acts towards the centre and provides the centripetal force, giving centripetal acceleration so the orbit is circular.
Background Concept
For motion in a circle at constant speed, the velocity continually changes direction. A change in velocity means there must be an acceleration. In uniform circular motion this acceleration is always directed towards the centre of the circle and is called the centripetal acceleration. Therefore the resultant force must also be towards the centre:
Understanding the Question
The question asks you to explain using forces why the satellite's orbit is circular. The key idea is that the gravitational force from the planet is always directed towards the planet's centre, so it acts as the centripetal force needed for circular motion.
Approach
- Identify the force acting on the satellite (gravity).
- State its direction (towards the planet's centre).
- Link that to centripetal force/acceleration, concluding the motion is circular.
Step-by-Step Reasoning
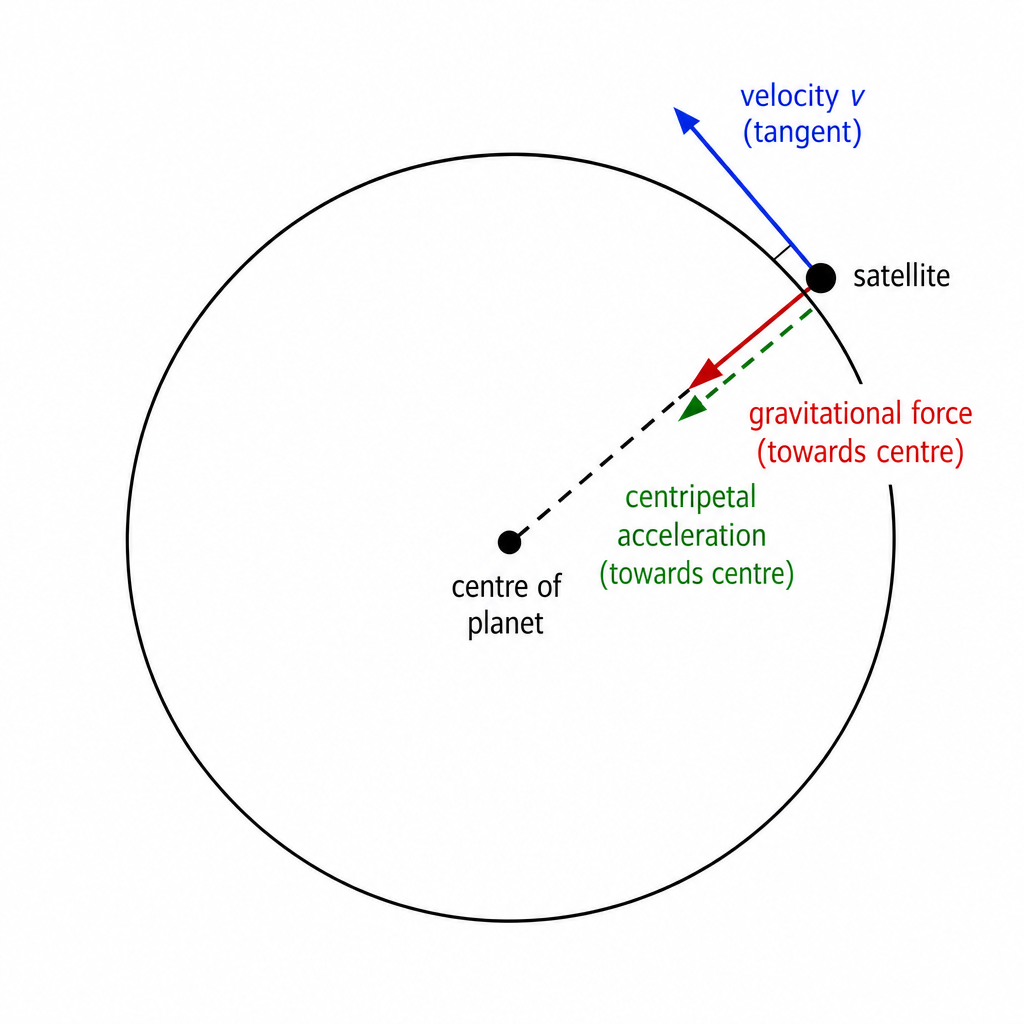
- The planet exerts a gravitational force on the satellite directed radially inward (towards the planet's centre).
- For a circular orbit, the required resultant force must be towards the centre at all times (centripetal force).
- Since gravity provides this inward resultant force, the satellite has centripetal acceleration and its path is circular (with its velocity tangential to the orbit at each point).
Key Takeaways
- Circular motion requires a centripetal acceleration and therefore a centripetal (inward) resultant force.
- In an orbit, gravity provides that inward force.
Common Mistakes
- Saying "there is no force" because the satellite is in space.
- Claiming the force is tangential (it is radial, towards the centre).
- Confusing "centripetal force" as a new force rather than the resultant of real forces (here, gravity).
Things to Be Careful About
- The satellite can have constant speed but still accelerate because its velocity direction changes.
- The explanation must mention force direction towards the centre, not just "it goes round".
Use Newton’s law of gravitation to show that and are related by
where is the gravitational constant and and are constants that depend on the properties of the planet.
Working
Let the planet have mass and radius . Orbital radius
Gravitational force on satellite of mass :
For a circular orbit,
So
Cancel and rearrange:
With ,
Answer
(h + B)^3 = (GA / (4 pi^2)) T^2
Background Concept
A satellite in a circular orbit requires a centripetal force
directed towards the centre of the circle. For an orbit, the only significant force is gravity from the planet:
In a stable circular orbit, gravity provides exactly the centripetal force, so . Also, for one orbit of circumference completed in period ,
Understanding the Question
You are told the planet is a uniform sphere, so it behaves like a point mass at its centre for external gravitational forces. The satellite is at height above the surface, so its distance from the centre is the planet radius plus . The question asks you to derive a relation between and in the given form, identifying constants and that depend only on the planet.
Approach
- Write the orbital radius as where is the planet radius.
- Write gravitational force in terms of planet mass .
- Write centripetal force for circular motion and express in terms of and .
- Equate forces and rearrange to isolate in terms of .
Step-by-Step Reasoning
- Distance from the planet centre:
- Gravitational force magnitude on satellite of mass :
- Centripetal force needed for a circular path of radius :
- The orbital speed in terms of period:
- Substitute into :
- Set :
Cancel and rearrange:
Finally replace with to match the required form.
Key Takeaways
- For circular orbits: gravitational force provides the centripetal force.
- Combining with and leads to .
Common Mistakes
- Using instead of .
- Forgetting to substitute (or mixing up factors).
- Algebra slip: not getting proportional to .
Things to Be Careful About
- The in the gravitational equation is centre-to-centre distance.
- Cancel the satellite mass correctly; orbital period does not depend on the satellite mass.
Use the gradient and intercept of the line in Fig. 1.1 to determine values for and . Give units with your answers.
= ______ unit ______
= ______ unit ______
Working
From
where
From Fig. 1.1, using points and :
Intercept , so
Also
Answer
A = 1.16 × 10^24 kg, B = 4.5 × 10^6 m
Background Concept
When a relation can be rearranged into the straight-line form
a plot of against has gradient and intercept . Here, the orbital derivation gives
To match the plotted graph of against , we take the cube root of both sides:
So a straight-line graph is expected.
Understanding the Question
You are given a graph of (vertical axis) against (horizontal axis, but scaled as ). You must use the gradient and intercept of the straight line to find the constants and in the equation. From the physics, corresponds to the planet mass and to the planet radius.
Approach
- Linearise the given relationship to show it has the form .
- Identify and in terms of and :
- Read two well-separated points to calculate the gradient and read the intercept.
- Convert the gradient into SI units because the -axis uses .
- Solve for and then for from the expression for .
Step-by-Step Reasoning
- Start from
Rearrange for :
Define
so
This matches with , , and .
- Read gradient from the graph.
Using the given approximate points and on the plotted axes:
- Change in :
- Change in the plotted coordinate is , but each on the axis represents . So
Therefore the gradient in SI units is
- Find from the intercept.
The intercept at is . Since ,
- Find from the gradient expression.
We have
Compute
Then
(The unit comes out as kg because has units .)
Key Takeaways
- Taking powers of an equation can linearise it; here makes a straight line with .
- The gradient gives a combination of constants; the intercept then separates out .
- Always correct for axis scaling when converting gradients into SI units.
Common Mistakes
- Using the plotted x-values as metres (forgetting the scale).
- Taking the intercept as directly (it is , not ).
- Rearranging wrongly (e.g. using instead of its reciprocal).
- Missing or incorrect units for and .
Things to Be Careful About
- Choose two points far apart on the best-fit line to reduce gradient uncertainty.
- Keep track of units: gradient here must be in .
- Use an appropriate number of significant figures consistent with the graph reading precision.
Answer
Specific heat capacity is the thermal energy required to raise the temperature of of a substance by (or ), with no change of state.
Thermal energy required to raise the temperature of 1.0 kg of a substance by 1.0 K (no change of state).
Background Concept
Specific heat capacity measures how much energy is needed to change a substance’s temperature.
The relationship is
where is thermal energy transferred, is mass, is specific heat capacity, and is the temperature change.
Understanding the Question
You are asked to define specific heat capacity, so you must give a clear verbal statement including:
- the mass (per kilogram),
- the temperature rise (per kelvin),
- that it is energy required (thermal energy supplied),
- and that there is no change of state.
Approach
Write the standard textbook definition in words. You can also connect it to to ensure you include all required components.
Step-by-Step Reasoning
From
if and , then equals the energy required per kilogram per kelvin. Mentioning “no change of state” distinguishes heating within a phase from energy used in melting/boiling (latent heat).
Key Takeaways
- Specific heat capacity is energy per unit mass per unit temperature rise.
- Unit is .
Common Mistakes
- Missing “per kilogram” or “per kelvin”.
- Saying “heat” without clarifying it means energy transferred.
- Confusing specific heat capacity with specific latent heat (which is energy per kg for a change of state at constant temperature).
Things to Be Careful About
- Use (or equivalently rise) but do not imply the temperature itself is .
- Include “no change of state” for full credit.
Two solid blocks X and Y are made from different metals. The blocks have different initial temperatures. Block Y is initially at room temperature.
The blocks are placed in direct thermal contact with each other at time . Fig. 2.1 shows the variation with of the temperatures of the two blocks.
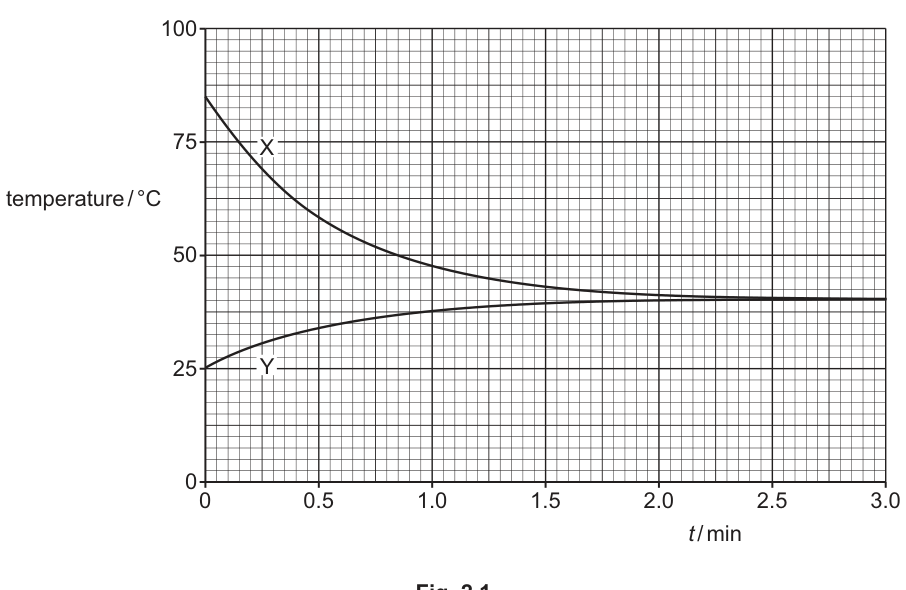
State three conclusions that may be drawn from Fig. 2.1. The conclusions may be qualitative or quantitative.
1 ______
2 ______
3 ______
Answer
- At , block is at about and block is at about .
- The blocks reach the same final temperature (thermal equilibrium) of about .
- Thermal equilibrium is reached at about (the two curves meet), and the rate of temperature change decreases with time (curves become less steep).
Example conclusions: X starts ~85 °C, Y starts ~25 °C; equilibrium temperature ~40 °C; equilibrium reached at ~2.5 min (rate of change decreases with time).
Background Concept
When two objects at different temperatures are placed in thermal contact, thermal energy transfers from the hotter object to the cooler object.
- The transfer continues until both objects reach the same temperature.
- This common temperature is called the thermal equilibrium temperature.
- The rate of heat transfer (and so the rate of temperature change) is typically greatest at the start because the temperature difference is largest, and then decreases as the temperature difference becomes smaller.
Understanding the Question
You are given a temperature–time graph for two metal blocks and placed in direct contact at .
You must state three conclusions that can be read from the graph. These may be:
- numerical readings (initial temperatures, equilibrium temperature, time to reach equilibrium), and/or
- qualitative statements (which direction heat flows, rate changes over time, whether equilibrium is reached).
Approach
Read key features from the graph:
- Read both initial temperatures at .
- Find the final common temperature (where both curves level off / meet).
- Estimate the time at which both temperatures become equal (curves intersect), and/or describe how the slopes change.
Step-by-Step Reasoning
- At , the curve labelled begins at about , and the curve labelled begins at about .
- Both curves move towards the same temperature, and they approach/meet at about . This is the equilibrium temperature.
- The curves intersect at roughly , so that is when both blocks have the same temperature.
- The curves are steep at small and become less steep later, showing the rate of temperature change decreases with time as the temperature difference reduces.
(Any three distinct, correct statements like these would score.)
Key Takeaways
- The equilibrium temperature is the common final temperature.
- The intersection time indicates when both objects have the same temperature.
- A decreasing slope magnitude indicates decreasing rate of energy transfer.
Common Mistakes
- Stating “equilibrium at ” but not identifying it as both blocks having the same temperature.
- Confusing the time when curves are close with the time they are equal (need the intersection).
- Giving three statements that are not distinct (e.g. repeating the same point in different words).
Things to Be Careful About
- Temperature differences can be read in directly from the graph; for differences, .
- Quote approximate values consistent with the graph scale (do not overstate precision).
The ratio is equal to 1.3.
The metal in block Y has a specific heat capacity of .
Determine the specific heat capacity of the metal in block X.
specific heat capacity = ______
Working
At equilibrium, heat lost by = heat gained by :
Given and ,
Answer
3.90 × 10^2 J kg^-1 K^-1
Background Concept
When two bodies exchange thermal energy in an isolated situation (no significant energy loss to surroundings), energy conservation gives:
For each object,
where is the magnitude of the temperature change. Temperature differences in are equal to temperature differences in K.
Understanding the Question
From the graph:
- Block cools from about to the equilibrium temperature .
- Block warms from (room temperature) to .
You are told:
- ,
- ,
and you must find .
Approach
- Write energy balance: .
- Read and from the graph.
- Use the given mass ratio to eliminate and .
- Solve for .
Step-by-Step Reasoning
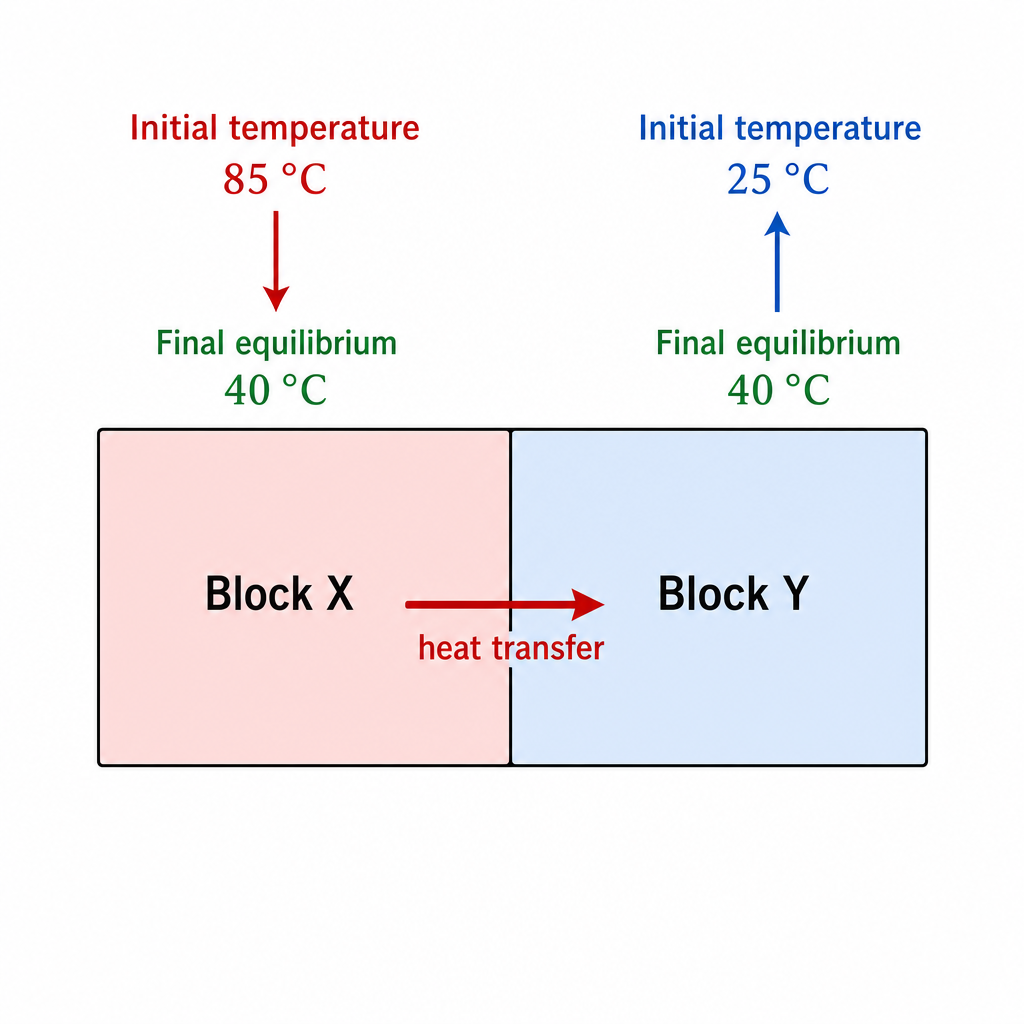
- Temperature changes:
- Energy conservation (assuming negligible losses):
- Rearrange for :
- Substitute and :
This is reasonable: many metals have values of a few hundred .
Key Takeaways
- For two objects exchanging heat, use .
- Read values from the graph using the equilibrium temperature.
- Use mass ratios to simplify without needing the actual masses.
Common Mistakes
- Swapping the temperature changes (using instead of changes to equilibrium).
- Forgetting to use the mass ratio, or inverting it (using instead of ).
- Using final temperature as or instead of the equilibrium value .
- Adding the energies instead of equating loss to gain.
Things to Be Careful About
- Use magnitudes of temperature change; do not introduce negative signs if you are using “lost = gained”.
- Ensure consistent units: in .
- Do not over-round mid-calculation; round to 2–3 significant figures at the end.
Answer
The Avogadro constant is the number of particles (e.g. atoms/molecules) in one mole of a substance.
The Avogadro constant is the number of particles in one mole.
Background Concept
The mole is a unit for “amount of substance” that links macroscopic measurements (like mass) to microscopic particle counts (atoms, molecules, ions, electrons).
The Avogadro constant is the conversion factor between number of particles and amount of substance :
Understanding the Question
You are asked to state what means. This is a definition: what physical quantity it represents.
Approach
Give the definition in words, making clear that it is a number of particles per mole.
Step-by-Step Reasoning
- “Avogadro constant” refers to how many microscopic entities correspond to .
- So define it as the number of particles in one mole (you may say atoms/molecules/particles).
Key Takeaways
- converts between moles and particle number: .
- It is “particles per mole”.
Common Mistakes
- Saying “number of moles in a substance” (that is , not ).
- Forgetting to mention “per mole” or “in one mole”.
Things to Be Careful About
- Use the general term “particles” (or specify atoms/molecules depending on context). The definition should not be restricted to only atoms or only molecules.
State the relationship between the Avogadro constant , the molar gas constant and the Boltzmann constant .
Answer
R = N_A k
Background Concept
There are two common forms of the ideal gas equation:
- macroscopic (molar) form:
- microscopic (particle) form:
where is the amount in moles and is the number of molecules.
Using and comparing the two equations gives the link between constants.
Understanding the Question
You are asked for the relationship between , and .
Approach
Write down the standard relationship that connects the molar gas constant to the Boltzmann constant via the Avogadro constant .
Step-by-Step Reasoning
Starting from and :
Use :
Cancel and :
Key Takeaways
- is the “per mole” version of .
- The conversion factor is : .
Common Mistakes
- Writing (incorrect rearrangement).
- Missing one of the constants (e.g. only stating without mentioning the others explicitly, if the question asks for the relationship).
Things to Be Careful About
- Ensure the algebraic relationship is exact: is larger than by a factor of .
Two samples X and Y of ideal gases are both at thermodynamic temperature .
Sample X has volume and consists of molecules, each of mass .
Sample Y has volume and consists of molecules, each of mass .
Complete Table 3.1 by giving expressions, in terms of some or all of , , , and the constants in (a)(ii), for the quantities indicated.
Table 3.1
| sample X | sample Y | |
|---|---|---|
| pressure | ||
| amount of substance | ||
| mean-square speed of molecules | ||
| internal energy |
Working
Pressure:
Amount of substance:
Mean-square speed:
Internal energy:
Answer
pX = NkT/V, pY = NkT/V; nX = N/NA, nY = 2N/NA; <c^2>X = 3kT/m, <c^2>Y = 3kT/(2m); UX = (3/2)NkT, UY = 3NkT
Background Concept
For an ideal gas, several key relationships connect macroscopic variables to microscopic ones:
- Ideal gas equation (molecular form):
- Amount of substance and Avogadro constant:
- Kinetic theory link between pressure and mean-square speed:
Combining this with gives
- Internal energy of an ideal gas (at this level, taken as translational kinetic energy only): average kinetic energy per molecule is , so
Understanding the Question
Both samples are at the same temperature .
- Sample X: volume , number of molecules , mass of each molecule .
- Sample Y: volume , number of molecules , mass of each molecule .
You must fill a table with expressions for pressure, amount of substance, mean-square speed, and internal energy, for each sample.
Approach
Use the most direct formula for each row:
- pressure: use .
- amount of substance: use .
- mean-square speed: use and substitute the appropriate molecular mass.
- internal energy: use with the appropriate number of molecules.
Step-by-Step Reasoning
Pressure
For X:
For Y, note that both and have doubled:
So both have the same pressure.
Amount of substance
Use .
For X:
For Y, there are molecules:
Mean-square speed
From kinetic theory:
For X, molecular mass is :
For Y, molecular mass is :
So at the same temperature, heavier molecules have a smaller mean-square speed.
Internal energy
Average kinetic energy per molecule is , so
For X:
For Y, number of molecules is :
Note internal energy depends on the number of molecules and temperature, not on the volume.
Key Takeaways
- Using , if both and scale by the same factor at fixed , pressure is unchanged.
- converts particle number to moles.
- : at the same , heavier molecules move more slowly on average.
- At this level, ideal-gas internal energy depends only on and .
Common Mistakes
- Using but then forgetting to convert to (or mixing and ).
- Writing (incorrect constant; should be with molecular mass per molecule, or with molar mass).
- Thinking doubling volume at fixed temperature must halve pressure, without noticing that has also doubled.
Things to Be Careful About
- Distinguish between molecular mass (per molecule, ) and molar mass (per mole).
- Mean-square speed is (proportional to ), whereas r.m.s. speed is (proportional to ).
The temperature of sample X is now varied.
On Fig. 3.1, sketch the variation with thermodynamic temperature of the root-mean square (r.m.s.) speed of the molecules of the gas.
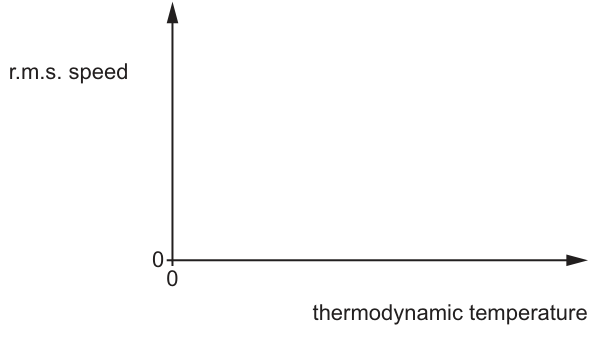
Working
For sample X,
Answer
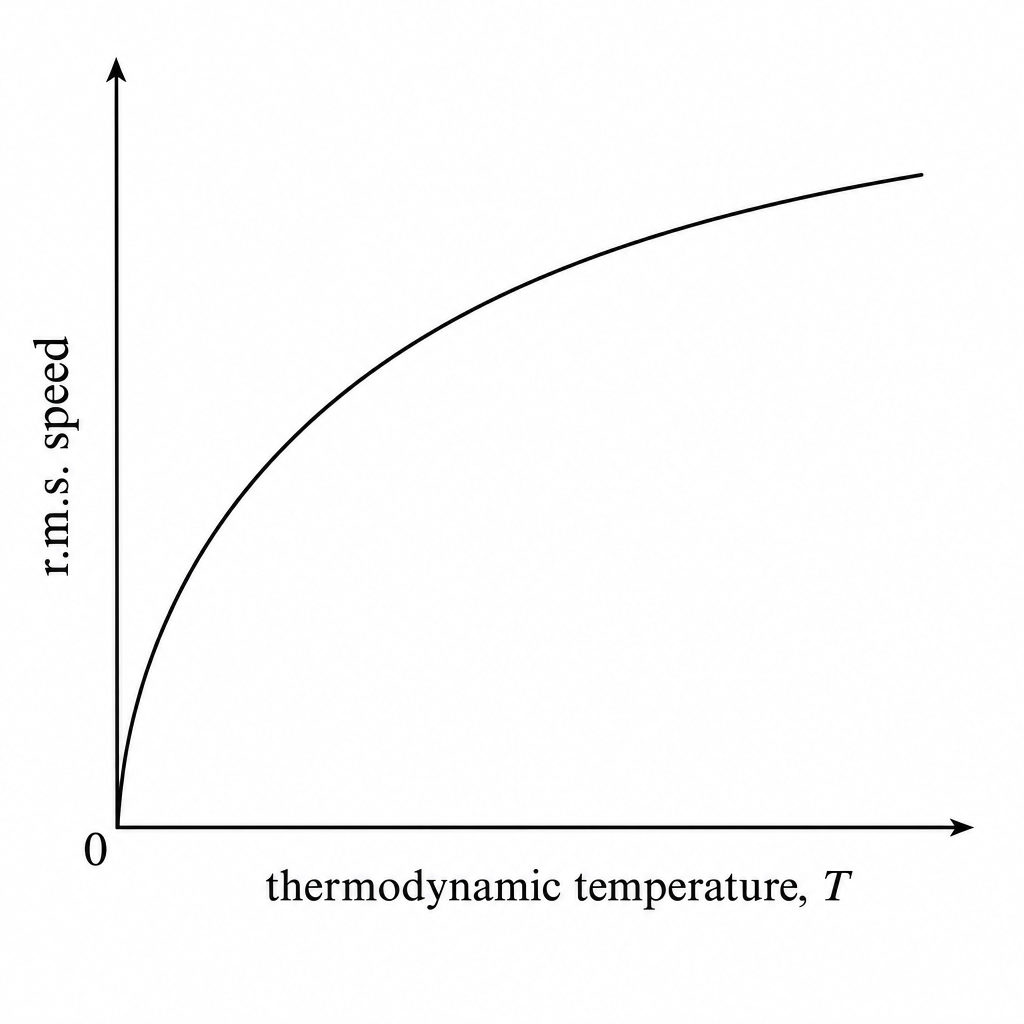
A curve through the origin that increases with with decreasing gradient (square-root shape).
c_rms ∝ √T; curve through origin, increasing with decreasing gradient.
Background Concept
The r.m.s. speed is defined by
For an ideal gas, kinetic theory gives
so
This shows for a fixed gas (fixed molecular mass ).
Understanding the Question
Only sample X is relevant now, and its temperature is varied. You must sketch how changes with thermodynamic temperature on axes starting at the origin.
Approach
- Use the proportionality .
- Translate that into a graph shape: it must pass through and rise, but not as a straight line.
Step-by-Step Reasoning
From
- When , in this idealised model, so the curve passes through the origin.
- As increases, increases.
- Because it is a square-root relationship, the gradient decreases as gets larger (the curve is concave down).
Key Takeaways
- for a given gas.
- Square-root graphs rise quickly at first and then flatten (decreasing gradient).
Common Mistakes
- Drawing a straight line (that would imply ).
- Drawing a curve that does not pass through the origin on a Kelvin-temperature axis.
- Drawing a curve that gets steeper with (wrong curvature).
Things to Be Careful About
- The temperature is thermodynamic (Kelvin) temperature, so the origin represents .
- The y-axis is speed, so it cannot be negative; only the first quadrant is relevant.
Answer
Simple harmonic motion is oscillation in which the acceleration is proportional to the displacement from the equilibrium position and directed towards the equilibrium position:
Acceleration is proportional to displacement from equilibrium and directed towards equilibrium (a ∝ −x, or a = −ω²x).
Background Concept
In simple harmonic motion (SHM), the key physical idea is a restoring effect: whenever the object is displaced from its equilibrium position, something causes it to accelerate back towards equilibrium.
Mathematically, SHM is defined by the relationship between acceleration and displacement from equilibrium:
where:
- is the displacement from equilibrium (can be positive or negative),
- is the acceleration,
- is the angular frequency (a constant for that system).
The minus sign means the acceleration is always opposite in direction to the displacement (i.e. towards equilibrium).
Understanding the Question
The question asks for the meaning of SHM, so you must give the defining condition, not examples (spring, pendulum, etc.). It is a 2-mark definition, so you typically need:
- proportionality to displacement, and
- direction towards equilibrium (negative sign).
Approach
State the definition in words, and (optionally) give the equivalent mathematical form or .
Step-by-Step Reasoning
- If an object is displaced by from equilibrium, then in SHM the acceleration magnitude increases in direct proportion to .
- The acceleration must act towards equilibrium, so its direction is opposite to the displacement, giving .
- Writing the constant of proportionality as gives the standard form .
Key Takeaways
- SHM is defined by .
- You must include both proportionality and the restoring direction (negative sign / “towards equilibrium”).
Common Mistakes
- Saying “motion is sinusoidal” without mentioning acceleration: sinusoidal motion is a consequence, not the definition.
- Missing the direction (“towards equilibrium”) or the negative sign.
- Saying velocity is proportional to displacement (false for SHM).
Things to Be Careful About
- Displacement must be measured from equilibrium, not from an end point.
- Use the word acceleration, not force, unless you explicitly connect it (since implies only if mass is constant).
A block is suspended from a spring, as shown in Fig. 4.1.
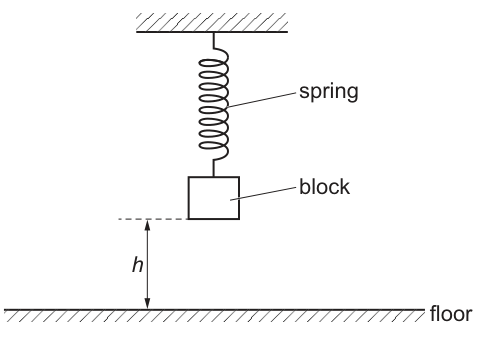
The block is pulled down and released at time . It then oscillates vertically with simple harmonic motion.
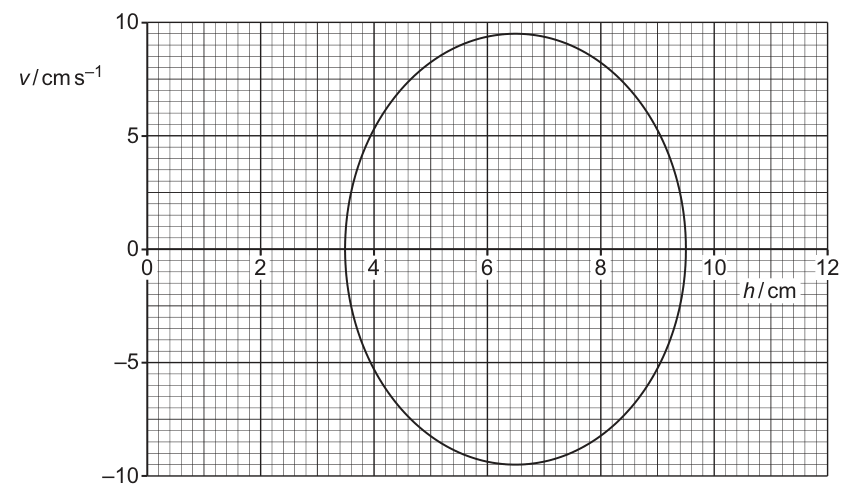
Fig. 4.2 shows the variation of the velocity of the block with height of the base of the block above the floor.
Working
From the – graph, the extreme heights are and .
Answer
3.0 cm
Background Concept
For SHM, the amplitude is the maximum displacement from the equilibrium position.
If you know the maximum and minimum values of the position coordinate (here height ), then:
- the equilibrium height is the midpoint,
- the amplitude is half the total range:
Understanding the Question
The diagram/graph shows plotted against . Even though it is not a direct – graph, the ellipse still tells you the turning points: where the speed is zero (), the block is at maximum or minimum height.
You need the amplitude in cm.
Approach
Read off the two heights at which on the ellipse (leftmost/rightmost intercepts with the -axis), then take half the difference.
Step-by-Step Reasoning
- Turning points occur at .
- From the graph, the ellipse meets the -axis at about and .
- The equilibrium height is the midpoint:
- The amplitude is the displacement from equilibrium to an extreme:
(or equivalently ).
Key Takeaways
- Turning points: .
- Amplitude: half the peak-to-peak position range.
Common Mistakes
- Taking amplitude as or (these are absolute heights, not displacement from equilibrium).
- Using the velocity maximum () for amplitude.
Things to Be Careful About
- Read the axis values carefully; amplitude is a difference of heights, not the centre value.
- Keep units consistent (here cm is fine).
Working
From the graph, and from (i) .
For SHM,
So
Answer
3.2 rad s^-1
Background Concept
In SHM, the displacement can be written as
Differentiating gives the velocity:
So the maximum speed occurs when , giving the key result:
This is true regardless of whether the motion is horizontal or vertical, as long as it is SHM.
Understanding the Question
You are given a – plot (often called a phase-space plot). The ellipse shows that velocity is greatest as the block passes through equilibrium height, and zero at the turning points.
You must “show that” , so you need to show the calculation leading to that value.
Approach
- Find the amplitude from the extreme values.
- Read the maximum speed from the top/bottom of the ellipse.
- Use and rearrange.
Step-by-Step Reasoning
- From part (i), .
- From the graph, the maximum speed is about .
- Apply
- Rearrange:
- Substitute values:
The unit is equivalent to for angular frequency (radian is dimensionless).
Key Takeaways
- Use to link speed and amplitude.
- A – (or –) ellipse contains both and .
Common Mistakes
- Using (not true; it’s maximum that equals ).
- Mixing up equilibrium height (centre of ellipse) with amplitude.
- Converting cm to m unnecessarily and then making a powers-of-ten mistake.
Things to Be Careful About
- Ensure you use consistent length units for and (both in cm here, so they cancel correctly).
- Quote with unit (or ).
Working
Answer
2.0 s
Background Concept
For periodic motion, angular frequency and period are related by:
so
This comes from one complete cycle corresponding to an angular phase change of radians.
Understanding the Question
You have already found . The question asks for the period , the time for one full oscillation.
Approach
Use the direct conversion formula and substitute the given value.
Step-by-Step Reasoning
- Start with
- Substitute :
- Round appropriately (typically to 2 s.f. matching the input data):
Key Takeaways
- and are reciprocally related: larger means smaller .
- Always include units of seconds for the period.
Common Mistakes
- Using (inverted).
- Forgetting the factor of and using .
Things to Be Careful About
- Keep in the calculation until the end to reduce rounding error.
- Round the final value sensibly; do not give excessive significant figures unless justified.
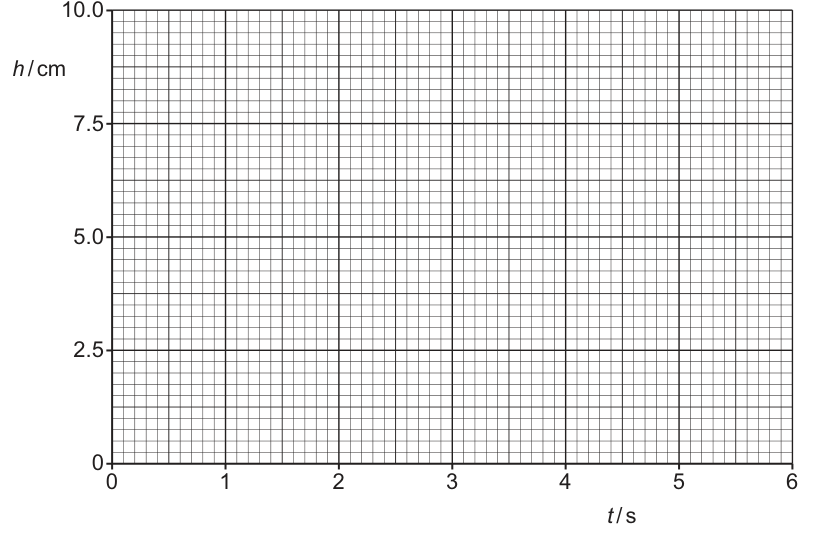
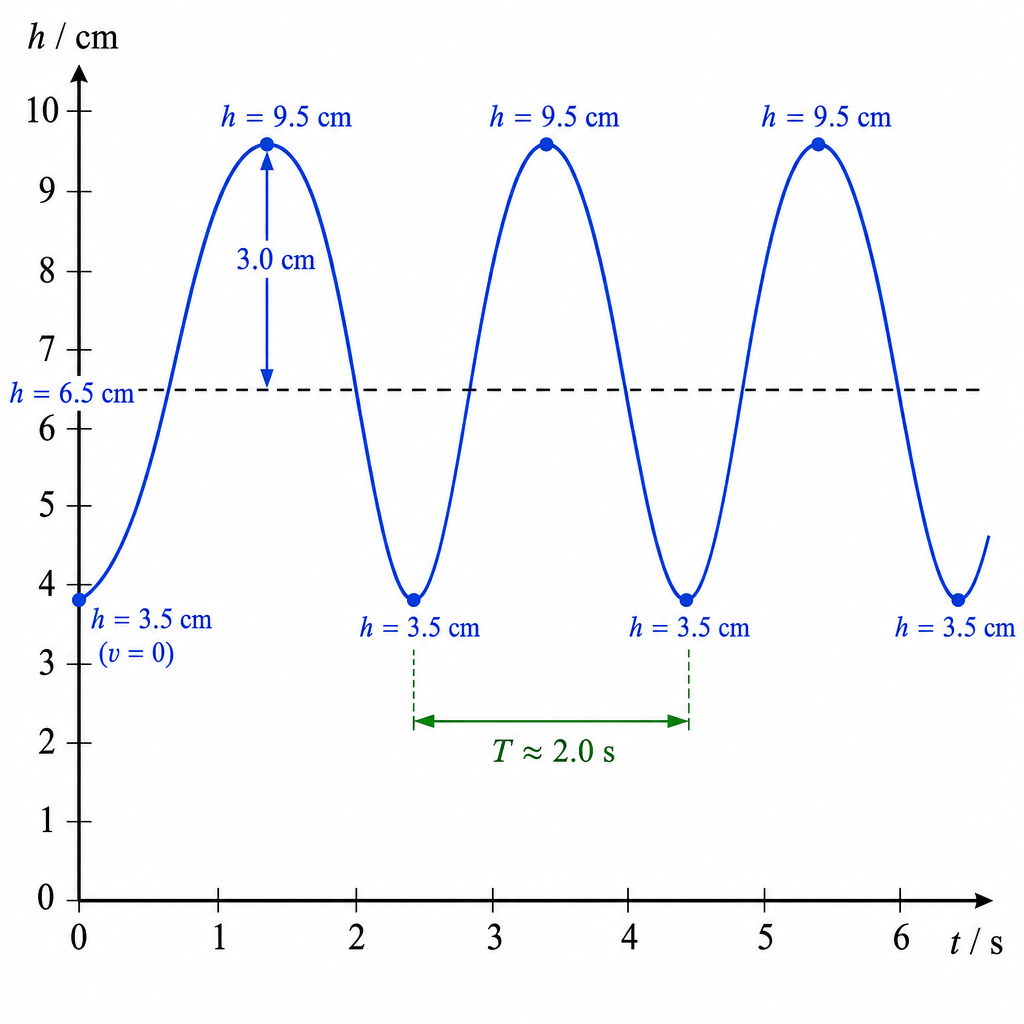
Answer
Sketch a sinusoidal graph of against with:
- midline at ,
- amplitude (so and ),
- period ,
- at , (released from lowest point) with zero gradient, then rising.
(So maxima at and minima at .)
Sinusoidal h–t graph about 6.5 cm with amplitude 3.0 cm, period ≈ 2.0 s, starting at h = 3.5 cm at t = 0 and rising.
Background Concept
For SHM, displacement (or here height) varies sinusoidally with time. If we measure displacement from equilibrium as , then a standard form is:
The constants mean:
- is amplitude,
- sets the period ,
- sets the phase (where in the cycle you start).
At a turning point (top or bottom), the velocity is zero, so the – graph has zero gradient there.
Understanding the Question
You must sketch against from to .
From the given description and the – graph:
- equilibrium (centre) height is ,
- amplitude is , so ranges from to ,
- period is about ,
- at the block is pulled down and released, so it starts at the lowest height with .
Approach
To sketch correctly, you need four features:
- correct midline (),
- correct amplitude (reach and ),
- correct period spacing (about per full cycle),
- correct phase: start at minimum at and then rise.
Step-by-Step Reasoning
- Set the midline
- From the extreme heights and , the equilibrium is
Draw a faint central line at .
- Set the amplitude
- Amplitude , so the curve must touch and .
- Set the period
- Using with gives .
- So from to you should draw about three full cycles.
- Set the starting point and direction
- “Pulled down and released at ” means:
- start at the bottom turning point: ,
- released from rest so initial gradient is zero,
- then it moves upward, so immediately after the curve rises.
- Mark key times (helps accuracy of the sketch)
- Quarter-period steps are useful:
- at : passes equilibrium () with maximum positive slope,
- at : reaches maximum ,
- at : crosses equilibrium downward,
- at : back to minimum.
Repeat this pattern up to .
Key Takeaways
- SHM position-time graphs are sinusoidal.
- The centre line is the equilibrium value; amplitude is measured from that line.
- The wording at sets the phase (minimum/maximum/crossing equilibrium).
Common Mistakes
- Starting at the equilibrium position at even though the block is released from a pulled-down position.
- Drawing a triangle wave or non-sinusoidal curve.
- Using the wrong midline (e.g. centring at instead of ).
- Incorrect period spacing (too few or too many cycles in 6 s).
Things to Be Careful About
- Turning points must have zero gradient.
- Ensure the maximum and minimum heights match the graph values ( and ).
- A sketch should use the graph grid sensibly: clear sinusoid, consistent period, consistent amplitude.
Answer
Electric field strength is the negative potential gradient:
(along a line)
(so along a line )
Background Concept
Electric potential at a point is the potential energy per unit charge. The electric field strength describes the force per unit positive charge. These are linked because a charge moving a small distance in an electric field changes its potential energy.
The electric field points in the direction of decreasing potential, so the field is related to the negative spatial rate of change (gradient) of potential.
Understanding the Question
You are asked to state the mathematical relationship between electric field and electric potential (no numbers, just the defining equation).
Approach
Recall that is the negative gradient of . If only one dimension is involved (e.g. along ), replace the gradient with a derivative with respect to distance.
Step-by-Step Reasoning
In vector form:
Along a straight line coordinate :
The minus sign encodes that decreases in the direction of .
Key Takeaways
- is a vector; is a scalar.
- The field direction is the direction of steepest decrease of potential.
Common Mistakes
- Writing (wrong sign).
- Confusing (only for a uniform field between parallel plates) with the general relationship.
Things to Be Careful About
- Use a derivative/gradient (rate of change with position), not a simple ratio unless the field is uniform.
- Include the negative sign.
Two charged isolated insulating spheres X and Y are near to each other, as shown in Fig. 5.1.

is a point on the line joining the centres of the spheres.
Explain why it is not possible for the total electric potential and the resultant electric field to simultaneously be zero at point .
Answer
For , the potentials from the two spheres must be equal and opposite, so the charges must be of opposite sign.
At a point between opposite charges, the electric fields due to each charge are in the same direction (from to ), so they add and cannot give zero resultant field.
Therefore and cannot both occur at .
To have the charges must be opposite signs, but then the fields at a point between them are in the same direction and cannot cancel, so cannot be zero.
Background Concept
For point charges (or charged spheres treated as point charges), the electric potential at a point is
Potential is a scalar, so total potential is the algebraic sum:
Electric field strength is a vector:
and fields add by vector addition:
Direction rule: field points away from a positive charge and towards a negative charge.
Understanding the Question
Two charged insulating spheres are near each other, and lies on the line between their centres. You must explain (using physics reasoning, not calculations) why it is impossible for both:
- the total potential at to be zero, and
- the resultant electric field at to be zero,
at the same time.
Approach
Consider what charge signs are required for , then examine what that implies for the directions of the two electric fields at a point between the spheres. Use the fact that potentials add as scalars but fields add as vectors.
Step-by-Step Reasoning
- For with two charges, we need
So one contribution must be positive and the other negative. That requires opposite signs of charge (one sphere positive, the other negative).
- Now look at the electric field directions at a point between opposite charges.
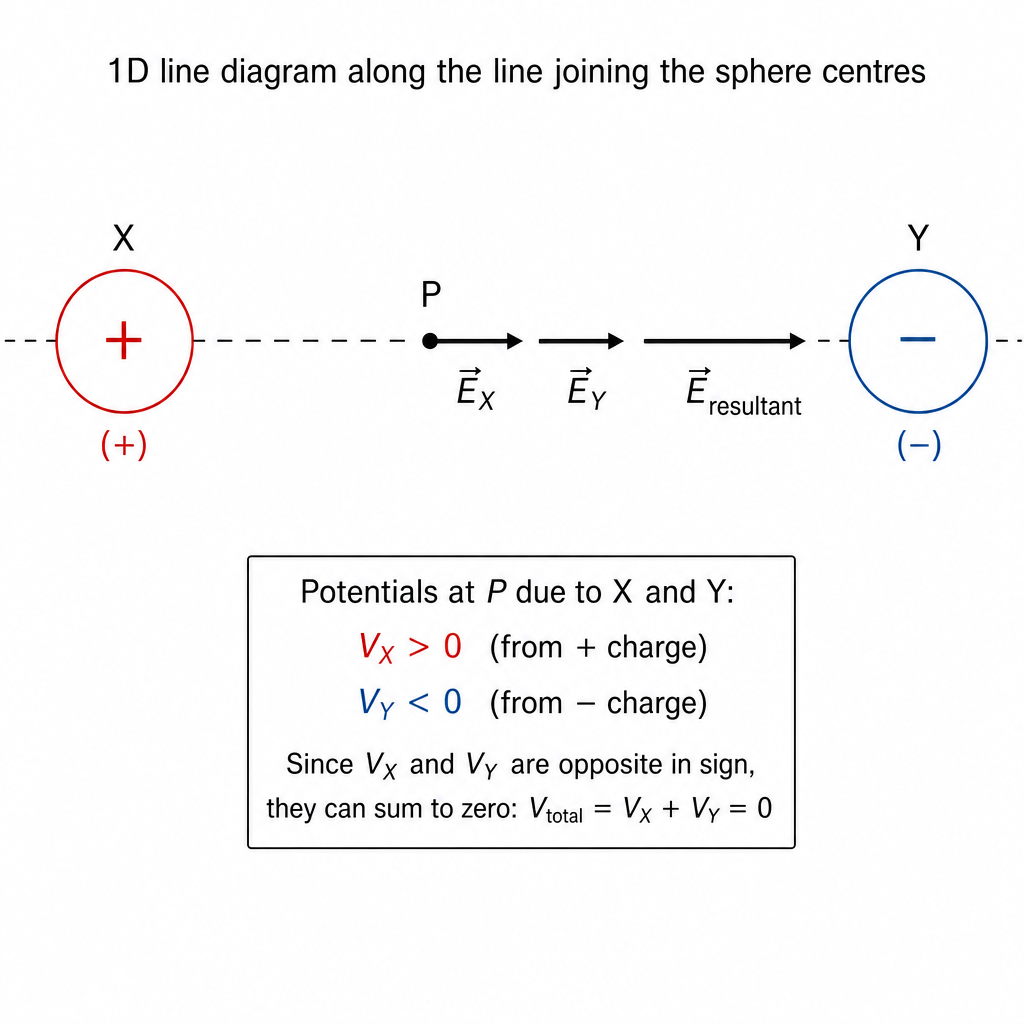
At point :
- the field due to the positive charge points away from it (towards the other sphere),
- the field due to the negative charge points towards it (also towards the other sphere),
so both fields point in the same direction along the line.
- Since the two field vectors at point the same way, they cannot cancel to give zero resultant field. They add to a non-zero resultant.
Therefore it is not possible for and simultaneously at .
(Conversely, if you tried to make between two charges, you would need like charges so the fields oppose there, but then both potentials would have the same sign and could not sum to zero.)
Key Takeaways
- Electric potential is a scalar: add with signs.
- Electric field is a vector: direction matters.
- Between opposite charges, fields point in the same direction, so they cannot cancel.
Common Mistakes
- Thinking that if potentials cancel then fields must cancel (they are related but not the same quantity).
- Forgetting field direction (away from , towards ).
Things to Be Careful About
- The statement depends on being on the line between the charges; that fixes the field directions.
- “Zero potential” is relative to infinity; it can occur by cancellation of positive and negative contributions, not by each being zero.
The magnitudes of the charges on spheres X and Y in Fig. 5.1 are and respectively.
The spheres may be considered as point charges at their centres.
Point is a distance from the centre of sphere X.
The electric potential at point is zero.
Working
For , the charges must be opposite in sign, so
Answer
Background Concept
The electric potential due to a point charge is
Potential is a scalar, so for multiple charges you add the potentials (including sign of charge):
A positive charge gives positive potential; a negative charge gives negative potential.
Understanding the Question
Sphere X has charge magnitude and sphere Y has charge magnitude . Point lies on the line between them, at distance from X and distance from Y. You are told that the electric potential at is zero, and you must show that this implies .
Approach
Write using . For the sum to be zero with non-zero charges, one term must be positive and the other negative, so take the charges to be opposite sign (e.g. and ). Then solve the resulting equation for in terms of .
Step-by-Step Reasoning
Let X be and Y be (the opposite assignment gives the same distance result).
Potential at :
Given :
The constant factor is non-zero, so the bracket must be zero:
Cancel :
Rearrange:
Key Takeaways
- To get zero total potential from two charges, they must be opposite sign.
- Potential varies as , so the larger-magnitude charge must be further away to cancel.
Common Mistakes
- Adding magnitudes instead of signed potentials (you must include a minus sign for a negative charge).
- Using (that is for field, not potential).
Things to Be Careful About
- The relationship uses distances from the charge centres because the spheres are treated as point charges.
- Either sign assignment gives the same distance ratio; what matters is opposite sign for cancellation.
State an expression, in terms of , and the permittivity of free space , for the electric field strength at due to sphere X.
= ______
Answer
Background Concept
The electric field strength due to a point charge at distance is
Direction: away from a positive charge and towards a negative charge.
Understanding the Question
At point , the distance from sphere X is . You are asked for an expression for the electric field strength at due to X only, in terms of , , and .
Approach
Use the point-charge field formula with .
Step-by-Step Reasoning
Distance from X to P is , and charge magnitude on X is , so
(If direction were needed, it would be along the line XP, away from X if X is positive and towards X if X is negative.)
Key Takeaways
- Field varies as .
- Use because is the separation from X to P.
Common Mistakes
- Using (that is for potential).
- Forgetting the constant factor .
Things to Be Careful About
- The question asks for field strength (magnitude), so sign is not included unless direction is explicitly requested.
Determine an expression, in terms of , and , for the resultant electric field strength at point due to the two spheres.
= ______
Working
From (i), .
Field magnitudes at :
The charges are opposite sign, so at the fields are in the same direction and add:
Substitute :
Answer
(direction towards the negative sphere)
Background Concept
For a point charge, electric field magnitude is
Electric field is a vector. On a straight line, you can add fields algebraically provided you choose a direction as positive and assign signs based on direction.
Also, if the total potential at is zero for two non-zero charges, the charges must be of opposite sign. Between opposite charges, both field contributions at a point between them point from the positive charge towards the negative charge.
Understanding the Question
You already have that the potential at is zero and from part (i) this gives . Now you must find an expression for the resultant electric field strength at due to both spheres (treated as point charges).
Approach
- Write the field at due to X and due to Y using the inverse-square law.
- Decide whether they add or subtract by considering charge signs/directions.
- Use to eliminate and simplify to a single expression in , , .
Step-by-Step Reasoning
- Field due to X at distance :
- Field due to Y at distance with charge magnitude :
- Direction check:
- Since , the charges must be opposite sign.
- At a point between opposite charges, both fields point in the same direction (towards the negative charge), so the resultant magnitude is the sum:
- Substitute :
Compute :
Add the fractions:
So:
Direction: along the line from the positive sphere to the negative sphere.
Key Takeaways
- Zero potential implies opposite charge signs.
- Between opposite charges, fields reinforce (same direction), even though potentials can cancel.
- Use for field and for potential.
Common Mistakes
- Subtracting fields here (they would subtract between like charges, not unlike charges).
- Using but then forgetting to square it when substituting into .
- Mixing up with .
Things to Be Careful About
- The expression requested is for field strength at ; if the exam expects a direction statement, include it (towards the negative sphere).
- Keep algebra tidy: , not .
Answer
Rectification is the process of converting an alternating voltage (or current) into a unidirectional (d.c.) output.
Conversion of an a.c. voltage/current to a unidirectional (d.c.) output.
Background Concept
An alternating (a.c.) voltage repeatedly changes polarity, so the current in a resistive load reverses direction every half-cycle. A direct (d.c.) voltage maintains one polarity, so the current through a resistive load flows in one direction only.
Rectification uses components such as diodes that conduct preferentially in one direction, so that the output across a load does not reverse polarity.
Understanding the Question
You are asked for the meaning of “rectification of an alternating voltage”. So you must state what change happens to the a.c. signal when it is rectified.
Approach
Give a definition in terms of the output being unidirectional (single polarity) rather than alternating.
Step-by-Step Reasoning
- Start with what a.c. means: the voltage changes sign.
- Rectification is the process that prevents the output from changing sign.
- Therefore the result is a voltage of one polarity (a d.c. output, often pulsating d.c.).
Key Takeaways
- Rectification: a.c. (\rightarrow) unidirectional (d.c.) output.
- A rectified output may still vary with time, but it does not reverse polarity.
Common Mistakes
- Saying “rectification increases voltage” (it does not necessarily).
- Saying “changes a.c. to constant voltage” (rectified output can be pulsating).
Things to Be Careful About
- Use the key phrase “unidirectional” or “one polarity only”; that is what gains the mark.
Answer
- Half-wave rectification: only one half-cycle of the input produces an output; the other half-cycle is blocked ((V_{\text{out}} \approx 0)).
- Full-wave rectification: both half-cycles produce an output of the same polarity (so pulses occur every half-cycle; output frequency is doubled).
Half-wave uses only one half-cycle; full-wave uses both half-cycles to give output of one polarity (pulses every half-cycle, frequency doubled).
Background Concept
A diode conducts when forward biased and blocks current when reverse biased. Rectifier circuits use this to ensure the load voltage does not reverse polarity.
- In half-wave rectification, the circuit allows current through the load for only one polarity of the input (one half-cycle).
- In full-wave rectification, the circuit arranges that whichever polarity the input has, current through the load is in the same direction (both half-cycles are used).
Understanding the Question
You must state the difference between half-wave and full-wave rectification. For 2 marks, you should give two contrasting points (e.g. “one half-cycle vs both half-cycles” and “pulse frequency is the same vs doubled / smoother output”).
Approach
Describe what happens to the output during the positive and negative half-cycles for each type.
Step-by-Step Reasoning
- Half-wave: during (say) the positive half-cycle the diode is forward biased so the load gets a pulse; during the negative half-cycle the diode is reverse biased so the load gets almost no voltage.
- Full-wave: the circuit (e.g. bridge rectifier) effectively swaps connections on alternate half-cycles so the load always has the same polarity across it.
- Since full-wave produces a pulse every half-cycle, the ripple has double the frequency compared to half-wave, making smoothing easier.
Key Takeaways
- Half-wave: uses one half-cycle only.
- Full-wave: uses both half-cycles and gives higher ripple frequency and typically smoother output.
Common Mistakes
- Mixing up “full-wave” with “higher voltage”: the key point is both half-cycles contribute.
- Forgetting to state that the output polarity is the same for both half-cycles in full-wave.
Things to Be Careful About
- Use the word “half-cycle” and mention polarity/direction through the load; vague statements like “full-wave is better” are not creditworthy.
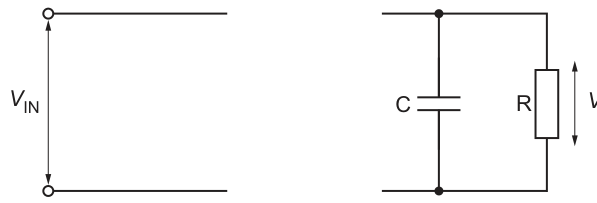
Complete Fig. 6.1 to show a circuit that produces half-wave rectification of an alternating input voltage to produce output voltage across the resistor .
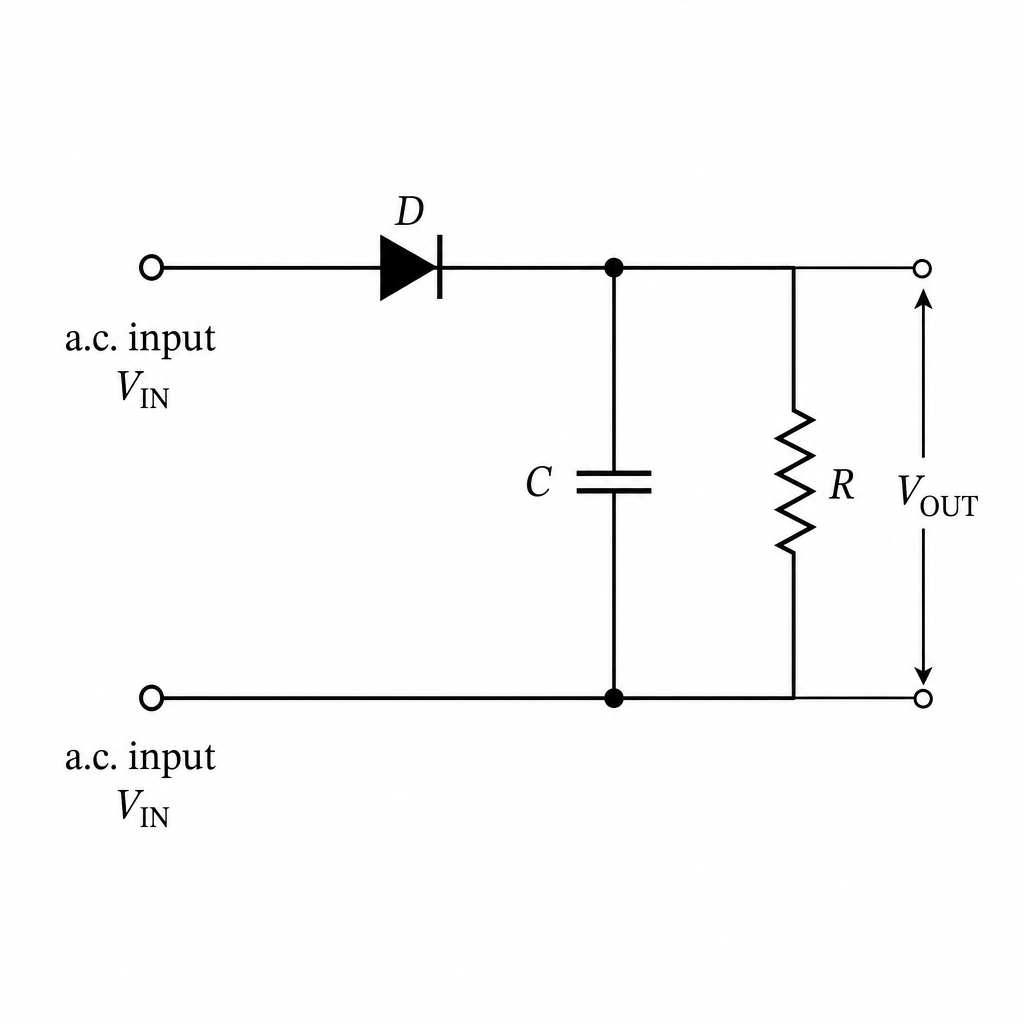
Answer
Place a diode in series between the top input terminal and the top rail of the (R\parallel C) combination, oriented to conduct when the top input is positive (anode to input, cathode to the (R/C) node). Connect the bottom input terminal directly to the bottom rail.
Single series diode between input and R/C node (anode to input, cathode to output node); return directly to the other input terminal.
Background Concept
A half-wave rectifier uses a single diode so that current can flow through the load for one input polarity only.
A smoothing capacitor is usually placed across the load (in parallel) so it can charge when the diode conducts and then discharge through the load when the diode is off.
Understanding the Question
You are given an incomplete circuit: an a.c. input (V_{IN}) on the left and, on the right, a resistor (R) with capacitor (C) in parallel, with (V_{OUT}) measured across (R).
To get half-wave rectification, you must add a single diode in the correct place and orientation so that only one half-cycle charges the capacitor and provides output across (R).
Approach
- Put the diode in series between the source and the load node.
- Choose its orientation so that it is forward biased on the half-cycle you want to pass (typically when the top input terminal is positive relative to the bottom).
Step-by-Step Reasoning
- The top of the (R\parallel C) network is the output “positive” node, and the bottom is the return.
- Put the diode in the top lead from the input to this output node.
- Orient the diode so that when (V_{IN}) is positive, the diode is forward biased and current flows into the (R\parallel C) network, charging (C) and producing (V_{OUT}).
- When (V_{IN}) becomes negative, the diode is reverse biased so the input is effectively disconnected; the capacitor then discharges only through (R), maintaining a positive (V_{OUT}) for a short time.
Key Takeaways
- Half-wave rectification can be achieved with one diode in series.
- The diode orientation determines which half-cycle appears at the output.
- The capacitor must be in parallel with the load to smooth the output.
Common Mistakes
- Putting the diode across the load (would not rectify the supply to the load correctly).
- Reversing the diode so that the output is negative pulses instead of positive (may be marked wrong if inconsistent with (V_{OUT}) definition).
- Putting the capacitor in series with the load (prevents correct smoothing behaviour).
Things to Be Careful About
- The output (V_{OUT}) is measured across (R), so the diode must be placed so that the voltage across (R) becomes unidirectional.
- In diagrams, show the diode symbol with a clear bar (cathode) so the direction of conduction is unambiguous.
Answer
The capacitor stores charge and smooths the rectified output by discharging through (R) when the diode is not conducting, reducing ripple in (V_{OUT}).
To smooth the output (reduce ripple) by storing charge and discharging through R between input pulses.
Background Concept
After rectification, the output is typically a series of pulses. A capacitor across the load can be charged up to (approximately) the peak voltage when the diode conducts. When the diode stops conducting, the capacitor discharges through the load resistor, keeping the load voltage from dropping immediately to zero.
This produces a smoother (less “rippled”) d.c. output.
Understanding the Question
You are asked what the capacitor (C) does in the rectifier circuit of Fig. 6.1. The key word is “purpose”, so one clear statement is enough.
Approach
Mention charge storage and discharge through (R) to maintain (V_{OUT}) between conduction intervals.
Step-by-Step Reasoning
- During the conducting half-cycle, the diode is forward biased and the capacitor charges to a high voltage.
- During the non-conducting half-cycle, the diode is reverse biased so the capacitor cannot discharge back into the source.
- The capacitor therefore discharges through (R), supplying current to the load and keeping (V_{OUT}) from falling too much.
Key Takeaways
- Capacitor across the load: charges quickly, discharges slowly (\rightarrow) smoothing.
Common Mistakes
- Saying “it increases the voltage”: the capacitor does not increase the peak beyond the supply peak.
- Saying “it makes the output a.c.”: it makes the rectified output closer to steady d.c.
Things to Be Careful About
- The capacitor is effective only if its discharge time constant (RC) is not too small compared with the time between charging pulses.
The input voltage in Fig. 6.1 is a square wave. Fig. 6.2 shows the variation of with time .
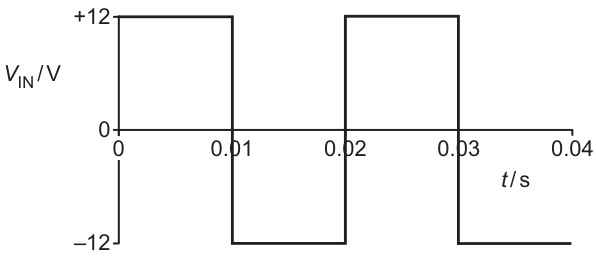
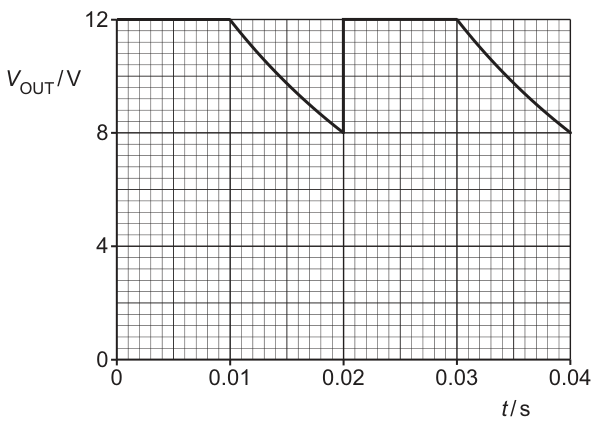
Fig. 6.3 shows the variation of with .
The maximum energy stored in the capacitor is .
Working
Maximum capacitor voltage (V = 12\ \text{V}).
Answer
(C \approx 570\ \mu\text{F}).
570 \muF
Background Concept
A capacitor stores electrical energy in its electric field. The energy stored when the potential difference across it is (V) is
where:
- (W) is energy in joules (J),
- (C) is capacitance in farads (F),
- (V) is potential difference in volts (V).
In a smoothing circuit, the capacitor charges up to approximately the peak of the rectified input, so the maximum energy corresponds to the maximum capacitor voltage.
Understanding the Question
From the graphs:
- (V_{IN}) is a square wave between (+12\ \text{V}) and (-12\ \text{V}), period (0.02\ \text{s}).
- (V_{OUT}) is held at (12\ \text{V}) during the conducting interval.
You are told the maximum energy stored in the capacitor is (0.041\ \text{J}). You must show that this implies (C \approx 570\ \mu\text{F}).
Approach
- Take the maximum capacitor voltage from the output waveform: (V_{\max} = 12\ \text{V}).
- Rearrange (W = \tfrac{1}{2}CV^2) to find (C).
- Convert farads to microfarads using (1\ \mu\text{F} = 10^{-6}\ \text{F}).
Step-by-Step Reasoning
- Identify (V_{\max}): the capacitor is across the output, and the output reaches (12\ \text{V}), so (V_{\max} = 12\ \text{V}).
- Rearrange:
- Substitute (W = 0.041\ \text{J}), (V = 12\ \text{V}):
- Convert to (\mu\text{F}):
Key Takeaways
- Use (W = \tfrac{1}{2}CV^2) for capacitor energy.
- Maximum stored energy corresponds to maximum voltage across the capacitor.
- Be fluent with (\mu\text{F}\leftrightarrow\text{F}) conversions.
Common Mistakes
- Using (V = 24\ \text{V}) (peak-to-peak) instead of the maximum capacitor voltage (12\ \text{V}).
- Forgetting the (\tfrac{1}{2}) in the energy formula.
- Incorrect conversion to microfarads (missing factor (10^6)).
Things to Be Careful About
- (V) in (\tfrac{1}{2}CV^2) is the capacitor p.d., not the input peak-to-peak value.
- Keep units consistent: joules, volts, farads.
Working
During discharge (from (t = 0.01\ \text{s}) to (0.02\ \text{s})), (V) falls from (12\ \text{V}) to (8\ \text{V}) in (\Delta t = 0.010\ \text{s}).
Using (C = 570\ \mu\text{F} = 5.70 \times 10^{-4}\ \text{F}),
Answer
(R \approx 43\ \Omega).
43 \Omega
Background Concept
When a capacitor discharges through a resistor (with no external supply connected), the voltage across the capacitor decays exponentially:
where:
- (V_0) is the initial capacitor voltage at the start of the discharge,
- (t) is time since discharge began,
- (RC) is the time constant (\tau).
In a rectifier with smoothing capacitor, the capacitor charges rapidly when the diode conducts and discharges through the load resistor when the diode is reverse biased, causing the output to fall between charging intervals.
Understanding the Question
From the output graph (V_{OUT}):
- It remains at (12\ \text{V}) up to (t = 0.01\ \text{s}).
- Then it drops to (8\ \text{V}) by (t = 0.02\ \text{s}).
So, during the non-conducting half-cycle, the capacitor discharges for (0.010\ \text{s}), and the voltage falls from (12\ \text{V}) to (8\ \text{V}).
You have already found (C = 570\ \mu\text{F}), and you must determine (R).
Approach
- Treat the interval where (V_{OUT}) falls as a capacitor discharge through (R).
- Use (V = V_0 e^{-t/RC}) with (V_0 = 12\ \text{V}), (V = 8\ \text{V}), (t = 0.010\ \text{s}).
- Solve for (RC), then divide by (C) to get (R).
Step-by-Step Reasoning
-
Identify the discharge time:
- Discharge starts when the diode stops conducting: at (t = 0.01\ \text{s}).
- Next charging begins at (t = 0.02\ \text{s}).
- So (t = 0.02 - 0.01 = 0.010\ \text{s}).
-
Identify (V_0) and (V):
- (V_0 = 12\ \text{V}) at the start of discharge.
- (V = 8\ \text{V}) after (0.010\ \text{s}).
-
Apply exponential decay:
so
- Take natural logarithms:
and since (\ln(2/3) = -\ln(3/2)),
- Use (R = (RC)/C) with (C = 570\ \mu\text{F} = 5.70 \times 10^{-4}\ \text{F}):
Note: although the graph shows a straight-line fall, in a real RC discharge the curve is exponential; exam questions typically still expect the exponential discharge equation.
Key Takeaways
- Use (V = V_0 e^{-t/RC}) for capacitor discharge.
- The time constant is (\tau = RC).
- Read (t), (V_0), and (V) carefully from the waveform.
Common Mistakes
- Using the full period (0.02\ \text{s}) as the discharge time instead of the discharge interval (0.01\ \text{s}).
- Swapping the ratio (V/V_0) (e.g. using (12/8)) leading to a negative time constant.
- Forgetting to convert (570\ \mu\text{F}) to farads.
Things to Be Careful About
- (t) in the exponential formula is time since discharge began, not absolute clock time.
- Always keep (RC) in seconds: (\ln) is dimensionless, so the numerator must be in seconds.
- Quote (R) to a sensible number of significant figures consistent with the data (typically 2–3 s.f.).
Answer
Magnetic flux density is the force per unit current per unit length on a straight conductor placed at right angles to the field:
Magnetic flux density is the force per unit current per unit length on a conductor at right angles to the field (B = F/IL).
Background Concept
Magnetic flux density describes the “strength” of a magnetic field in terms of the force it can exert on moving charges, or equivalently on a current in a wire.
For a straight wire of length carrying current in a uniform magnetic field, the magnetic force is
where is the angle between the wire (direction of conventional current) and the magnetic field direction.
Understanding the Question
You are asked for a definition of magnetic flux density. In Cambridge mark schemes this is usually the operational definition based on the force on a current-carrying conductor. For full credit you must include:
- force per unit current,
- per unit length,
- when the conductor is perpendicular to the field.
Approach
Start from the standard force equation on a current-carrying conductor. Set so , then rearrange to express as a ratio involving , and . State this in words.
Step-by-Step Reasoning
- Use
- For the definition, the conductor is at right angles to the field: , so .
- Rearrange:
- Put into words: is the force per unit current per unit length on a conductor at to the field.
Key Takeaways
- Magnetic flux density can be defined via a measurable force on a current.
- The perpendicular condition matters because of the factor.
Common Mistakes
- Missing “per unit length” (writing ).
- Forgetting the perpendicular condition (the definition uses maximum force).
- Confusing with magnetic flux .
Things to Be Careful About
- The definition is tied to ; otherwise , which is not the standard definition statement.
- Use conventional current direction when relating to force rules (e.g. Fleming’s left-hand rule).
A long, straight wire carries a current into the page, as shown in Fig. 7.1.

On Fig. 7.1, draw four field lines to represent the magnetic field around the wire due to the current in it.
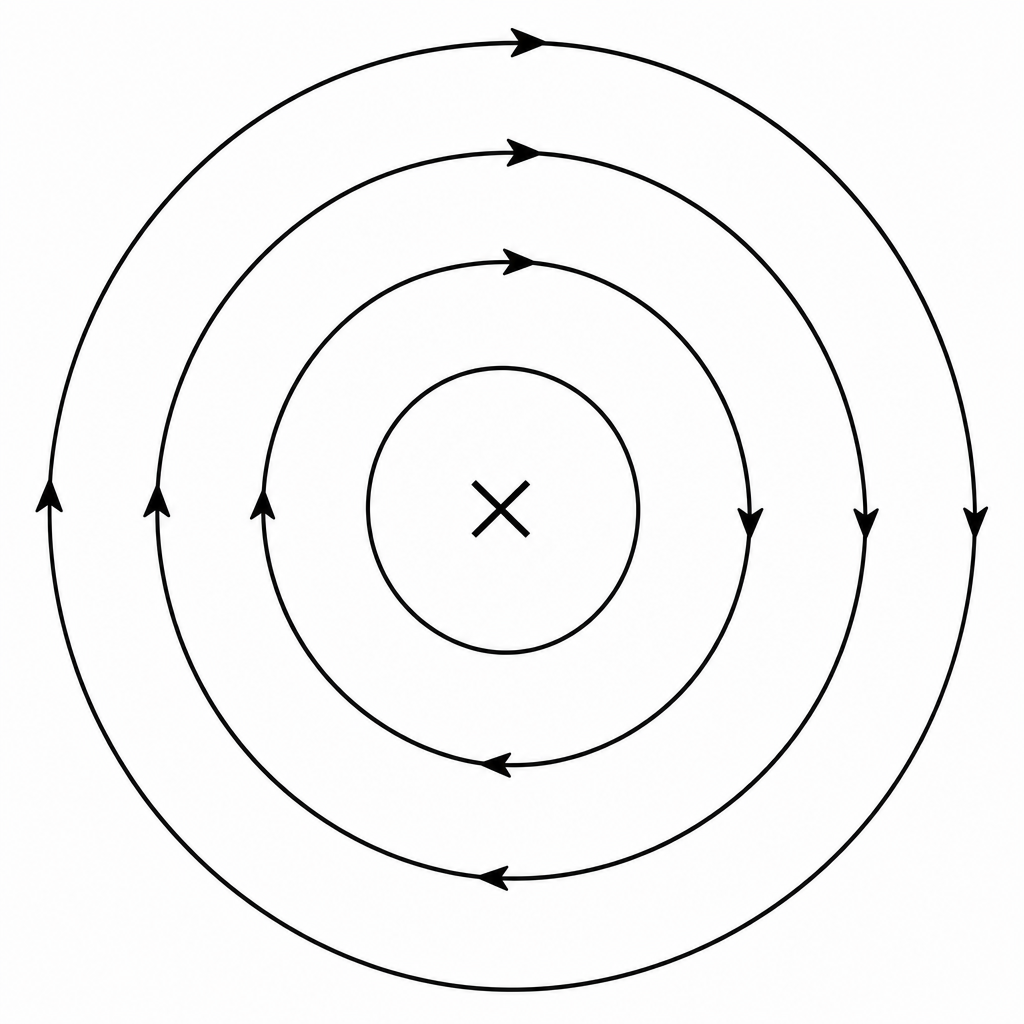
See diagram
Background Concept
A long straight current produces a magnetic field with field lines that are concentric circles centered on the wire.
The direction is given by the right-hand grip rule:
- Thumb points in the direction of conventional current.
- Curled fingers show the direction of the magnetic field lines.
For a current into the page (often shown as a cross ), the field is clockwise.
Understanding the Question
You are given a cross symbol representing a wire carrying current into the page. You must draw four magnetic field lines around it. The key marking points are typically:
- field lines are circles centered on the wire,
- arrows show direction,
- correct sense (clockwise for current into page).
Approach
Sketch several concentric circles around the wire. Put arrowheads on each circle. Use the right-hand grip rule to decide clockwise vs anticlockwise.
Step-by-Step Reasoning
- Recognise: straight current-carrying wire circular magnetic field lines.
- Determine direction: current into page thumb into page.
- Your curled fingers go clockwise, so draw arrows clockwise.
- Draw four circles (any reasonable radii) centered on the wire symbol.
Key Takeaways
- Straight wire fields are circular.
- Cross () means into the page, giving clockwise field lines.
Common Mistakes
- Drawing radial lines instead of circles.
- Correct circles but missing arrowheads.
- Getting direction wrong (anticlockwise instead of clockwise).
Things to Be Careful About
- Make the circles centered on the wire.
- Arrowheads must be consistent on all field lines (not mixed directions).
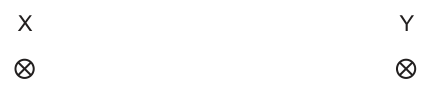
Two identical wires X and Y are placed parallel to each other. The wires both carry current into the page, as shown in Fig. 7.2.
Answer
Each wire produces a magnetic field around it.
Wire X lies in the magnetic field produced by wire Y (and vice versa), so a current-carrying wire in a magnetic field experiences a force (e.g. ). Hence the wires exert forces on each other.
Each wire produces a magnetic field; the other wire’s current in this field experiences a force, so the wires exert forces on each other.
Background Concept
A current in a wire creates a magnetic field around the wire. If another current-carrying conductor is placed in this magnetic field, it experiences a force.
The magnitude for a straight conductor in a magnetic field is
where is the angle between current direction and the magnetic field.
In the special case of two long parallel wires, each wire is inside the magnetic field produced by the other, so forces arise on both wires.
Understanding the Question
Two parallel wires X and Y both carry current into the page. You must explain why there is a magnetic force between them (not necessarily calculate it). The essential points are:
- a current produces a magnetic field,
- a current in an external magnetic field experiences a force,
- so each wire is forced by the field of the other.
Approach
Use a cause-and-effect chain: current magnetic field; other wire is in that field; magnetic field acting on a current force.
Step-by-Step Reasoning
- Current in wire Y produces a magnetic field around Y.
- Wire X is close by, so it is within that magnetic field.
- Since X carries current, it experiences a force due to the magnetic field from Y.
- Similarly, current in X produces a magnetic field that exerts a force on wire Y.
- Therefore, the two wires exert magnetic forces on each other.
Key Takeaways
- Magnetic forces between wires come from “field of one acting on current in the other”.
Common Mistakes
- Saying “they attract because of magnetism” with no mechanism.
- Mentioning electric forces instead of magnetic forces.
Things to Be Careful About
- You do not need a calculation; just the correct physical reason.
- Make clear it’s the other wire’s magnetic field that causes the force.
On Fig. 7.2, draw an arrow to show the direction of the magnetic force exerted on wire X. Label your arrow .
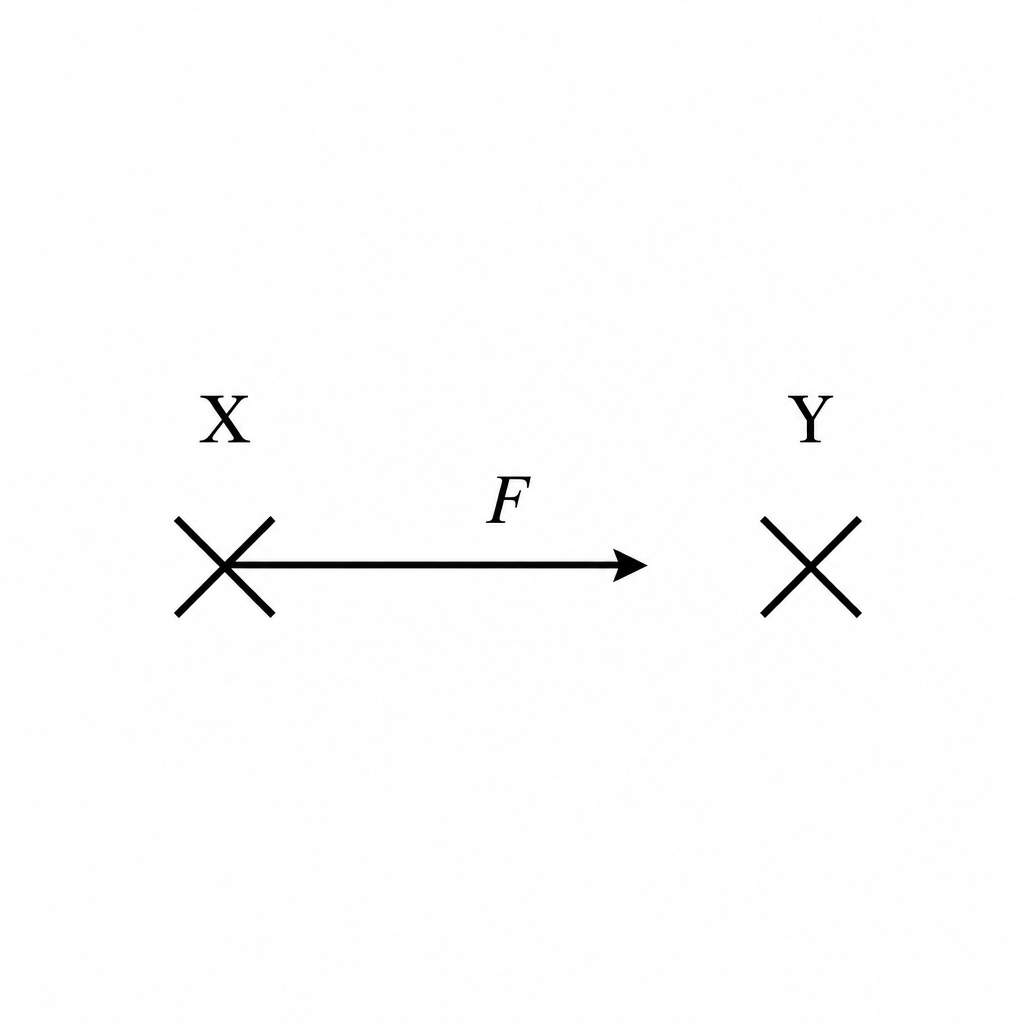
Force on X is towards wire Y.
Background Concept
For two long parallel current-carrying wires:
- currents in the same direction produce an attractive force,
- currents in opposite directions produce a repulsive force.
This comes from combining (1) the circular magnetic field around one wire and (2) the force on the other wire’s current.
Understanding the Question
Both wires X and Y have current into the page (same direction). You must show the direction of the force on X.
Approach
Use the memorised result “same direction attract”. Then the force on X must point toward Y.
Step-by-Step Reasoning
- Identify current directions: both into the page same direction.
- Therefore the wires attract.
- So wire X is pulled toward wire Y.
Key Takeaways
- Same-direction parallel currents attract.
Common Mistakes
- Drawing the force away from Y (confusing attraction/repulsion rule).
- Drawing the force vertically rather than along the line joining the wires.
Things to Be Careful About
- The arrow should start at wire X and point directly toward wire Y.
- Remember the arrow must be labelled as requested.
The current in X is double the current in Y.
State how the magnetic force exerted on wire Y compares with the magnetic force exerted on wire X.
Answer
The force on wire Y is equal in magnitude to the force on wire X (and opposite in direction).
Same magnitude as on X (opposite direction).
Background Concept
When two objects interact, the forces they exert on each other are an action–reaction pair:
- equal magnitude,
- opposite direction,
- acting on different bodies.
For two long parallel wires, the magnitude per unit length is
which is symmetric in and , so each wire experiences the same magnitude force.
Understanding the Question
You are told . You are asked how the force on Y compares with the force on X.
Even though the currents differ, the interaction is mutual: the force of X on Y equals the force of Y on X in magnitude.
Approach
Use Newton’s third law (or the symmetry of the force formula) to compare forces.
Step-by-Step Reasoning
- Wire X produces a magnetic field that acts on current in wire Y, producing a force on Y.
- Wire Y produces a magnetic field that acts on current in wire X, producing a force on X.
- These are forces of interaction between the same two bodies, so by Newton’s third law:
- .
- Therefore, force on Y has the same magnitude as force on X, but acts in the opposite direction.
Key Takeaways
- Forces between the two wires are always equal and opposite as an interaction pair.
- Different currents do not break Newton’s third law.
Common Mistakes
- Saying the force on X is double because is double (missing that the product applies to both, and that forces are equal and opposite).
- Claiming both forces act in the same direction.
Things to Be Careful About
- The question asks a comparison (not a calculation), so a clear statement about magnitude (and ideally direction) is enough.
- If you mention direction: they are opposite because they act on different wires.
The direction of the current in both wires is now reversed.
State, with a reason, the effect of this change on the direction of the force on wire X.
Answer
No change: the force on X is still towards Y because the currents are still in the same direction (so the wires still attract).
Unchanged; still towards Y because currents remain in the same direction so attraction remains.
Background Concept
The direction of force between parallel wires depends on whether the currents are in the same or opposite directions:
- same direction attraction,
- opposite directions repulsion.
Understanding the Question
Initially both currents are into the page, so they are in the same direction and the wires attract.
Then both currents are reversed. The key is that both reverse, so they remain in the same direction relative to each other.
Approach
Decide whether the currents are still “same direction” or become “opposite direction” after the change. Use the attraction/repulsion rule to infer the force direction.
Step-by-Step Reasoning
- Before reversal: both into the page same direction attraction force on X toward Y.
- After reversal: both out of the page still same direction (just the opposite of before).
- Same direction still gives attraction, so X is still pulled toward Y.
- Therefore the direction of the force on X is unchanged.
Key Takeaways
- Reversing both currents does not change “same vs opposite” comparison, so it does not change the attraction/repulsion outcome.
Common Mistakes
- Thinking the force must reverse whenever current reverses (it would reverse only if one wire reversed relative to the other).
Things to Be Careful About
- The important comparison is between the two currents, not their absolute direction into/out of the page.
A polished sheet of magnesium in a vacuum emits electrons when it is illuminated by ultraviolet radiation.
Answer
Photoelectric effect.
Photoelectric effect.
Background Concept
The photoelectric effect is the emission of electrons from a metal surface when electromagnetic radiation of sufficiently high frequency is incident on it. The key idea is that light transfers energy in discrete packets (photons), each with energy
where is the Planck constant and is the frequency.
Understanding the Question
A magnesium sheet in a vacuum emits electrons when illuminated with ultraviolet radiation. The question asks for the name of the phenomenon where light causes electron emission from a metal surface.
Approach
Recognise the described situation (electron emission caused by incident radiation) and state the standard name used in quantum physics.
Step-by-Step Reasoning
Electron emission from a metal due to incident electromagnetic radiation is known as the photoelectric effect.
Key Takeaways
- Electron emission from a metal due to light is the photoelectric effect.
Common Mistakes
- Naming it as “thermionic emission” (that is due to heating, not radiation).
- Writing “photoelectric emission” is usually acceptable, but “photoelectric effect” is the standard term.
Things to Be Careful About
- The presence of ultraviolet radiation and a metal surface are strong cues for the photoelectric effect, especially when electron emission is mentioned.
For emission of electrons to occur, the frequency of the ultraviolet radiation must be at least .
Working
At threshold, so
Answer
5.8 × 10^-19 J
Background Concept
In the photoelectric effect, the minimum energy needed to remove an electron from the metal surface is the work function energy . Emission just begins when the photon energy equals the work function:
where is the threshold frequency.
Understanding the Question
You are told that electrons are emitted only if the frequency is at least . That is the threshold frequency . You must calculate the work function energy of magnesium in joules.
Approach
Use the threshold condition . Substitute the given and Planck constant .
Step-by-Step Reasoning
- At threshold, the emitted electrons have zero maximum kinetic energy, so all the photon energy goes into overcoming the work function:
- Substitute values:
- Multiply the numbers and powers of ten:
- Quote to appropriate significant figures (typically 2 s.f. from ):
Key Takeaways
- Threshold frequency is linked to work function by .
- At threshold, .
Common Mistakes
- Using (that expression gives , not ).
- Forgetting units or writing when the question demands joules.
- Errors with powers of ten when multiplying by .
Things to Be Careful About
- , so .
- Use the given threshold frequency (), not the lower limit () mentioned later in the question.
For ultraviolet radiation with a frequency of , calculate the maximum speed of the emitted electrons.
maximum speed = ______
Working
Answer
5.7 × 10^5 m s^-1
Background Concept
Einstein’s photoelectric equation relates photon energy to the work function and the maximum kinetic energy of emitted electrons:
At threshold frequency , , so . Combining gives
The maximum kinetic energy is also
with the electron mass.
Understanding the Question
The incident frequency is , which is above the threshold . So electrons are emitted, and you must find the maximum speed (not the average speed). That comes from the maximum kinetic energy.
Approach
- Use to find the maximum kinetic energy.
- Convert kinetic energy to speed using .
Step-by-Step Reasoning
- Find the frequency difference:
- Compute maximum kinetic energy:
- Use kinetic energy to find speed (electron mass ):
Key Takeaways
- For photoemission, depends on frequency difference: .
- Convert from kinetic energy to speed with .
Common Mistakes
- Using (forgetting to subtract the work function / threshold term).
- Using the wrong mass (e.g. proton mass) or forgetting to use .
- Not taking the square root when solving for .
Things to Be Careful About
- Ensure and are in Hz and written with consistent powers of ten before subtracting.
- Quote speed to 2 or 3 significant figures, matching the input data.
- The question asks for maximum speed, so you must use (not average kinetic energy).
The frequency of the ultraviolet radiation incident on the magnesium sheet is varied between and .
On Fig. 8.1, sketch the variation with of the maximum kinetic energy of the emitted electrons. Use the space below for any working that you need.
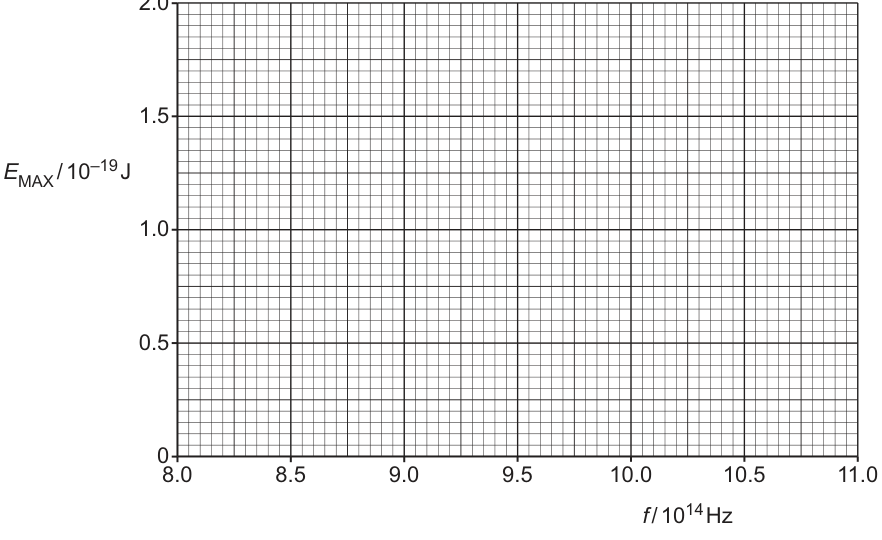
Working
So for and a straight line for .
At , .
At ,
Answer
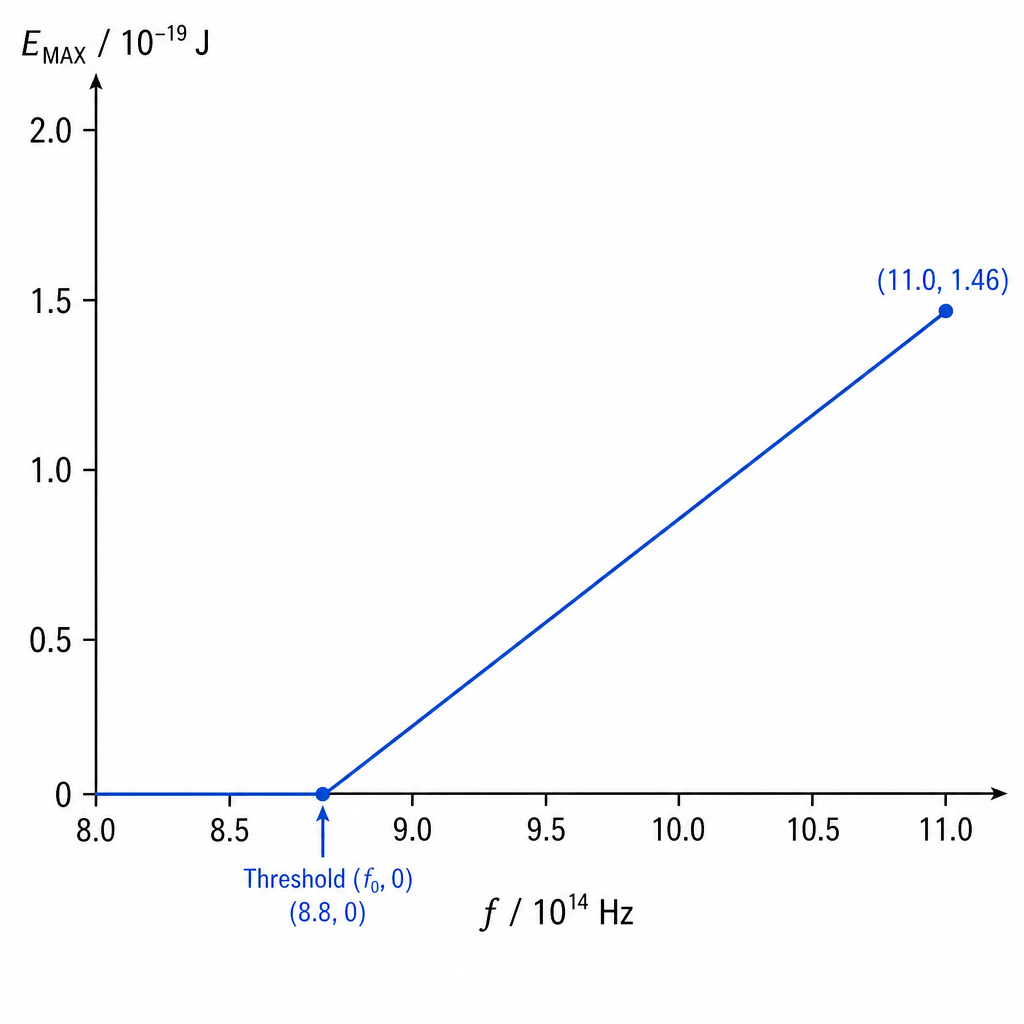
Straight line: E_MAX = 0 up to f = 8.8×10^14 Hz, then linear increase; passes through (8.8,0) and (11.0,1.46) on the given scaled axes.
Background Concept
From Einstein’s photoelectric equation,
and using , we get
This tells us two key graphical features:
- There is a threshold frequency below which no electrons are emitted.
- For frequencies above , increases linearly with with gradient .
Understanding the Question
You vary the incident frequency between and and must sketch how the maximum kinetic energy of emitted electrons changes.
Given earlier, the threshold frequency is . So for part of the x-range (from to in units of ) there should be no emission.
The axes are scaled as:
- horizontal axis: (so you plot numbers like and )
- vertical axis: (so you plot numbers like for ).
Approach
- Mark the threshold point where : at .
- For , show no emission (so on the graph).
- For , draw a straight line with positive slope. Use a second point (e.g. at ) to set the line correctly.
Step-by-Step Reasoning
- Threshold point:
- Find a second point at :
So on the scaled axes this is the point .
- Sketch:
- From to , draw the graph along the horizontal axis at .
- From upward, draw a straight line through and .
Key Takeaways
- The photoelectric vs graph is a straight line with x-intercept at .
- Below , there is no photoemission (so is zero on such exam sketches).
Common Mistakes
- Drawing the straight line starting at (incorrect: threshold is not at the origin).
- Giving a non-zero at even though .
- Drawing a curve rather than a straight line for .
Things to Be Careful About
- Use the axis scaling correctly: plot and (not and ) and plot (not ).
- Make sure the line hits exactly at .
- If you extend the straight line back, it should intersect the frequency axis at (that is the key physical meaning of the threshold).
Fluorine-18 () decays by beta-plus () emission with a half-life of 110 minutes.
Answer
A (\beta^+) particle is a positron (anti-electron).
Positron (anti-electron).
Background Concept
In beta-plus ((\beta^+)) decay, a proton in the nucleus changes into a neutron. To conserve charge and lepton number, the nucleus emits:
- a positron (the anti-particle of the electron), and
- an electron neutrino.
A positron has the same mass as an electron but charge (+e).
Understanding the Question
The question asks for the name of the (\beta^+) particle emitted when (^{18}_{9}\text{F}) decays.
Approach
Recall the standard identities:
- (\beta^-) is an electron
- (\beta^+) is a positron
Step-by-Step Reasoning
- (\beta^+) emission means emission of a particle with charge (+e) and electron mass.
- That particle is the positron, also called an anti-electron.
Key Takeaways
- (\beta^+) particle = positron.
- Positron: same mass as electron, opposite charge.
Common Mistakes
- Saying (\beta^+) is a proton (wrong mass and it is not emitted in beta decay).
- Saying (\beta^+) is an electron (that is (\beta^-)).
Things to Be Careful About
- The question asks for the particle name, not the full decay equation (which would also include a neutrino).
Working
Half-life:
Answer
(\lambda = 1.05 \times 10^{-4}\ \text{s}^{-1})
1.05 × 10^-4 s^-1
Background Concept
Radioactive decay is random, but for a large number of nuclei the decay rate is predictable. The decay constant (\lambda) is the probability per unit time that a nucleus decays.
Half-life (T_{1/2}) is the time for the number of undecayed nuclei (or activity) to fall to half. They are related by:
so
Understanding the Question
You are given the half-life of (^{18}_{9}\text{F}) as 110 minutes and asked to show that (\lambda = 1.05 \times 10^{-4}\ \text{s}^{-1}). So you must:
- convert minutes to seconds, then
- apply (\lambda = \ln 2 / T_{1/2}).
Approach
- Convert (110\ \text{min}) to seconds because (\lambda) is required in (\text{s}^{-1}).
- Substitute into (\lambda = \ln 2 / T_{1/2}).
Step-by-Step Reasoning
- Unit conversion:
- Use the half-life relation:
- Substitute numbers:
This matches the value required.
Key Takeaways
- Always convert (T_{1/2}) into seconds if (\lambda) is needed in (\text{s}^{-1}).
- (\lambda) and (T_{1/2}) are connected by (\ln 2).
Common Mistakes
- Forgetting to multiply by 60 (leaving (T_{1/2}) in minutes gives (\lambda) in (\text{min}^{-1})).
- Using (\log_{10}) instead of (\ln).
- Writing (\lambda = 2/T_{1/2}) or similar (incorrect).
Things to Be Careful About
- (\ln 2 = 0.693) (not (0.301), which is (\log_{10} 2)).
- Quote the final (\lambda) to appropriate significant figures and in standard form.
Working
Molar mass of (^{18}\text{F}): (M = 18\ \text{g mol}^{-1} = 18 \times 10^{-3}\ \text{kg mol}^{-1}).
With (\lambda = 1.05 \times 10^{-4}\ \text{s}^{-1}),
Answer
(7.4 \times 10^{9}\ \text{Bq})
7.4 × 10^9 Bq
Background Concept
Activity (A) is the number of decays per second, measured in becquerel ((\text{Bq})). It is related to the number of undecayed nuclei (N) by:
where (\lambda) is the decay constant in (\text{s}^{-1}).
To find (N) from a mass, use moles:
where:
- (m) is mass (in kg here)
- (M) is molar mass (kg mol(^{-1}))
- (N_A) is Avogadro constant (6.02 \times 10^{23}\ \text{mol}^{-1}).
Understanding the Question
You are given a small mass of fluorine-18: (2.1 \times 10^{-12}\ \text{kg}). You must find its activity, using the decay constant found earlier ((1.05 \times 10^{-4}\ \text{s}^{-1})).
So you need:
- number of nuclei (N) in that mass
- apply (A = \lambda N).
Approach
- Convert the mass into moles using the molar mass of (^{18}\text{F}) (18 g per mole).
- Convert moles into number of nuclei with (N_A).
- Multiply by (\lambda) to get activity.
Step-by-Step Reasoning
- Use (M = 18\ \text{g mol}^{-1} = 18 \times 10^{-3}\ \text{kg mol}^{-1}).
- Find moles:
- Find number of nuclei:
- Use (A = \lambda N):
Since (1\ \text{Bq} = 1\ \text{s}^{-1}),
Key Takeaways
- Activity depends on both (\lambda) and how many nuclei are present.
- To get (N) from mass, you must go via moles and Avogadro’s constant.
Common Mistakes
- Using (M = 18\ \text{kg mol}^{-1}) instead of (18 \times 10^{-3}\ \text{kg mol}^{-1}) (factor of (10^3) error).
- Forgetting (A = \lambda N) and using (A = N/\lambda) (inverted).
- Confusing (^{18}\text{F}) with fluorine’s relative atomic mass (19) (would give a small but mark-losing difference).
Things to Be Careful About
- Keep units consistent: kg with kg mol(^{-1}), so (n) comes out in mol.
- Quote the activity to 2–3 significant figures and include (\text{Bq}).
- Ensure you use (\lambda) in (\text{s}^{-1}), not (\text{min}^{-1}).
A small sample of fluorine-18 injected into the body acts as a tracer for use in medical imaging.
Describe how the interaction of a particle with an electron in the body enables the formation of an image.
Answer
The emitted positron interacts with an electron and they annihilate.
Two (\gamma)-photons (each about (511\ \text{keV})) are produced and travel in opposite directions.
Detectors outside the body detect the two (\gamma) photons in coincidence; the line along which they are detected locates the decay position, allowing an image of tracer distribution to be built up.
Positron annihilation with electron produces two opposite 511 keV gamma photons; coincidence detection locates decay position to form an image.
Background Concept
In PET (positron emission tomography), a radioactive tracer emits positrons. A positron is antimatter, so when it meets an electron, they can undergo annihilation:
- their mass-energy is converted into electromagnetic energy,
- typically producing two gamma photons.
Because momentum must be conserved, the two photons are emitted approximately back-to-back (opposite directions). Each photon has energy (511\ \text{keV}), corresponding to the electron/positron rest energy (m_ec^2).
The PET scanner has detectors arranged around the body. If two detectors register gamma photons at the same time (a coincidence event), the source lies somewhere along the straight line joining those detectors.
Understanding the Question
You are asked to describe how a (\beta^+) particle (positron) interacting with an electron in the body enables image formation. So the key steps are:
- positron meets electron
- annihilation produces gamma photons
- detection system uses those photons to locate where the decay occurred
- many events build up an image of tracer concentration.
Approach
Describe the physical chain from decay to image:
- (\beta^+) emission → positron travels a short distance → annihilation → two gamma photons → coincidence detection → reconstruction of tracer distribution.
Step-by-Step Reasoning
- Emission and slowing down: The fluorine-18 nucleus emits a positron. In tissue, the positron quickly loses kinetic energy through collisions.
- Annihilation: The positron meets an electron and they annihilate.
- Gamma production: The annihilation produces two gamma photons, each with energy about (511\ \text{keV}).
- Opposite directions: The photons travel in opposite directions (approximately (180^{\circ}) apart) so that momentum is conserved.
- Detection and localisation: Detectors around the body detect pairs of gamma photons arriving at the same time. The pair defines a line of response, indicating where the annihilation happened.
- Image formation: Repeating for many decays allows a computer to map where annihilations occur most often, producing an image of tracer distribution.
Key Takeaways
- PET imaging uses annihilation gamma rays, not the positron directly.
- Two opposite gamma photons + coincidence timing gives positional information.
Common Mistakes
- Saying one gamma photon is produced (typically two are expected for PET).
- Not linking detection to localisation (must explain how an image is built).
- Confusing PET with gamma-camera imaging that detects gamma rays emitted directly by the nucleus.
Things to Be Careful About
- The key credited ideas are: annihilation, two gamma photons, opposite directions, and coincidence detection leading to location/image.
- “Opposite directions” may be described as (180^{\circ}) apart or “back-to-back”.
Suggest why 110 minutes is a suitable half-life for a nuclide used as a tracer in medical diagnosis.
Answer
110 min is long enough for the tracer to be prepared, administered and for measurements to be taken with sufficient activity.
It is short enough that the activity falls rapidly after the scan, so the patient’s radiation dose is reduced.
Long enough for preparation/scan with detectable activity; short enough to reduce dose as it decays soon after.
Background Concept
A tracer must be radioactive enough to give a detectable signal, but not so long-lived that it keeps irradiating the patient unnecessarily.
The half-life controls how quickly the activity decreases:
- long half-life → activity persists for a long time (higher total dose)
- short half-life → activity drops quickly (lower dose) but may become too weak to detect.
Understanding the Question
The question asks why a half-life of 110 minutes is suitable for a medical tracer (like (^{18}\text{F}) used in PET). You need two sensible reasons, typically one practical and one safety-related.
Approach
Give two balanced points:
- practical usability during the scanning time
- reduced dose because it decays away reasonably quickly.
Step-by-Step Reasoning
- Practical point: A PET procedure involves producing the tracer, transporting it (possibly within a hospital), injecting it, waiting for uptake, and then scanning. A half-life of 110 minutes means the activity does not halve too quickly during these steps, so the signal remains strong enough to detect.
- Safety point: Because 110 minutes is not very long, the activity drops substantially within a few hours. This reduces the time the patient remains radioactive and lowers the radiation dose after diagnosis.
Key Takeaways
- Suitable tracer half-life = compromise between detectability and minimising dose.
- (^{18}\text{F}) (110 min) is short-lived enough for safety but long-lived enough for imaging logistics.
Common Mistakes
- Saying only “short half-life is good” without mentioning that it must still be long enough for measurement.
- Claiming that a long half-life is always safer (it is usually the opposite for dose accumulation).
Things to Be Careful About
- The mark scheme usually expects two distinct reasons; don’t repeat the same idea in different words.
- Avoid vague statements like “it is convenient”; specify what it is convenient for (time to prepare/inject/scan).
Answer
Redshift means spectral lines are shifted to longer wavelength, showing (Doppler) that the source is moving away.
Most galaxies in all directions show redshift, so they are receding from us.
More distant galaxies have larger redshift (greater recession speed), consistent with space itself expanding.
Redshift shows galaxies are receding (Doppler shift to longer wavelength); since this occurs in all directions and increases with distance, it implies the Universe is expanding.
Background Concept
Redshift is an increase in the observed wavelength of a spectral line compared with its emitted (laboratory) wavelength:
For relatively small speeds compared with the speed of light , the Doppler interpretation gives
So a positive (redshift) corresponds to recession (moving away).
In cosmology, the key observation is not just that some objects are redshifted, but that almost all distant galaxies are redshifted, and the redshift increases systematically with distance.
Understanding the Question
You are asked to explain how observing redshift in light from galaxies leads scientists to conclude that the Universe is expanding.
So you need to connect:
- spectral lines shifted to longer wavelengths,
- interpretation as recession,
- the pattern across many galaxies (in all directions, and stronger for more distant galaxies),
- to the idea of an expanding Universe.
Approach
Make three clear points (typical 3-mark structure):
- Define what redshift means in terms of wavelength.
- State the Doppler/recession interpretation (galaxy moving away).
- Use the global trend (many galaxies, in all directions; larger redshift for larger distance) to infer expansion of space.
Step-by-Step Reasoning
-
Observation: When we compare known spectral lines (e.g. from hydrogen) with those from a galaxy, the galaxy’s lines appear at a longer wavelength. That is a redshift.
-
Physical meaning: For waves, a longer observed wavelength occurs if the source is receding, which is a Doppler effect. So the galaxy is moving away from the Earth.
-
Cosmological inference: When this is seen for very many galaxies in every direction, it indicates that galaxies are generally receding from each other. Furthermore, the fact that more distant galaxies have larger redshift means they recede faster, matching Hubble’s law (). This pattern is naturally explained if the scale of the Universe is increasing with time: the Universe is expanding.
Key Takeaways
- Redshift = longer observed wavelength.
- Redshift usually indicates recession.
- The universal, distance-dependent recession of galaxies implies expansion.
Common Mistakes
- Saying “redshift means the galaxy is moving faster” without stating it is moving away.
- Mentioning Doppler shift but not connecting it to the pattern for many galaxies.
- Claiming it proves “the Earth is at the centre”; expansion does not require a central point.
Things to Be Careful About
- Use the language of recession and increasing redshift with distance.
- Keep the explanation qualitative; no calculation is required here.
Stars in a distant galaxy emit radiation. The total luminosity of the stars in the galaxy is .
The emission spectrum of the radiation contains a line X at a wavelength of .
Radiation from the galaxy is observed on the Earth. The observed radiation has a radiant flux intensity of . In the observed emission spectrum, line X is at a wavelength of .
Determine:
Working
Using
Answer
1.34 × 10^25 m
Background Concept
Luminosity is the total power emitted by a source (in ). Radiant flux intensity is the power received per unit area (in ).
If the source radiates uniformly in all directions, the power spreads out over the surface area of a sphere of radius :
So the flux at distance is
This is an inverse-square law: doubling makes four times smaller.
Understanding the Question
You are given the galaxy’s luminosity and the observed flux on Earth . You must determine the distance .
Approach
Rearrange the inverse-square relation for :
Then substitute the values (already in SI units).
Step-by-Step Reasoning
Start with
Rearrange:
Substitute:
Compute the denominator first: .
Then
Square root:
Key Takeaways
- Use for isotropic emission.
- Rearranging introduces a square root.
- Keep units in and to get in .
Common Mistakes
- Forgetting the factor.
- Using or .
- Not taking the square root at the end.
Things to Be Careful About
- Powers of ten: dividing by increases the power by .
- Quote the final distance in standard form and with unit .
Working
Answer
3.10 × 10^7 m s^-1
Background Concept
A spectral line has a known emitted wavelength . If the source is moving relative to the observer, the observed wavelength is shifted.
The redshift is
For speeds small compared with , the Doppler approximation gives
A positive (redshift) means recession.
Understanding the Question
Line X is emitted at but observed at . You are asked to determine the galaxy’s speed relative to Earth.
Approach
- Find the fractional shift .
- Multiply by to get .
Step-by-Step Reasoning
Compute the wavelength change:
Compute the fractional change:
Use :
Key Takeaways
- Redshift comes from comparing observed and emitted wavelengths.
- For small redshift, .
- Redshift implies motion away from the observer.
Common Mistakes
- Using in the denominator instead of .
- Forgetting to subtract wavelengths (using directly without minus 1).
- Mixing nm and m unnecessarily (the ratio is unitless, so nm cancels).
Things to Be Careful About
- This uses the non-relativistic approximation; at higher redshift you would need a relativistic formula. For this approximation is typically accepted at this level.
- Quote the answer in and standard form.
Observations of many galaxies, such as the one in (b), lead to many pairs of values of and . Plotting these values reveals a trend.
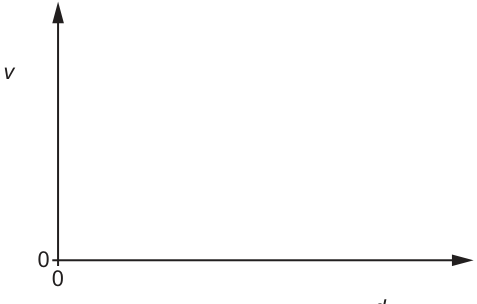
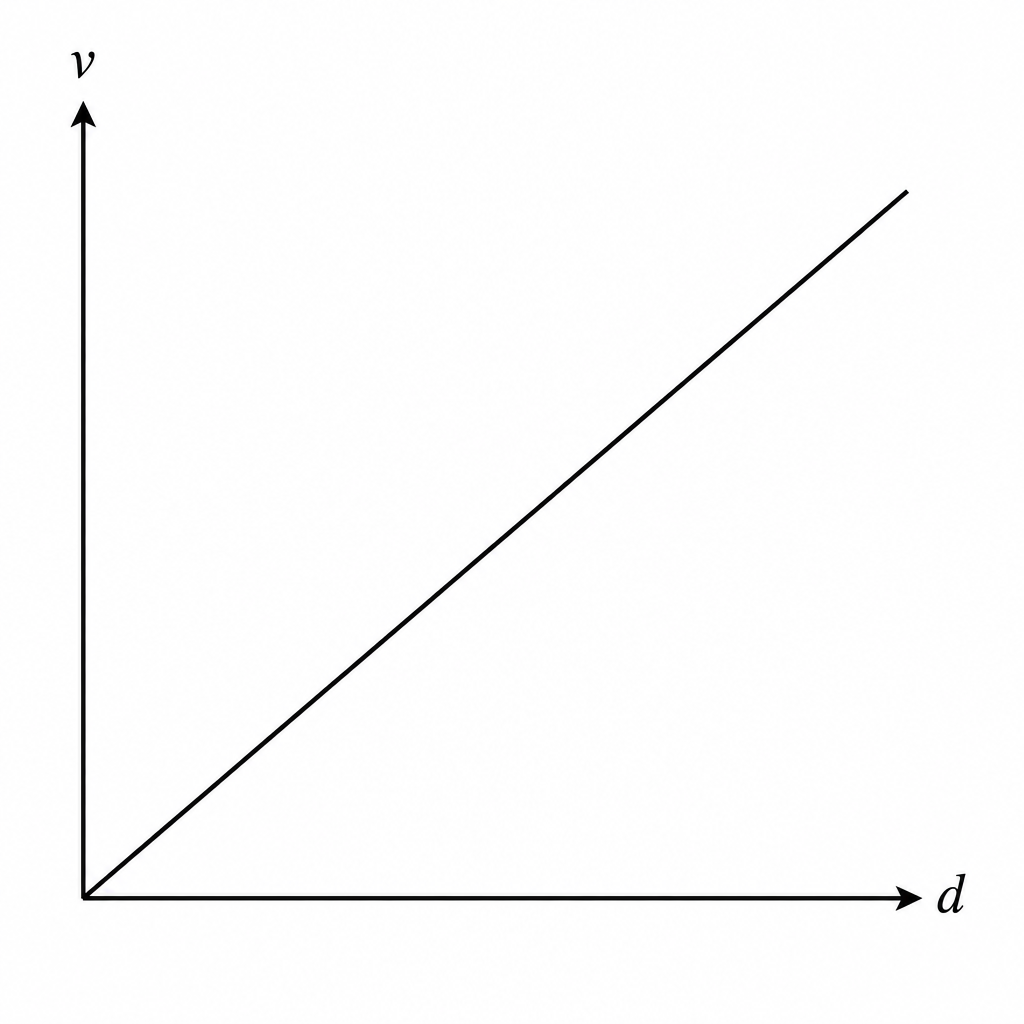
Answer
Straight line through the origin with positive gradient (increasing with increasing ).
Straight line through the origin with positive gradient.
Background Concept
Hubble’s law states that for distant galaxies, recession speed is proportional to distance :
where is the Hubble constant.
A proportional relationship graphs as a straight line through the origin, with slope equal to the constant of proportionality.
Understanding the Question
You are told that many galaxies give pairs of values and that plotting reveals a trend. You must sketch against on axes that start at .
Approach
Use the known observed trend: as distance increases, galaxies recede faster, approximately following . Therefore sketch a straight line starting at the origin and rising to the right.
Step-by-Step Reasoning
- The horizontal axis is distance .
- The vertical axis is recession speed .
- If is directly proportional to , then when , , so the line goes through the origin.
- Increasing gives increasing , so the line has a positive slope.
Key Takeaways
- Hubble’s law corresponds to a straight-line – graph through the origin.
- The slope is constant and represents .
Common Mistakes
- Drawing a curve rather than a straight line.
- Drawing a line that does not pass through the origin.
- Drawing a negative gradient (which would imply approaching galaxies as distance increases).
Things to Be Careful About
- The sketch should show the overall linear trend; you are not expected to plot data points here.
- Ensure axes labels match ( on , on ).
State the name of the quantity represented by the gradient of the line in Fig. 10.1.
gradient = ______
Answer
Gradient Hubble constant, .
Hubble constant (H0)
Background Concept
Hubble’s law is
This has the same structure as the straight-line equation , where:
So the gradient (slope) of the against graph is the Hubble constant.
Understanding the Question
You have already sketched the – trend. The question asks for the name of the quantity represented by the gradient of that line.
Approach
Compare the graph’s relationship with and identify the constant multiplying .
Step-by-Step Reasoning
On a vs graph, the gradient is
From Hubble’s law , dividing both sides by (for ) gives
So the gradient equals , the Hubble constant.
Key Takeaways
- The gradient of a – graph is the constant of proportionality.
- For galaxies, that constant is the Hubble constant .
Common Mistakes
- Saying “Hubble’s law” instead of the quantity (the Hubble constant).
- Confusing the gradient with the intercept (the expected intercept here is approximately zero).
Things to Be Careful About
- The question asks for the name of the quantity, not its unit or numerical value.
- Correct symbol is often given as .