Physics 9702/42 — May/June 2024
Cambridge A-Level · A Level Structured Questions · worked solutions for every part, with the mark scheme
Topics Motion in a Circle · Temperature · Ideal Gases · Thermodynamics · Oscillations · Electric Fields · +6 more
Answer
One radian is the angle subtended at the centre of a circle by an arc whose length is equal to the radius.
One radian is the angle subtended at the centre of a circle by an arc whose length is equal to the radius.
Background Concept
Angles can be measured in degrees or in radians. The radian is defined using the geometry of a circle:
where:
- is the angle in radians,
- is the arc length,
- is the radius.
This definition is useful in circular motion because many equations (e.g. ) use radians naturally.
Understanding the Question
You are asked to define the radian (i.e. give the standard geometrical definition). No calculation is needed.
Approach
Use the defining relationship and state what it means when rad.
Step-by-Step Reasoning
From
if , then
So one radian is the central angle that cuts off an arc length equal to the radius.
Key Takeaways
- Radian measure is defined by .
- rad corresponds to .
Common Mistakes
- Saying “a radian is degrees” without giving the definition (this is a conversion, not a definition).
- Omitting “at the centre” or not mentioning the arc-length condition.
Things to Be Careful About
- The definition requires arc length (along the circumference), not a straight-line chord.
- Use clear wording: “subtended at the centre by an arc of length equal to the radius.”
A circular metal disc spins horizontally about a vertical axis, as shown in Fig. 1.1.
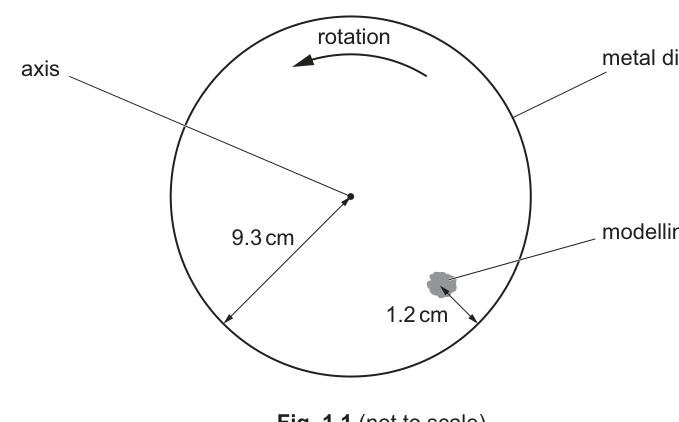
A piece of modelling clay is attached to the disc.
For the instant when the piece of modelling clay is in the position shown, draw on Fig. 1.1:
Answer
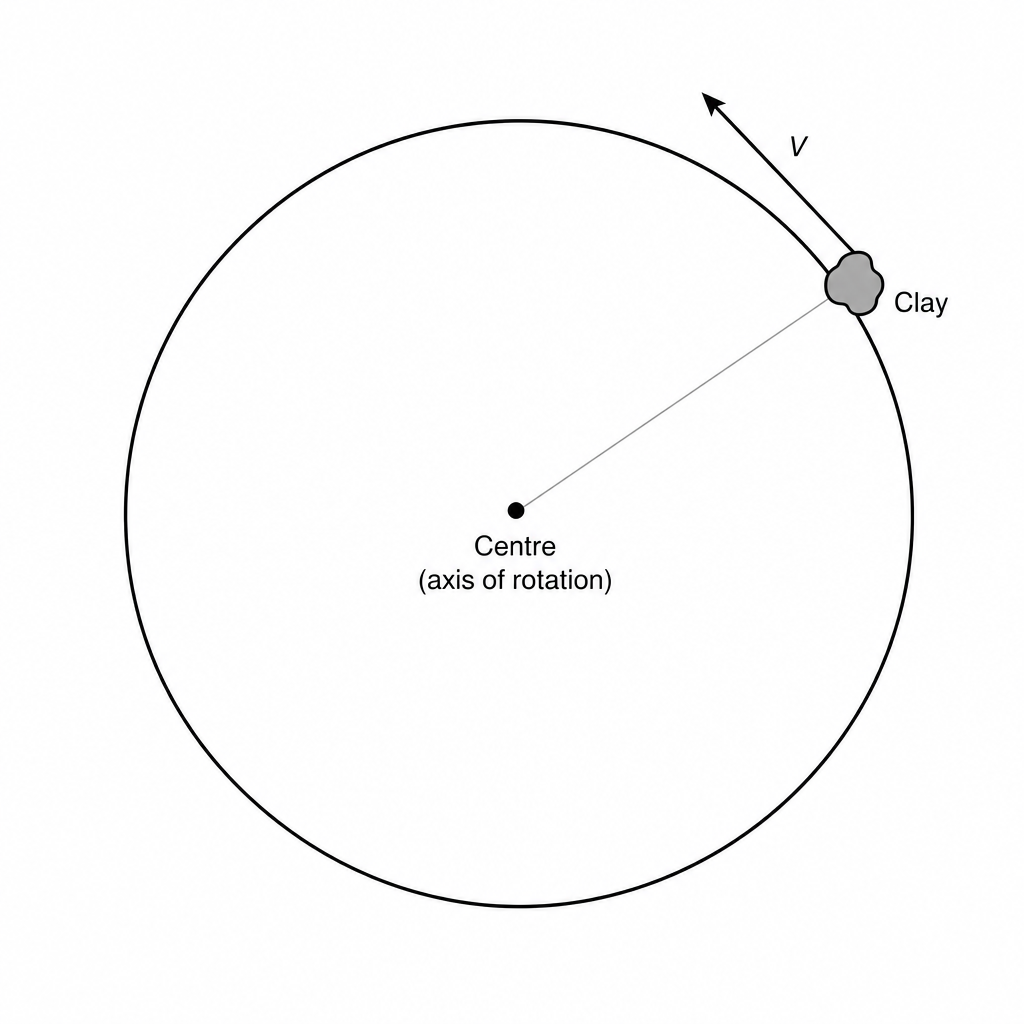
is tangent to the circular path at the clay and in the direction of rotation (perpendicular to the radius).
V is tangent to the circular path at the clay and in the direction of rotation.
Background Concept
For uniform circular motion, the instantaneous velocity of an object is always:
- tangential to the circle (i.e. along the direction of motion), and
- therefore perpendicular to the radius at that point.
Even if the speed is constant, the velocity vector changes direction continuously.
Understanding the Question
The disc rotates anticlockwise (as indicated on the figure). At the instant shown, you must draw an arrow labelled showing the direction of the modelling clay's velocity.
Approach
- Draw the radius line from the centre to the clay.
- The velocity arrow is drawn at the clay and perpendicular to that radius.
- Choose the correct sense (clockwise/anticlockwise) using the rotation direction shown.
Step-by-Step Reasoning
- The clay is moving around a circle centred on the axis.
- At the shown position, its instantaneous motion is along the tangent.
- Since the rotation is anticlockwise, the velocity direction is the anticlockwise tangent at that point.
Key Takeaways
- Velocity in circular motion is tangent to the circle.
- Tangent direction is set by the rotation direction.
Common Mistakes
- Drawing pointing towards the centre (that would be acceleration, not velocity).
- Drawing along the radius (velocity is not radial for circular motion).
Things to Be Careful About
- The arrow must be drawn at the clay's position and must be clearly tangent.
- Make sure the tangent points in the same sense as the rotation shown (anticlockwise here).
an arrow, labelled A, showing the direction of the acceleration of the modelling clay.
Answer
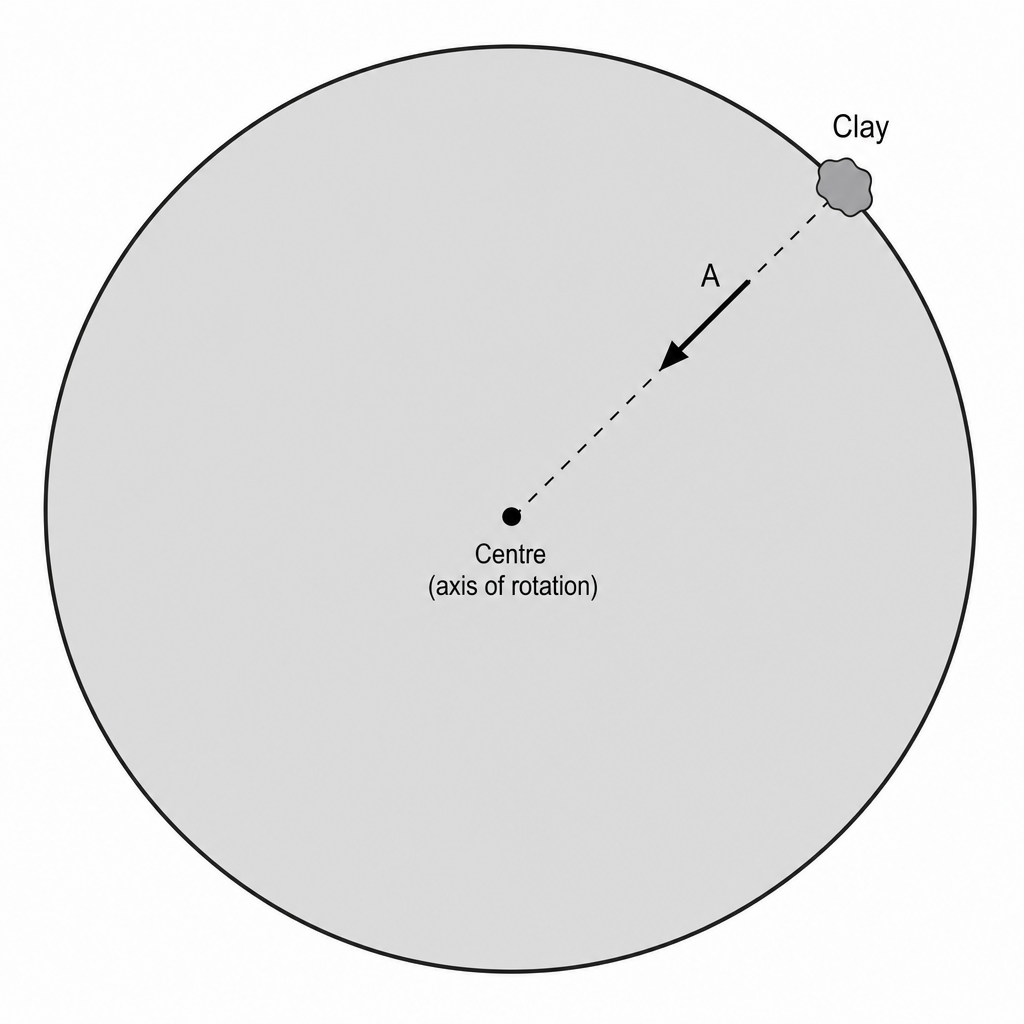
is directed from the clay towards the centre of the disc (radially inward).
A is directed from the clay towards the centre of the disc (radially inward).
Background Concept
In circular motion, the acceleration responsible for changing the direction of velocity is the centripetal acceleration. It always points:
- towards the centre of the circle.
Its magnitude can be found by
but for this part only the direction is required.
Understanding the Question
At the instant shown in Fig. 1.1, you must draw an arrow labelled showing the direction of the modelling clay's acceleration.
Approach
Centripetal acceleration is radial and inward, so draw the arrow from the clay pointing straight towards the axis of rotation (centre of disc).
Step-by-Step Reasoning
- The clay is moving in a circle about the centre.
- To keep it moving in a circle, its velocity must continually change direction.
- The acceleration that causes this change must point towards the centre, so is drawn radially inward.
Key Takeaways
- Acceleration in circular motion (centripetal) points to the centre.
- Velocity is tangent; acceleration is radial.
Common Mistakes
- Drawing tangent to the circle (confusing acceleration with velocity).
- Drawing away from the centre (that would be centripetal in the wrong direction).
Things to Be Careful About
- The arrow must start at the clay and point exactly towards the centre.
- Do not include extra components unless asked; the required direction is purely radial.
The metal disc in Fig. 1.1 has a radius of .
The centre of gravity of the modelling clay is from the rim of the disc and moves with a speed of .
Working
Radius of disc , clay is from rim
Answer
8.4 rad s^-1
Background Concept
For a point moving in a circle of radius with angular speed (in ), the linear (tangential) speed is
This comes from the radian definition: arc length . Differentiating with respect to time gives .
Understanding the Question
You are told:
- disc radius ,
- the clay's centre of gravity is in from the rim,
- linear speed of the clay is .
You must find the angular speed of the disc.
Approach
- Work out the radius of the clay's circular path: subtract the “distance from rim” from the disc radius.
- Convert to metres.
- Rearrange to and substitute.
Step-by-Step Reasoning
- The clay is not exactly at the rim, so its distance from the centre is
Convert to SI units:
- Use :
Key Takeaways
- Identify the correct radius for the moving object (not always the disc radius).
- Use with SI units.
Common Mistakes
- Using instead of .
- Forgetting to convert cm to m.
- Giving units as without stating radians (Cambridge expects ).
Things to Be Careful About
- “ from the rim” means inward, so subtract.
- Significant figures: the inputs are given to 2 s.f. / 2 d.p., so is appropriate.
Working
Answer
5.7 m s^-2
Background Concept
In circular motion, the acceleration is directed towards the centre and is called centripetal acceleration. Its magnitude is
(or equivalently ). This acceleration exists even if speed is constant, because the velocity direction is changing.
Understanding the Question
Using the same situation as part (c)(i):
- ,
- the radius of the clay’s path is .
You must calculate the centripetal acceleration .
Approach
Use with SI units.
Step-by-Step Reasoning
- Use the correct radius:
- Substitute into the centripetal acceleration formula:
- Evaluate:
Key Takeaways
- Centripetal acceleration depends on speed and radius: larger increases strongly (square), larger reduces .
- Always use metres in .
Common Mistakes
- Using (the disc radius) instead of .
- Forgetting to square .
- Incorrect units (should be ).
Things to Be Careful About
- here is the magnitude; direction is towards the centre (as in part b(ii)).
- Significant figures: matches the given data precision.
A second piece of modelling clay is attached to the disc in the position shown in Fig. 1.2.
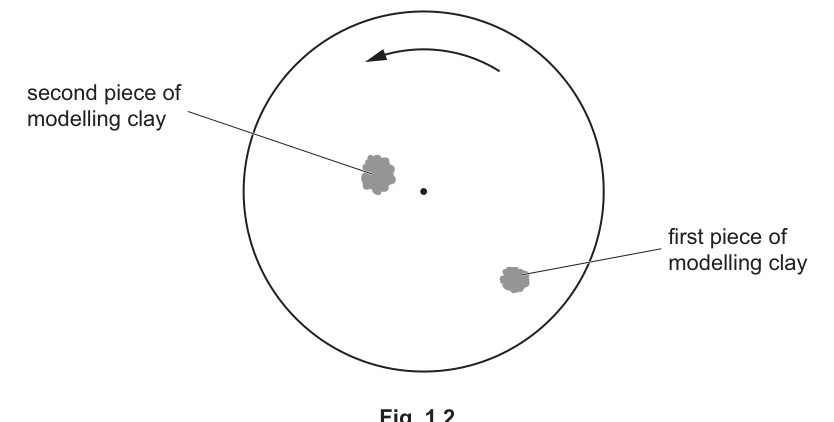
The second piece of modelling clay has a larger mass than the first piece.
By placing one tick () in each row, complete Table 1.1 to show how the quantities indicated compare for the two pieces of modelling clay.
Table 1.1
| quantity | less for second piece than first piece | same for both pieces | greater for second piece than first piece |
|---|---|---|---|
| angular speed | |||
| linear speed | |||
| acceleration |
Answer
- angular speed: same
- linear speed: less for second piece
- acceleration: less for second piece
Angular speed same; linear speed less; acceleration less (for the second piece).
Background Concept
For points on a rigid disc rotating with angular speed :
and centripetal acceleration magnitude is
(or ). For a rigid body, every point completes one rotation in the same time, so all points have the same .
Understanding the Question
A second piece of clay is attached closer to the centre than the first, and has a larger mass. You must compare, for the two pieces:
- angular speed,
- linear speed,
- acceleration.
Only the position (radius) affects and ; the mass does not affect these kinematic quantities for a given rotation rate.
Approach
- Use rigid-body rotation to state both pieces share the same angular speed .
- Since the second piece has smaller radius , use to conclude its is smaller.
- Use to conclude its is smaller.
Step-by-Step Reasoning
-
Angular speed: The disc rotates as a single rigid object, so every point turns through the same angle in the same time. Therefore is the same for both pieces.
-
Linear speed: For each piece,
The second piece has smaller , and is the same, so is less for the second piece.
- Acceleration: For each piece,
Again, smaller with the same means is less for the second piece.
(The larger mass would affect the required centripetal force , but force is not asked here.)
Key Takeaways
- On a rigid rotating disc: is common to all points.
- Smaller radius smaller linear speed .
- Smaller radius smaller centripetal acceleration .
Common Mistakes
- Thinking the heavier second piece must have greater acceleration (mass does not change kinematics for a given rotation).
- Saying linear speed is the same everywhere on the disc (confusing with ).
Things to Be Careful About
- Distinguish clearly:
- (same everywhere on the disc),
- (depends on ),
- (depends on ).
- If the question had asked about force, then mass would matter via .
With reference to thermal energy, state what is meant by two objects being in thermal equilibrium.
Answer
Two objects are in thermal equilibrium when there is no net transfer of thermal energy between them (so their temperatures are the same).
No net thermal energy transfer occurs between them (they are at the same temperature).
Background Concept
Thermal energy is the internal energy associated with the random motion and interactions of particles. When two objects are in contact (or connected so energy can be transferred), thermal energy is transferred from the higher-temperature object to the lower-temperature object.
Thermal equilibrium is the condition reached when this energy transfer stops because there is no temperature difference driving a net flow of thermal energy.
Understanding the Question
You are asked to define “thermal equilibrium” specifically in terms of thermal energy. So the key point to mention is what happens to thermal energy transfer (and, equivalently, what that implies about temperature).
Approach
State the defining feature: in thermal equilibrium there is no net thermal energy transfer between the objects. It is also acceptable to add that this means the temperatures are equal.
Step-by-Step Reasoning
- If object A is hotter than object B, thermal energy transfers from A to B.
- This continues until the temperatures become equal.
- When the temperatures are equal, the transfers in each direction balance, so there is no net thermal energy transfer.
Key Takeaways
- Thermal equilibrium means equal temperature.
- In equilibrium, there is no net thermal energy transfer between the objects.
Common Mistakes
- Saying only “they have the same thermal energy” (not required and generally false; equal temperature does not imply equal thermal energy).
- Not mentioning thermal energy transfer at all.
Things to Be Careful About
- The phrase “no net transfer” is important: microscopic exchanges can still occur, but overall there is no net flow of thermal energy.
Two cylinders X and Y each contain a sample of an ideal gas. The samples are in thermal equilibrium with each other.
X has a volume of and contains of gas at a pressure of . Y has a volume of and contains gas at a pressure of . Data for the two cylinders are shown in Fig. 2.1.
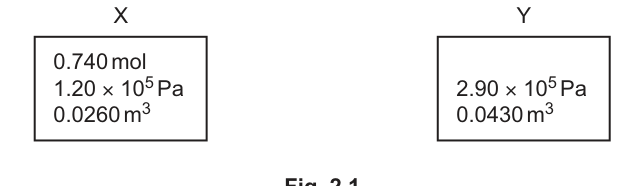
Working
Using the ideal gas equation,
Answer
234 °C
Background Concept
For an ideal gas, the equation of state relates pressure , volume , amount of gas (in moles), and absolute temperature :
where . The temperature in this equation must be in kelvin. Conversion between kelvin and degrees Celsius is
Understanding the Question
Cylinder X has given values of , , and . You must calculate using , and then convert that absolute temperature to degrees Celsius to show it is .
Given for X:
Approach
- Rearrange to .
- Substitute in SI units (already given in SI here).
- Convert from kelvin to degrees Celsius by subtracting 273.
Step-by-Step Reasoning
Start with
Compute :
Compute :
So
Convert to degrees Celsius:
Rounding to match the expected value gives .
Key Takeaways
- Always use kelvin in .
- Convert to degrees Celsius only at the end if the question asks.
Common Mistakes
- Using directly as kelvin (wrong scale).
- Forgetting to use the mole value (using ).
- Rounding too early (can shift the final Celsius value by ).
Things to Be Careful About
- Keep in SI units; then must be in Pa and in .
- Use appropriate significant figures; intermediate values can be kept to 3 s.f. and rounded at the end.
Working
Thermal equilibrium implies .
For Y,
Number of molecules:
Answer
1.78 × 10^24
Background Concept
If two samples of gas are in thermal equilibrium, they have the same temperature. For an ideal gas, you can relate the macroscopic quantities using either
or at the molecule level,
where is the number of molecules and is the Boltzmann constant. Another common route is to find first and then use
where is the Avogadro constant.
Understanding the Question
You are asked to find the number of molecules in cylinder Y.
- You are not given directly.
- You are told X and Y are in thermal equilibrium, so .
- From part (i), , so you can use that temperature for Y.
Given for Y:
Unknown: .
Approach
- Use thermal equilibrium to set .
- Use to find .
- Convert moles to molecules with .
(Equivalently, you could use , but is usually more familiar.)
Step-by-Step Reasoning
Because X and Y are in thermal equilibrium,
Rearrange the ideal gas equation for Y:
Substitute values:
So
Now convert to number of molecules using :
Key Takeaways
- Thermal equilibrium means equal temperature, which is often the missing link in multi-part questions.
- To get number of molecules, either use or .
Common Mistakes
- Using as the temperature in kelvin for Y (must use ).
- Forgetting to convert from moles to molecules (leaving the answer as instead of ).
- Using with the wrong power of ten.
Things to Be Careful About
- Keep temperature in kelvin throughout calculations.
- Give to a sensible number of significant figures (typically 3 s.f. here).
The gas in X consists of molecules that each have a mass that is four times the mass of a molecule of the gas in Y.
Explain how the root-mean-square (r.m.s.) speed of the molecules in X compares with the r.m.s. speed of the molecules in Y.
Working
At the same temperature,
So .
Given ,
Answer
The r.m.s. speed in X is half the r.m.s. speed in Y.
c_rms in X is half that in Y.
Background Concept
Temperature of an ideal gas is linked to the average translational kinetic energy of its molecules. For one molecule,
where
- is the mass of one molecule,
- is the root-mean-square speed (a measure of typical molecular speed),
- is the Boltzmann constant,
- is absolute temperature.
Rearranging gives
So at fixed , heavier molecules move more slowly: .
Understanding the Question
The two gases are in thermal equilibrium (from part b), so they are at the same temperature. You are told that each molecule in X has mass four times that of a molecule in Y:
You must compare their r.m.s. speeds, not calculate an actual numerical speed.
Approach
- Use the kinetic theory relation between , , and .
- Since is the same for both, compare speeds using the mass ratio only.
- Apply the square-root relationship carefully.
Step-by-Step Reasoning
From kinetic theory:
Rearrange for :
At the same temperature , is the same constant for both gases, so
Therefore,
With :
So molecules in X have half the r.m.s. speed of those in Y.
Key Takeaways
- For ideal gases, temperature sets the average kinetic energy per molecule.
- At fixed temperature, decreases as molecular mass increases: .
- A factor of 4 in mass becomes a factor of 2 in r.m.s. speed because of the square root.
Common Mistakes
- Saying speed is 4 times smaller instead of 2 times smaller (forgetting the square root).
- Using the molar mass ratio incorrectly (the question is explicitly about mass per molecule).
- Forgetting that thermal equilibrium implies the same temperature.
Things to Be Careful About
- Always apply the square root when moving from to .
- The comparison only works because the temperatures are equal; otherwise you would need both and in the ratio.
Answer
The internal energy of a system is the total random kinetic energy of its molecules plus the total intermolecular potential energy (due to their positions/separations).
Sum of random molecular kinetic energy and intermolecular potential energy.
Background Concept
Internal energy, , is the energy stored microscopically in a system. At A Level, it is modelled as:
- the random kinetic energy of the particles (translational, and for some materials also rotational/vibrational), and
- the potential energy associated with intermolecular forces (depends on separation/arrangement of particles).
It does not include macroscopic kinetic energy of the whole object (e.g. a moving block) or macroscopic gravitational potential energy of the whole system in a field.
Understanding the Question
You are asked to state what is meant by internal energy. So the mark-winning content is a clear definition in terms of molecular (microscopic) kinetic and potential energies.
Approach
Give the standard definition used in the thermodynamics topic: “random molecular kinetic energy + intermolecular potential energy”. Keep it short and explicit.
Step-by-Step Reasoning
- Identify that internal energy is a microscopic energy store.
- State the two parts:
- random kinetic energy of molecules,
- potential energy due to intermolecular forces/positions.
- Express it as “sum/total” for the whole system.
Key Takeaways
- is a microscopic energy store.
- For A Level definitions, always mention both: random kinetic and intermolecular potential energy.
Common Mistakes
- Saying only “total kinetic energy” (missing potential energy).
- Including macroscopic kinetic energy of the object as a whole.
- Writing “heat energy” (heat is energy in transfer, not energy stored).
Things to Be Careful About
- Use the word random kinetic energy to distinguish from bulk motion.
- Specify potential energy is intermolecular (due to particle separation/arrangement).
With reference to molecular kinetic and potential energies, describe and explain how the internal energy of the system changes when:
Answer
Temperature increases → mean random molecular kinetic energy increases.
At constant volume, the average intermolecular separation is unchanged (ideal gas: intermolecular potential energy negligible/unchanged), so the molecular potential energy is (approximately) constant.
Hence internal energy increases (due to increased random kinetic energy); also so .
Internal energy increases because the molecules’ mean random kinetic energy increases; potential energy is unchanged (approximately), and no work is done since .
Background Concept
For a gas, internal energy is the sum of:
- random kinetic energy of molecules, and
- intermolecular potential energy.
Temperature is a measure of average random kinetic energy. For an ideal gas,
so higher means higher mean molecular kinetic energy.
If a gas is heated at constant volume, its volume does not change, so the gas does no expansion work:
Understanding the Question
You must describe and explain how internal energy changes when a gas is heated at constant volume and its temperature rises. The wording “with reference to molecular kinetic and potential energies” means you must explicitly discuss both components.
Approach
- Use the temperature rise to infer what happens to mean molecular kinetic energy.
- Use “constant volume” to comment on molecular separation/volume and therefore potential energy (and also note ).
- Conclude the change in internal energy.
Step-by-Step Reasoning
- Heating means energy is transferred to the gas (as thermal energy transfer).
- Since the temperature increases, the mean random kinetic energy of molecules increases (molecules move faster on average).
- At constant volume, the gas does not expand, so average separation/arrangement does not change significantly; for an ideal gas, intermolecular forces are negligible, so the intermolecular potential energy is taken as constant (or negligible).
- Therefore, the increase in internal energy is mainly (or entirely, for an ideal gas) due to the increase in random kinetic energy.
- You can also justify energetically: with , , so energy supplied as heating appears as an increase in .
Key Takeaways
- Higher (\Rightarrow) higher mean random molecular kinetic energy.
- Constant volume (\Rightarrow) no work done.
- For an ideal gas, internal energy depends only on temperature, so increases when increases.
Common Mistakes
- Saying potential energy increases because “molecules move apart” (but the volume is fixed).
- Forgetting to mention potential energy at all when the question explicitly asks for it.
- Confusing “heated” with “expands”: constant volume prevents expansion.
Things to Be Careful About
- Examiners often accept “potential energy unchanged/negligible (ideal gas)”; don’t claim it increases without a mechanism.
- Don’t write ; the work done is (or the area under a - graph).
Answer
Constant temperature → mean random molecular kinetic energy is constant.
Stretching within the elastic limit increases the separation of atoms/molecules so their intermolecular potential energy increases.
Therefore internal energy increases (increase in potential energy); the increase comes from work done on the wire (with heat transferred out to keep temperature constant).
Internal energy increases because molecular potential energy increases while mean kinetic energy stays constant at constant temperature.
Background Concept
In a solid wire, atoms are held together by interatomic forces. When you stretch it within its elastic limit, you do work on the wire and slightly increase the average separation of atoms. This stores energy as elastic (intermolecular) potential energy.
Temperature is linked to the mean random kinetic energy of particles. If the temperature is constant, the mean random kinetic energy stays constant.
The first law can be written (Cambridge sign convention):
where is energy transferred to the system by heating and is work done on the system.
Understanding the Question
The wire is stretched within its elastic limit at constant temperature. You must describe internal energy change in terms of:
- molecular kinetic energy (linked to temperature), and
- molecular potential energy (linked to interatomic separation).
Approach
- Use constant temperature to fix what happens to molecular kinetic energy.
- Use stretching (elastic deformation) to decide what happens to interatomic potential energy.
- Conclude the net change in internal energy and relate it to energy transfer (work done on the wire; heat must leave to keep constant).
Step-by-Step Reasoning
- Because the temperature is constant, the mean random kinetic energy of atoms in the wire does not change.
- Stretching the wire means you pull atoms slightly further apart from their equilibrium spacing.
- Increasing separation in an elastic solid increases the intermolecular (interatomic) potential energy (energy is stored in the strained bonds).
- Therefore the internal energy increases because its potential energy part increases while its kinetic energy part stays constant.
- Energy-transfer interpretation: you do positive work on the wire. If the wire’s temperature is held constant, any tendency for the wire to warm must be balanced by heat transfer out to the surroundings, so the net effect can still be an increase in mainly as stored elastic potential energy.
Key Takeaways
- Constant (\Rightarrow) constant mean random kinetic energy.
- Elastic stretching stores energy as increased intermolecular potential energy.
- Work done on a solid can increase internal energy even without a temperature rise.
Common Mistakes
- Saying internal energy stays constant because temperature is constant (only the kinetic part is fixed; potential energy can still change).
- Claiming kinetic energy increases while also claiming temperature is constant.
- Describing plastic deformation/yielding (outside elastic limit) which is not what is stated.
Things to Be Careful About
- Always tie kinetic energy statements explicitly to temperature.
- For “elastic limit”, the correct idea is reversible storage of energy in bonds (potential energy), not permanent deformation.
- Mentioning heat flow is subtle here: to maintain constant temperature during stretching, thermal energy may be transferred out; don’t claim the wire must heat up if temperature is specified constant.
A block of mass oscillates vertically on a spring, as shown in Fig. 4.1.
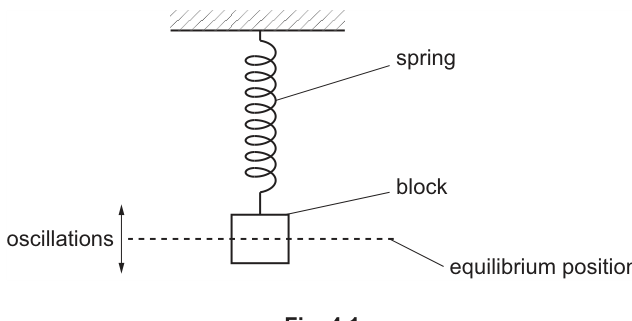
The acceleration of the block varies with displacement from its equilibrium position, as shown in Fig. 4.2.
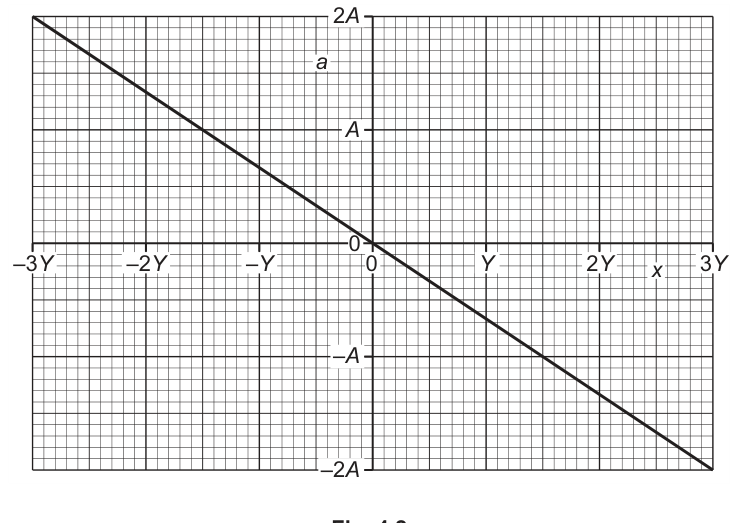
The amplitude of the oscillations is and the maximum acceleration is .
Answer
For SHM,
Fig. 4.2 is a straight line through the origin with negative gradient, so (acceleration is opposite in direction to displacement and proportional to it). Hence the motion is simple harmonic.
Fig. 4.2 shows a is proportional to −x (straight line through origin with negative gradient), so a = −ω²x and the motion is SHM.
Background Concept
In simple harmonic motion (SHM), the defining feature is that the acceleration is directly proportional to the displacement from equilibrium and is always directed towards the equilibrium position. Mathematically this is written as
where:
- is displacement from equilibrium (positive in a chosen direction),
- is acceleration,
- is the angular frequency (a constant for a given SHM system).
The minus sign is crucial: it means the acceleration is opposite in sign to the displacement (a “restoring” acceleration).
Understanding the Question
You are given a graph of acceleration against displacement for a block oscillating on a spring. The question asks you to explain how this graph tells you the oscillations are SHM.
So you must connect what the graph shows (its shape and whether it passes through the origin, and its gradient) to the SHM condition .
Approach
- Look for whether is proportional to : this corresponds to a straight line through the origin on an – graph.
- Check the sign: SHM requires a negative gradient so that and have opposite signs.
- State the conclusion in the standard SHM form .
Step-by-Step Reasoning
- The graph is a straight line, so is proportional to .
- It passes through , so when (at equilibrium), , consistent with SHM.
- The gradient is negative, so when , and when , . This means the acceleration is always towards equilibrium.
- Therefore the relationship must be of the form
for some constant . Comparing with the SHM equation , we identify and hence the motion is simple harmonic.
Key Takeaways
- SHM is identified by .
- On an – graph, SHM appears as a straight line through the origin with negative gradient.
Common Mistakes
- Saying “ is proportional to ” without mentioning the negative sign / restoring direction.
- Referring to a sinusoidal – graph (not given here) instead of using the provided – graph.
- Forgetting that passing through the origin matters (it shows equilibrium at ).
Things to Be Careful About
- The negative gradient is essential evidence of a restoring acceleration.
- Do not confuse an – graph with an – graph: SHM does not require acceleration to be linear in time, but it does require linear dependence on displacement.
Deduce expressions, in terms of some or all of , and , for:
Working
For SHM,
At maximum displacement , the magnitude of acceleration is :
Answer
ω = √(2A / 3Y)
Background Concept
In SHM, acceleration and displacement are related by
This means that on an – graph, the gradient is . Also, the maximum acceleration occurs at the extreme displacements where (the amplitude), because then is largest.
Understanding the Question
The graph tells you the amplitude is , so . It also states the maximum acceleration is , so .
You need an expression for in terms of and (and possibly , though it is not needed).
Approach
Use the magnitude form of the SHM relation at an extreme position:
Substitute and , then rearrange for .
Step-by-Step Reasoning
From SHM:
At the turning points, and . Using magnitudes avoids sign issues:
Given and :
Rearrange:
and hence
Key Takeaways
- For SHM, the gradient of the – graph equals .
- Using maximum values gives .
Common Mistakes
- Dropping the square root and writing .
- Mixing signs unnecessarily; using magnitudes at maxima is simplest.
- Confusing amplitude with peak-to-peak value (here amplitude is explicitly ).
Things to Be Careful About
- is positive; the minus sign is in the relationship , not in .
- Ensure you use amplitude (maximum displacement), not some intermediate displacement like or .
Working
For SHM,
with and :
Answer
v0 = √(6AY)
Background Concept
For SHM with displacement
the velocity is
The maximum speed occurs when (i.e. at equilibrium, ), giving
Understanding the Question
You are asked for the maximum speed in terms of , , and . From the stem:
- amplitude
- maximum acceleration
- from part (i),
Approach
Use the SHM relation and substitute the known expressions for and .
Step-by-Step Reasoning
Start with
Substitute :
Now substitute :
Simplify by combining factors under a square root:
So the maximum speed is
Key Takeaways
- In SHM, maximum speed occurs at equilibrium and equals .
- Combining results from earlier parts (here from the – graph) is common.
Common Mistakes
- Using (confusing with acceleration).
- Forgetting that the amplitude is .
- Algebra slip when simplifying the surd.
Things to Be Careful About
- must be positive; take the magnitude.
- Keep expressions in simplest surd form unless the question requests otherwise.
Working
Total energy of SHM:
with and :
Answer
E = 3mAY
Background Concept
In ideal SHM (no damping), the total mechanical energy is constant and equals the maximum kinetic energy (at equilibrium) and also equals the maximum potential energy (at the turning points). A standard expression is
where is the amplitude.
Equivalently, since ,
Both are valid and should give the same result.
Understanding the Question
You are given the SHM information via the – graph:
- amplitude
- maximum acceleration
From SHM, .
You must express the energy in terms of some or all of , , and .
Approach
Use
and substitute and , then simplify.
Step-by-Step Reasoning
Start with the SHM energy formula:
Use the result from the – graph:
and amplitude . Substitute:
Compute :
Simplify: , so
So,
(You could also use with to get .)
Key Takeaways
- Total SHM energy: .
- You can also use as a consistency check.
Common Mistakes
- Using but not relating correctly to (since ).
- Substituting instead of .
- Losing factors of 2 or 3 during simplification.
Things to Be Careful About
- Keep track that and here are scale values from the graph, not acceleration and displacement themselves.
- Energy must be positive; if a negative sign appears, it indicates an algebra/sign error.
The period of the oscillations is and the value of is .
Determine an expression for in terms of time , where is in and is in seconds.
= ______
Working
Amplitude .
Answer
( in , in .)
x = 1.8 sin(8.38 t) (x in cm, t in s)
Background Concept
A common way to represent SHM is
where:
- is amplitude,
- is angular frequency,
- is the phase constant (depends on where the mass is at ).
Angular frequency is related to the period by
If no starting position/phase information is given, an accepted expression usually sets and uses a sine (or cosine) form.
Understanding the Question
You are told:
- period ,
- amplitude is .
You must write in terms of time , with in cm and in seconds.
Approach
- Take amplitude directly: .
- Calculate from .
- Substitute into (choosing zero phase since no other condition is given).
Step-by-Step Reasoning
Amplitude:
Angular frequency:
Displacement-time equation (with ):
Because is in cm and is in s, the expression automatically gives in cm.
Key Takeaways
- Use to move between period and angular frequency.
- SHM displacement can be written as .
Common Mistakes
- Using instead of (confusing frequency with angular frequency ).
- Writing (putting where should be).
- Mixing units (e.g. converting 1.8 cm to 0.018 m when the question explicitly wants cm).
Things to Be Careful About
- must be in ; numerically it is larger than by a factor .
- Sine vs cosine: without initial conditions, either with an appropriate phase constant represents SHM; here a zero-phase form is used.
- Quote to a sensible number of significant figures (typically 3 s.f. from the given ).
Answer
Electric potential at a point is the work done per unit positive charge by an external agent in bringing a small test charge from infinity to that point (with no change in kinetic energy).
Work done per unit positive charge to bring a test charge from infinity to the point (no change in KE).
Background Concept
Electric potential is an energy-per-charge quantity. It is defined using a (very small) positive test charge so that it does not significantly disturb the existing electric field.
If a charge is moved slowly (so its kinetic energy does not change), the work done by an external agent changes the electric potential energy of the charge:
Electric potential is then
so that a change in potential corresponds to a change in potential energy per unit charge.
Understanding the Question
The question asks for the definition of electric potential at a point, so the marking points are typically:
- reference position (infinity),
- “work done per unit charge”,
- use of a positive (test) charge,
- moved slowly / no change in kinetic energy.
Approach
State the definition in one sentence: “work done per unit positive charge to bring a test charge from infinity to the point”, and include the standard condition “no change in kinetic energy” (or “moved slowly”).
Step-by-Step Reasoning
- Choose infinity as the zero/reference point for potential (as is standard for isolated charge distributions).
- Consider a small positive test charge brought from infinity to the point.
- Define the potential as the work done by an external agent per unit charge in doing so, with the test charge moved slowly so that energy transfer is not going into kinetic energy.
Key Takeaways
- Electric potential is work done per unit charge.
- The reference point is usually infinity for isolated charges.
- The definition assumes no change in kinetic energy (quasi-static move).
Common Mistakes
- Defining potential as “force per unit charge” (that is electric field strength ).
- Missing “per unit charge”.
- Not stating the reference point (infinity) for the definition.
Things to Be Careful About
- Use “work done by an external agent” (or equivalent wording) so the definition is unambiguous.
- It should be a “small test charge” so it does not disturb the field.
Two isolated charged metal spheres X and Y are near to each other in a vacuum. The centres of the spheres are apart, as shown in Fig. 5.1.
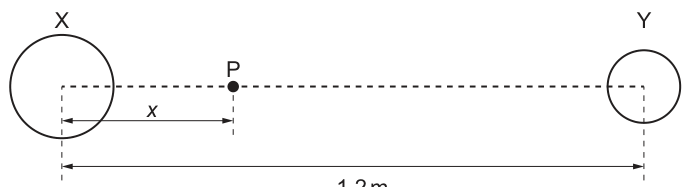
Point P is on the line joining the centres of spheres X and Y and is at a variable distance from the centre of X.
Fig. 5.2 shows the variation with of the total electric potential due to the two spheres.
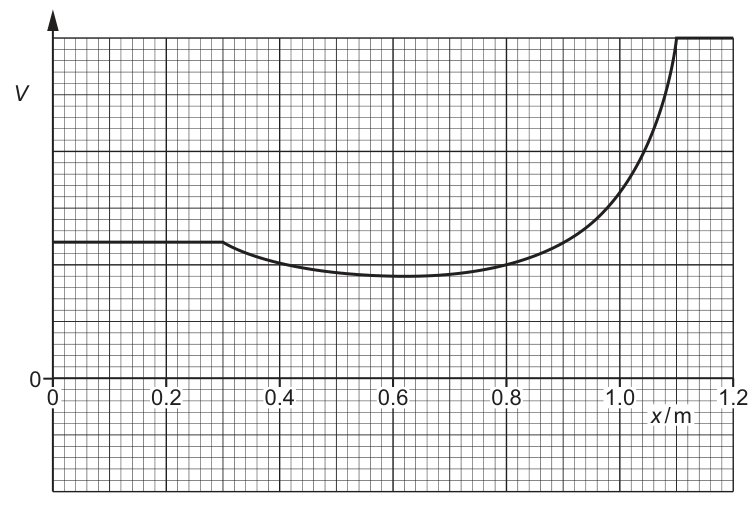
State three conclusions that may be drawn about the spheres from Fig. 5.2. The conclusions may be qualitative or quantitative.
Answer
Any three valid conclusions, e.g.
- is constant for , so the radius of sphere X is about (interior of a conductor is equipotential).
- has a minimum at , so the electric field is zero there (hence there is a point between the spheres where fields oppose), implying the spheres have charges of the same sign.
- The minimum is midway between the centres, so the charges on X and Y are equal in magnitude (by symmetry).
Radius of X ≈ 0.30 m; fields cancel at x = 0.60 m so charges are same sign; cancellation at midpoint implies |QX| = |QY|.
Background Concept
For an isolated charged conducting sphere:
- the electric potential is the same everywhere inside the metal and inside the cavity (equipotential),
- outside the sphere it behaves like a point charge at its centre for potential calculations:
Along a line, the total potential is the algebraic sum of the potentials due to each charge.
A key link between potential and field is:
So:
- where the graph of against is flat, and the field component is zero,
- where has a maximum or minimum, the slope is zero so the electric field is zero at that point.
Understanding the Question
You are shown a graph of the total electric potential at points between the sphere centres, as the distance from the centre of sphere X changes.
You must extract three conclusions about the spheres (charge sign/magnitude, radii, etc.) using features of the graph:
- a constant region,
- a turning point (minimum),
- the behaviour close to each sphere.
Approach
Look for three separate graph features and link each to a physical meaning:
- Flat (constant ) section (\Rightarrow) inside a conducting sphere (\Rightarrow) its radius.
- Minimum/maximum in (\Rightarrow) there (\Rightarrow) field cancellation point.
- Where that cancellation point lies (midpoint or closer to one sphere) (\Rightarrow) comparison of charge magnitudes.
Step-by-Step Reasoning
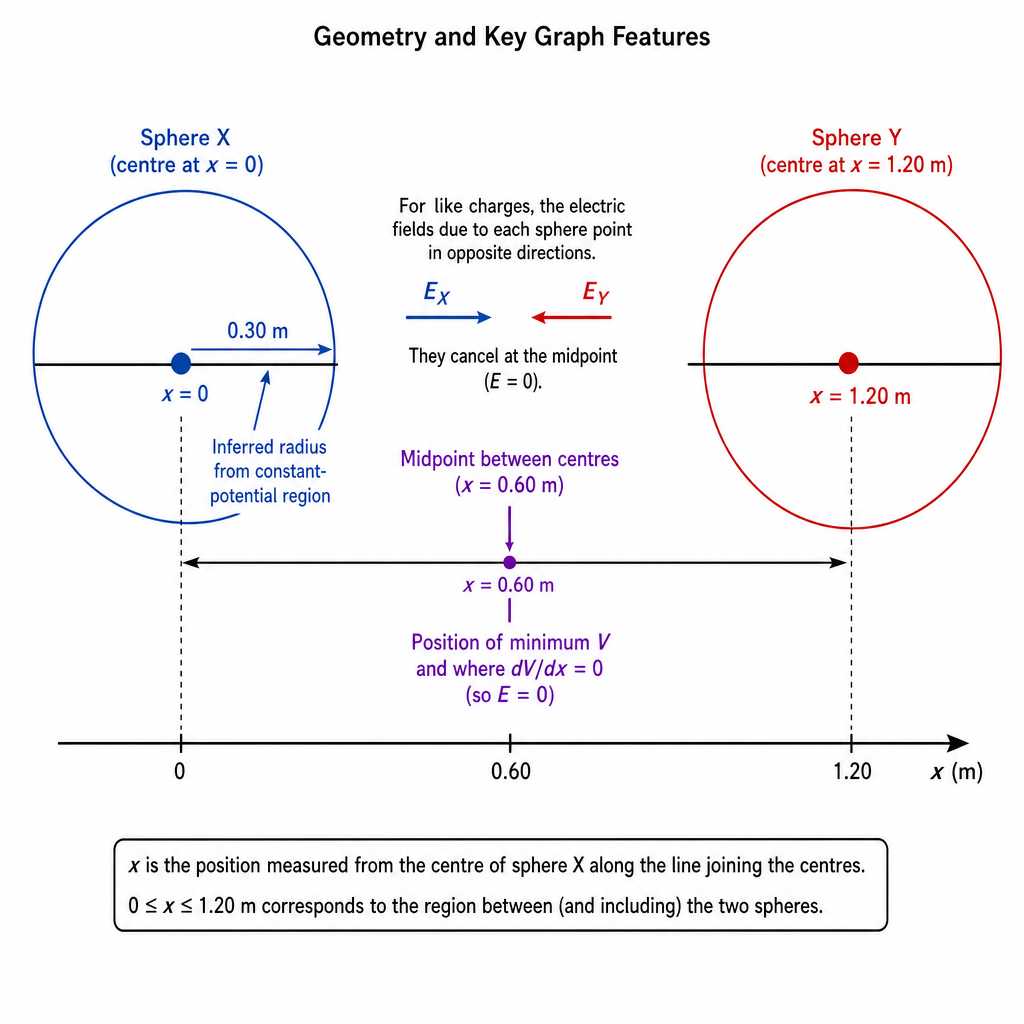
-
Constant potential near X: From up to about , is constant. This is the signature of being inside a conductor, because conductors in electrostatic equilibrium are equipotential.
- Therefore, the surface of sphere X is at about .
- So the radius of X is .
-
Minimum at : At the minimum, the slope is zero, so
So there is a point between the spheres where the resultant electric field is zero.
-
Charge signs: A field-cancellation point between two charges on the line joining them occurs for like charges (fields oppose between them). For unlike charges, the fields between them point the same way and cannot cancel between the charges.
- Hence, the spheres have charges of the same sign.
-
Charge magnitudes from the position of cancellation: The cancellation point is exactly at the midpoint ( is half of ). If the charges were unequal, the zero-field point would be closer to the smaller-magnitude charge.
- Since it is at the midpoint, this indicates the charges are equal in magnitude: .
These are three distinct conclusions (radius, sign, magnitude comparison).
Key Takeaways
- A flat region indicates an equipotential region (inside a conductor), allowing a radius to be read.
- Turning points in correspond to because .
- A zero-field point between two charges implies like charges; its position tells you the ratio of magnitudes.
Common Mistakes
- Saying “ at the minimum so ”: comes from zero gradient, not from the value of .
- Claiming opposite charges because “there is a minimum”: unlike charges do not give a cancellation point between them on the joining line.
- Reading the radius from the wrong end of the flat region (it is the end of the constant section).
Things to Be Careful About
- Distinguish “potential is zero” from “potential has zero slope”. Only the latter implies .
- The graph is of total potential due to both spheres, so the constant region near X is still constant even though Y contributes, because Y’s contribution is (approximately) constant throughout the interior of X.
A proton is held at rest on the line joining the centres of the spheres in (b) at the position where .
The proton is released.
Describe and explain, without calculation, the subsequent motion of the proton.
Answer
At , is a minimum so and hence .
Therefore the proton experiences no force and (if exactly at ) remains at rest.
Because it is at a minimum of , this is a stable equilibrium: a small displacement gives a force back towards .
Remains at rest at x = 0.60 m (E = 0); equilibrium is stable, so small displacement gives restoring motion back toward x = 0.60 m.
Background Concept
A charged particle in an electric field experiences a force
The electric field along a line can be obtained from the electric potential by
For a positive charge ():
- if the slope is negative, then is positive and the force is in the direction,
- if the slope is positive, then is negative and the force is in the direction.
Potential energy is
So for a proton (positive ), a minimum in is also a minimum in , which corresponds to stable equilibrium.
Understanding the Question
The proton is initially held at rest at , which (from the graph in part (b)) is the position of the minimum of the total potential . You must describe what happens after release and explain it without calculation.
So you need to connect:
- “minimum on graph” (\Rightarrow) “zero slope” (\Rightarrow) “” (\Rightarrow) “no force”,
and then comment on stability.
Approach
- Use at to decide the force at the release point.
- Use whether the point is a minimum or maximum of to decide stable vs unstable equilibrium.
- Describe the motion in words: remains at rest if exactly at equilibrium; otherwise accelerates back toward equilibrium.
Step-by-Step Reasoning
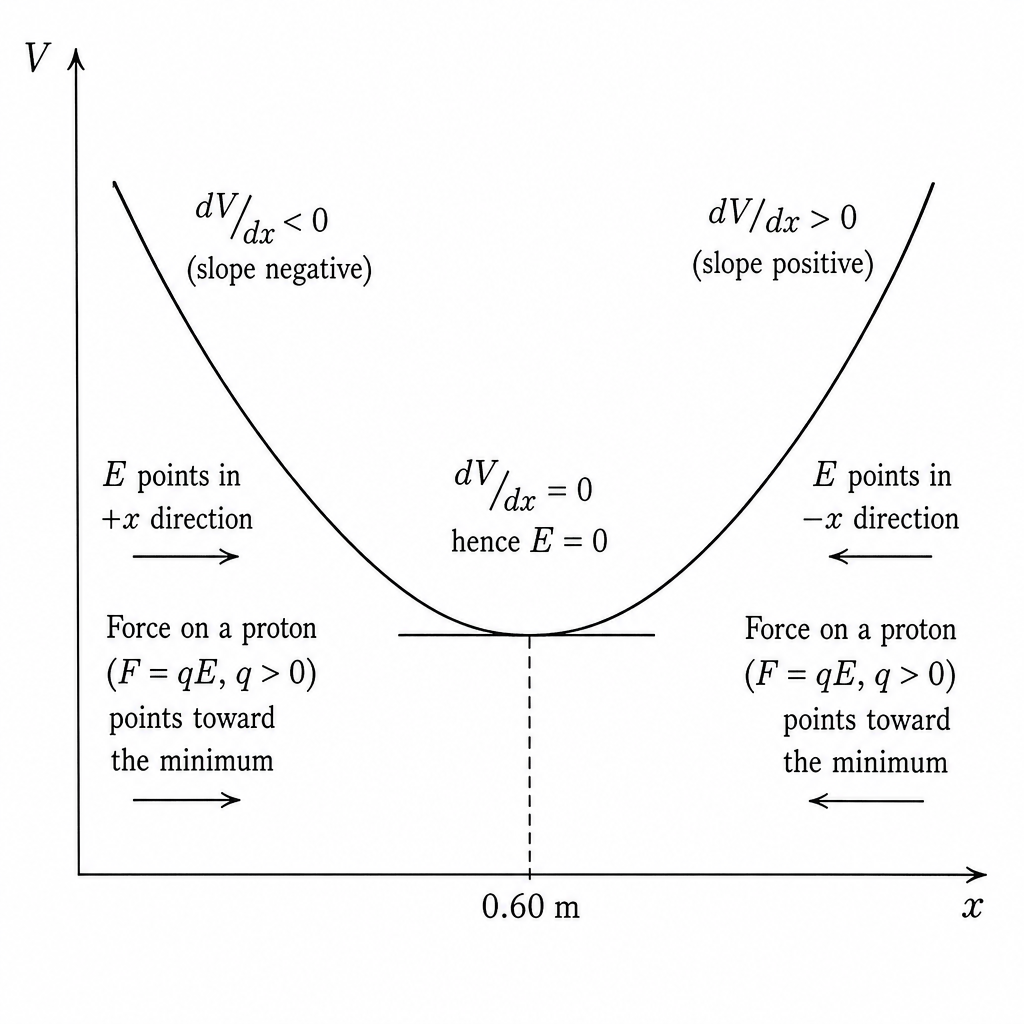
- At the graph of against has a minimum, so the tangent there is horizontal.
- Therefore
so the proton experiences
Hence, on release from rest, it has no initial acceleration and stays where it is (provided it is exactly at ).
- Stability: because the point is a minimum of , a small displacement to either side produces a slope:
- slightly left of , the graph slopes downwards toward the minimum () so and the force on the proton is toward increasing (back toward ),
- slightly right of , so and the force is toward decreasing (again back toward ).
So it is stable equilibrium: any small disturbance would make it move back toward (and it may oscillate about that point).
Key Takeaways
- : the slope of a potential graph tells you field direction and hence force direction.
- A turning point in means (equilibrium point).
- For a positive charge, a minimum of means stable equilibrium.
Common Mistakes
- Saying the proton moves toward “higher potential” or “lower potential” without using the sign of the charge: the direction depends on .
- Using “ so ”: it is the gradient that matters, not whether equals zero.
- Claiming it will accelerate away from the minimum: that would correspond to an unstable equilibrium (a maximum in for a positive charge).
Things to Be Careful About
- The question says “held at rest” and “released”: if the force is zero at the release point, it will remain at rest.
- Real-life small disturbances mean you often discuss what happens if it is slightly displaced; exam answers typically mention stable equilibrium for full explanation.
Two capacitors X and Y are connected in series to a power supply of voltage , as shown in Fig. 6.1.
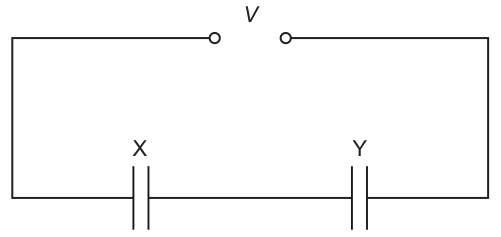
The capacitance of X is and the capacitance of Y is .
Derive an expression, in terms of and , for the combined capacitance of the capacitors in this circuit.
Explain your reasoning.
Working
In series, the charge on each capacitor is the same, .
and
So
For the combined capacitor , , hence
Answer
CT = (CX CY) / (CX + CY)
Background Concept
For a capacitor,
so the potential difference across a capacitor is
When capacitors are connected in series:
- the same current must flow through each component while charging,
- so each capacitor ends up with the same magnitude of charge on its plates,
- and the total supply voltage equals the sum of the potential differences across each capacitor.
Understanding the Question
Two capacitors and are in series across a supply of voltage . You are asked to derive the equivalent (combined) capacitance in terms of and .
This is not a “plug numbers” task: you must show the series rules (same charge, voltages add) and use to build the expression.
Approach
- Let the common charge on each capacitor be .
- Write the voltage across each capacitor using .
- Add the voltages (because series) to get the supply voltage .
- Use the definition of equivalent capacitance: .
- Rearrange to solve for .
Step-by-Step Reasoning
Because the capacitors are in series, each stores the same charge .
Voltage across :
Voltage across :
The supply voltage is the sum:
Define the equivalent capacitance as the single capacitor that would take the same charge for the same total voltage :
Equate the two expressions for :
Cancel (valid provided ; even if the formula still holds by continuity):
Invert to get:
This result also makes physical sense: is smaller than either individual capacitance in series.
Key Takeaways
- In series: same charge on each capacitor, voltages add.
- Use to connect series rules to capacitance.
- Series formula:
Common Mistakes
- Assuming voltages are the same in series (that is the rule for parallel, not series).
- Adding capacitances directly for series (again, that is for parallel).
- Forgetting to state the key reason: same charge on each capacitor.
Things to Be Careful About
- Keep the distinction clear:
- series: same, splits;
- parallel: same, adds.
- Algebra: after obtaining , remember to invert correctly to reach the final expression.
Two capacitors P and Q are connected in parallel to a power supply of voltage .
The capacitance of P is . The capacitance of Q can be varied between and .
When , the total energy stored in the capacitors is .
Working
When , only capacitor stores energy.
Answer
5.0 V
Background Concept
The energy stored in a capacitor is
where is the capacitance and is the potential difference across the capacitor.
For capacitors in parallel, each capacitor is directly across the supply, so each has the same voltage as the supply voltage.
Understanding the Question
Capacitors and are in parallel across a supply . You are told:
- ,
- can be varied,
- when , the total stored energy is .
If , capacitor is effectively absent, so the only energy stored is in . Use this to find .
Approach
- Use for capacitor .
- Convert to farads and to joules.
- Rearrange to solve for .
Step-by-Step Reasoning
With , the energy is
Convert units:
Substitute:
Compute the coefficient:
So
Key Takeaways
- Energy in a capacitor: .
- In parallel, each capacitor has the full supply voltage.
- Always convert prefixes correctly: , .
Common Mistakes
- Using without knowing (you can, but then you must find anyway).
- Forgetting the unit conversions, giving a voltage off by factors of or .
- Treating the capacitors as series instead of parallel.
Things to Be Careful About
- The voltage across equals the supply voltage only because the connection is parallel.
- Quote the final voltage to the precision suggested: (2 s.f.).
Calculate the total energy, in , stored in the capacitors when has its maximum value.
total energy = ______
Working
In parallel,
Using ,
Answer
7.5 mJ
Background Concept
For capacitors in parallel:
- the potential difference across each is the same (),
- the total charge stored is the sum of the charges,
- so the equivalent capacitance is the sum:
Energy stored by a capacitor (or equivalent capacitance) across voltage :
Understanding the Question
You have two capacitors in parallel:
- ,
- varies up to ,
- supply voltage already found as .
You must find the total energy stored when is maximum.
Approach
- Find total capacitance in parallel: .
- Use with .
- Convert the final answer to mJ.
Step-by-Step Reasoning
At maximum, , so
Convert:
Now calculate energy:
Since ,
Convert to mJ:
Key Takeaways
- Parallel capacitors add: .
- Once you know the supply voltage, total energy can be found from .
Common Mistakes
- Using the series formula for capacitance instead of adding directly.
- Forgetting to convert to F, leading to an answer too large by .
- Reporting energy in J when the question requests mJ.
Things to Be Careful About
- The voltage remains regardless of because the supply voltage is fixed.
- Keep consistent significant figures; matches the given data precision.
On Fig. 6.2, sketch the variation of the total energy stored in the capacitors with , as varies from to .
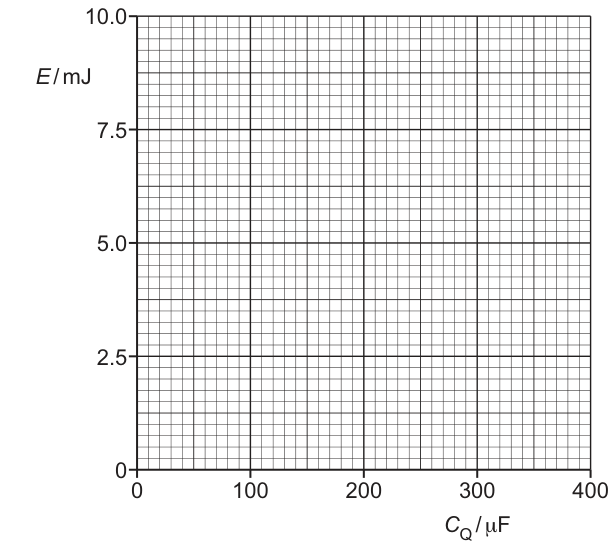
Working
For parallel capacitors,
and
So varies linearly with .
At , .
At , .
Answer
Sketch a straight line increasing from to .
Straight line from (0, 2.5 mJ) to (400 µF, 7.5 mJ)
Background Concept
For a fixed supply voltage , the energy stored in a capacitor is
For capacitors in parallel, the equivalent capacitance is
So with constant,
which is of the form (a straight-line relationship).
Understanding the Question
You must sketch a graph of total energy (in mJ) against (in ) as goes from to .
You already know two key points from earlier parts:
- at , ,
- at , .
The shape depends on how depends on .
Approach
- Write in terms of using .
- Recognise this is linear in (because and are constants).
- Plot/mark the endpoints and draw a straight line between them.
Step-by-Step Reasoning
Start with the parallel combination:
Energy stored:
Here is constant and is constant (the supply is fixed at ), so the only variable is . Therefore increases in direct proportion to (straight line).
Find two points to define the line:
- When , (given).
- When , (from part (ii)).
So on the provided axes you mark these and draw a straight line joining them.
Key Takeaways
- With a constant supply voltage, energy is proportional to capacitance: .
- For a variable capacitor in parallel, vs is linear with a non-zero intercept (because is always present).
Common Mistakes
- Drawing a curve (e.g. quadratic) because of the term: is constant here, so is just a constant factor.
- Forcing the graph through the origin: at there is still capacitor , so .
- Using the wrong endpoint energy (e.g. using because it is the top of the axis rather than the calculated value).
Things to Be Careful About
- Axes: ensure runs from to and is in mJ.
- Your line should pass exactly through and on the given scale.
- Keep the sketch as a single straight best line; do not add extra segments or curvature.
Answer
Faraday’s law: the induced e.m.f. is equal to the negative rate of change of magnetic flux linkage.
The induced e.m.f. equals the negative rate of change of flux linkage: (\mathcal{E} = -\mathrm{d}(N\Phi)/\mathrm{d}t).
Background Concept
Electromagnetic induction occurs when the magnetic flux through a circuit changes. For a coil of turns, the quantity that matters is the flux linkage , where:
- is the magnetic flux through one turn (in Wb),
- is in Wb-turn,
- the induced e.m.f. is in V.
Faraday’s law links the induced e.m.f. to how fast changes:
The negative sign is Lenz’s law: the induced e.m.f. drives a current whose magnetic effect opposes the change causing it.
Understanding the Question
You are asked to state Faraday’s law (2 marks). This typically needs both:
- a correct verbal statement, and
- the correct mathematical form.
Approach
Give the standard statement and equation. Make sure to include:
- flux linkage (not just ),
- the rate of change with respect to time,
- the negative sign.
Step-by-Step Reasoning
- Identify the relevant physical quantity changing: magnetic flux linkage .
- State that the induced e.m.f. equals the rate of change of this quantity.
- Include the negative sign to indicate opposition to the change.
Key Takeaways
- Induced e.m.f. depends on how fast flux linkage changes.
- Use for coils.
- The negative sign represents Lenz’s law.
Common Mistakes
- Writing (missing minus sign).
- Using without mentioning flux linkage for a coil.
- Confusing flux with flux density .
Things to Be Careful About
- The derivative is with respect to time ().
- Flux linkage is ; flux through one turn is (used in later parts).
Fig. 7.1 shows a coil at rest in a uniform magnetic field that is parallel to the axis of the coil.
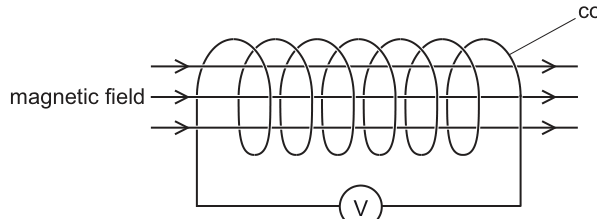
The coil is connected to a centre-zero voltmeter.
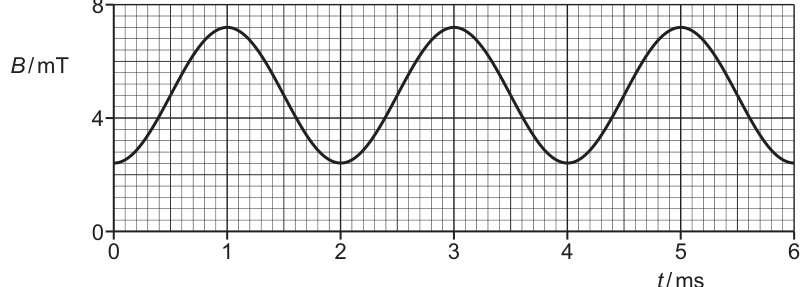
The flux density of the uniform magnetic field varies with time as shown in Fig. 7.2.
The coil consists of turns, each of cross-sectional area .
Calculate the maximum magnetic flux through one turn of the coil.
maximum magnetic flux = ______
Working
Maximum flux density from the graph: .
Field is parallel to coil axis so :
Answer
1.9 × 10⁻⁶ Wb
Background Concept
Magnetic flux through a loop is
where:
- is magnetic flux density (T),
- is the area of the loop (m),
- is the angle between and the normal to the coil’s plane.
If the magnetic field is along the coil’s axis, it is along the normal to the coil, so and .
Understanding the Question
You are given:
- maximum from the graph (in mT),
- cross-sectional area of each turn .
You must find the maximum flux through one turn (so do not multiply by in this part).
Approach
- Read from the graph.
- Convert mT to T.
- Use (since the field is parallel to the coil axis).
Step-by-Step Reasoning
- From the sinusoidal graph, reaches a maximum of .
- Convert: .
- Use :
Key Takeaways
- Flux is .
- Convert mT to T before calculating.
- “One turn” means do not multiply by .
Common Mistakes
- Using turns here (that is for flux linkage in later parts).
- Leaving in mT, giving an answer too large by a factor .
- Using (mixing up flux and flux linkage).
Things to Be Careful About
- The direction information (“field parallel to axis”) is the cue that .
- Quote the final value to 2 s.f. if not specified, consistent with given data.
Determine the maximum rate of change of magnetic flux linkage in the coil.
maximum rate of change of flux linkage = ______
Working
Amplitude of flux density variation:
Period from graph: , so
Flux linkage (field along axis). Maximum rate of change:
Answer
0.68 Wb s⁻¹
Background Concept
For a coil in a magnetic field, the flux linkage is
Here , so . The induced e.m.f. depends on the rate of change of this quantity:
If varies sinusoidally with angular frequency , e.g.
then
so the maximum rate of change is
Understanding the Question
You are given:
- turns,
- ,
- a sinusoidal graph of vs with max and min , period .
You need the maximum rate of change of flux linkage, i.e. the maximum of .
Approach
- From the graph, find the amplitude and the period .
- Convert to seconds and find .
- Use
Step-by-Step Reasoning
- The magnetic field oscillates between and .
- Mean value is .
- Amplitude is half the peak-to-peak:
- Period from the graph is .
- Since ,
and the maximum value is
Substitute:
Key Takeaways
- Only the changing part of contributes to induced e.m.f.; constants vanish when differentiating.
- For sinusoids, maximum rate of change is amplitude .
- Always convert ms to s.
Common Mistakes
- Using instead of the amplitude (gives an answer too large).
- Taking (confusing time to peak with full period).
- Forgetting when asked for flux linkage.
Things to Be Careful About
- Units: and .
- is in ; using is fine if you then use .
Working
From Faraday’s law,
Using (ii): .
Answer
0.68 V
Background Concept
Faraday’s law gives the induced e.m.f.
The maximum e.m.f. magnitude (peak value) is therefore
Also, .
Understanding the Question
You have already found in (ii) the maximum rate of change of flux linkage in . This part asks for the corresponding maximum induced e.m.f. .
Approach
Take the magnitude of Faraday’s law: peak e.m.f. equals peak rate of change of flux linkage.
Step-by-Step Reasoning
- From (ii),
- Therefore,
Key Takeaways
- Peak induced e.m.f. equals peak rate of change of flux linkage.
- Unit conversion is automatic: is the volt.
Common Mistakes
- Including a minus sign in the numerical peak value (the peak is usually quoted as a magnitude).
- Using instead of .
Things to Be Careful About
- If asked for the instantaneous e.m.f., sign matters; for (maximum), magnitude is sufficient unless explicitly asked otherwise.
On Fig. 7.3, sketch the variation of the e.m.f. induced across the coil with from to .
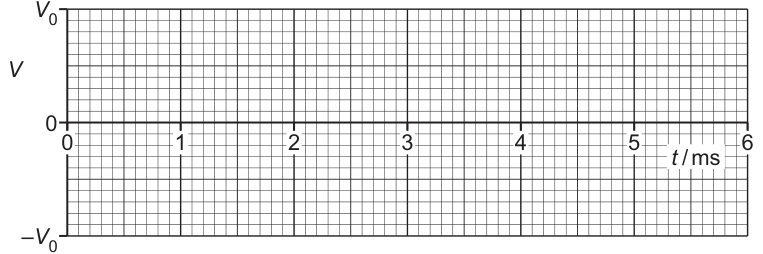
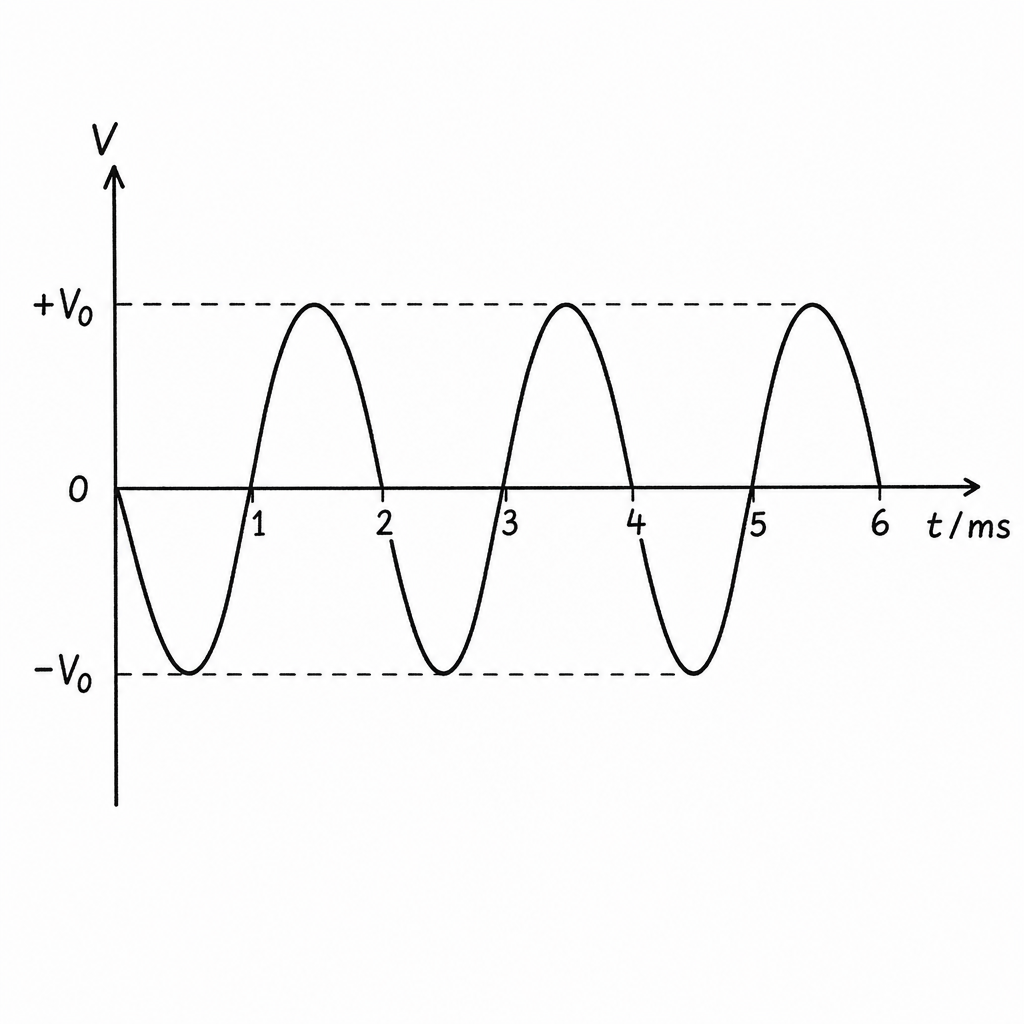
Answer
is sinusoidal with period and amplitude .
Key points (one acceptable phase):
- :
- :
- :
Sinusoidal V–t graph of amplitude V0 and period 2.0 ms (three cycles from 0 to 6 ms), with V = 0 at t = 0, 1, 2, 3, 4, 5, 6 ms.
Background Concept
The induced e.m.f. is related to magnetic flux linkage by Faraday’s law:
With (here and are constant), this becomes
So the – graph is the negative derivative of the – graph.
For a sinusoid, the derivative is also sinusoidal with the same period, but shifted by (a quarter of a cycle).
Understanding the Question
You are shown a sinusoidal variation of with time, with a period of . You must sketch the induced e.m.f. from to (three complete cycles). The vertical scale is labelled , , .
Approach
- Use that has the same period as (differentiation doesn’t change period).
- Use turning points of :
- when is maximum or minimum, slope is zero, so .
- Use steepest parts of :
- when crosses its mean value, slope magnitude is largest, so is maximum ().
- Choose the sign based on whether is increasing or decreasing (minus sign in Faraday’s law).
Step-by-Step Reasoning
From the graph description:
- has a minimum at and a maximum at ; therefore is increasing between and .
- At a minimum or maximum, , hence at .
Between and , the steepest point is halfway at , so is maximum there.
Because :
- When is increasing (), is negative.
So at , .
Similarly, from to , is decreasing, so and therefore is positive, giving at .
This repeats every , so you draw three identical cycles up to .
Key Takeaways
- Induced e.m.f. is proportional to the rate of change of flux (or here).
- For sinusoids, the induced e.m.f. is sinusoidal with a phase shift.
- Peaks of happen when has its steepest slope.
Common Mistakes
- Drawing in phase with (wrong: is related to the derivative).
- Putting maxima of at the maxima of (should be zero there).
- Using the wrong period (must be , so 3 cycles in 6 ms).
Things to Be Careful About
- The overall sign (whether the first peak is + or −) depends on the chosen voltmeter polarity; examiners often allow either if the phase relationship is correct and consistent.
- Make sure the sketch reaches and crosses zero at the correct times.
The variation of with can be described by
where and are constants.
Determine the values of and . Give units with your answers.
= ______ unit ______
= ______ unit ______
Working
From (iii), amplitude .
Period :
Answer
A = 0.68 V, B = 3.14 × 10^3 rad s⁻¹
Background Concept
A sinusoidal quantity can be written as
where:
- is the amplitude (peak value),
- is the angular frequency .
Angular frequency and period are related by
The argument of the sine must be dimensionless, so if is in seconds, must have units of (often written as ).
Understanding the Question
You have already found the peak e.m.f. and the period from the – graph. The induced e.m.f. is sinusoidal, so you can match it to .
Approach
- Set equal to the maximum e.m.f. magnitude .
- Use the period (from the graph) to find .
Step-by-Step Reasoning
- Amplitude: from part (iii),
- Period: the magnetic flux density has period , and the induced e.m.f. has the same period.
So
Key Takeaways
- In , is the peak voltage and is the angular frequency.
- Use with in seconds.
Common Mistakes
- Using instead of (that gives frequency, not angular frequency).
- Leaving in ms, giving too small by a factor of .
- Confusing amplitude of with amplitude of .
Things to Be Careful About
- The sign of depends on the phase choice/polarity in the sketch. If your sketched wave starts negative just after , then an equivalent expression is ; many schemes accept either provided the waveform is consistent.
- Quote appropriate significant figures (typically 2–3 s.f.).
Fig. 8.1 shows part of the emission spectrum of visible radiation emitted by hydrogen gas in a star in a distant galaxy.
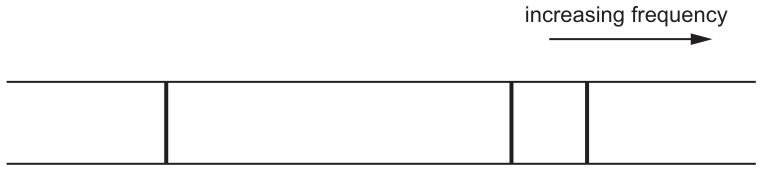
The galaxy is moving away from the Earth at a speed of .
Explain how the positions of the lines in the emission spectrum seen by an observer on the Earth differ from the positions shown in Fig. 8.1.
Answer
The galaxy is moving away, so the spectral lines are red-shifted.
Observed frequency is lower (so the lines shift towards lower frequency, i.e. to the left on Fig. 8.1) and the observed wavelength is greater.
Lines shift to lower frequency (left on the diagram); wavelength increases (redshift).
Background Concept
When a source of waves moves relative to an observer, the observed wavelength and frequency change (Doppler effect). For light from a receding astronomical object, the light is redshifted:
- observed wavelength increases: (\lambda_{\text{obs}} > \lambda_{\text{emit}})
- observed frequency decreases: (f_{\text{obs}} < f_{\text{emit}})
For speeds much smaller than (c), the fractional change is approximately:
and similarly
Understanding the Question
Fig. 8.1 shows three emission lines from hydrogen as they are emitted by the star in the distant galaxy. The arrow on the spectrum shows frequency increases to the right. The galaxy is moving away from Earth, so the observer on Earth will detect these same lines shifted.
You are asked to explain how the positions of the observed lines differ from those shown.
Approach
- Use the fact that recession causes redshift.
- Translate “redshift” into what happens to frequency and therefore where the lines move on a frequency axis.
Step-by-Step Reasoning
- Recession means successive wavefronts are “stretched out” by the motion, so the observer measures a longer wavelength.
- Since (c = f\lambda) for light in vacuum, if (\lambda) increases then (f) must decrease.
- On the diagram, frequency increases to the right, so lower frequency corresponds to a shift left.
Therefore all three lines move left (towards the red end / lower frequency end).
Key Takeaways
- Moving away (\Rightarrow) redshift (\Rightarrow) (\lambda) increases and (f) decreases.
- Always use the axis direction (here: increasing frequency to the right) to state the shift direction correctly.
Common Mistakes
- Saying the lines shift to higher frequency when the source is moving away.
- Confusing a wavelength axis with a frequency axis: on a wavelength axis, redshift would be a shift to the right (to larger (\lambda)), but here the axis is frequency.
Things to Be Careful About
- The question is about positions of lines on Fig. 8.1; because the axis is frequency, “redshift” means left (lower frequency), not right.
On Fig. 8.1, draw the three lines in possible positions in the spectrum seen by the observer.
Answer
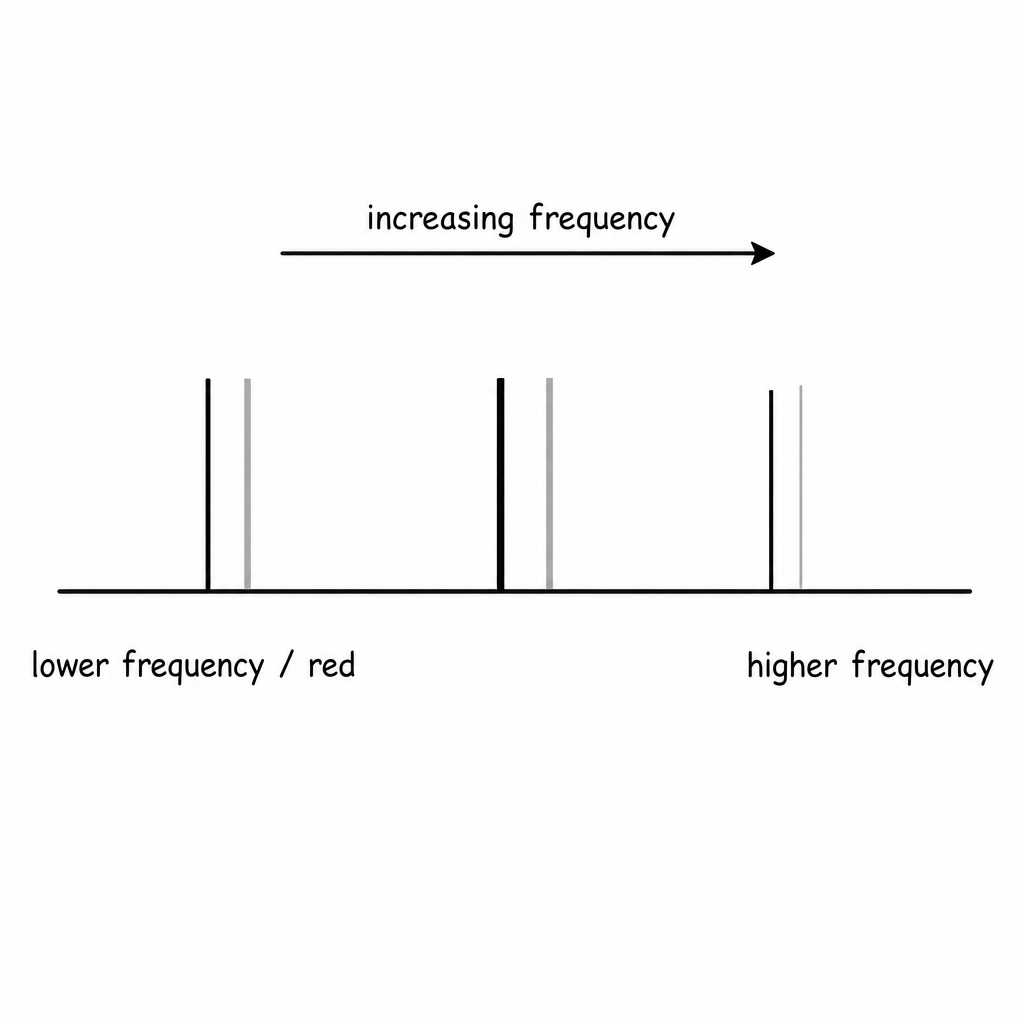
All three lines are drawn to the left of the original lines (lower frequency), with the same order of the three lines.
Three lines shifted left (to lower frequency).
Background Concept
An emission spectrum consists of discrete lines at particular frequencies (or wavelengths) corresponding to electron transitions. If the source is moving away, every emitted frequency is observed reduced by the same fraction (for (v \ll c)), so the entire pattern shifts together.
Understanding the Question
You are not calculating an exact amount of shift; you are sketching possible positions seen from Earth. Fig. 8.1 is labelled so that frequency increases to the right.
Approach
- Decide the shift direction: recession (\Rightarrow) lower observed frequency.
- Draw each of the three lines displaced leftwards relative to its original position, keeping the same relative ordering.
Step-by-Step Reasoning
- Since the galaxy is moving away, the observed spectrum is redshifted.
- On a frequency axis, redshift means smaller (f).
- Therefore, each line should be moved left.
- Because the fractional change is (approximately) the same for all lines, the pattern should look the same, just shifted to lower frequency.
Key Takeaways
- Always check whether the spectrum axis is frequency or wavelength.
- Redshift: (f\downarrow), (\lambda\uparrow).
Common Mistakes
- Shifting to the right because you associate “red” with the right-hand side without checking the axis label.
- Re-ordering the lines (the transitions remain the same, so the order must not swap).
Things to Be Careful About
- The question says “possible positions”: the shift should be small (since (v/c\approx 0.02)), not a huge displacement across the whole diagram.
The lines in Fig. 8.1 correspond to electron transitions down to the energy level .
One of the lines represents emitted radiation of wavelength .
Working
Answer
(4.08 \times 10^{-19}\ \text{J})
4.08 × 10^−19 J
Background Concept
Light is quantised into photons. The energy of one photon is related to its frequency (f) by
and since electromagnetic waves satisfy (c = f\lambda), we can combine these to get
where:
- (h) is Planck’s constant,
- (c) is the speed of light in vacuum,
- (\lambda) is the wavelength.
Understanding the Question
The emitted wavelength is (488\ \text{nm}). You are asked for the photon energy in joules.
Approach
Use (E = hc/\lambda). Convert (\lambda) from nm to m, then substitute numerical values.
Step-by-Step Reasoning
- Convert wavelength:
- Substitute into (E = hc/\lambda):
- Evaluate:
- (hc \approx 1.99 \times 10^{-25}\ \text{J m})
- Divide by (4.88 \times 10^{-7}\ \text{m}):
Key Takeaways
- For photon energy from wavelength, (E = hc/\lambda) is usually the quickest route.
- Always convert nm to m before substituting.
Common Mistakes
- Forgetting (\times 10^{-9}) when converting nm to m.
- Using (E = h\lambda) (incorrect).
Things to Be Careful About
- Significant figures: the wavelength is given to 3 s.f., so quoting (E) to 3 s.f. is appropriate.
- Keep units consistent: using SI units ensures (E) comes out in joules.
Determine the energy, in , of the energy level from which the electron transition originates to cause the emission of this radiation.
energy level = ______
Working
Photon energy from (i): (E = 4.08 \times 10^{-19}\ \text{J}).
For emission:
with (E_{\text{final}} = -3.40\ \text{eV}):
Answer
(-0.85\ \text{eV})
−0.85 eV
Background Concept
In an atom, electrons occupy discrete energy levels. When an electron drops from a higher level (less negative energy) to a lower level (more negative energy), a photon is emitted.
Energy conservation gives:
Key points:
- Bound-state energy levels for hydrogen are negative.
- The emitted photon energy is the difference between the initial and final energy levels.
Also, the electronvolt is a convenient energy unit:
Understanding the Question
All the lines shown correspond to transitions down to (-3.40\ \text{eV}) (this is the final level). For the particular line with (\lambda = 488\ \text{nm}), you have already found the photon energy in joules in part (i). Now you must find the starting (initial) energy level in eV.
Approach
- Convert the photon energy from J to eV.
- Use (E_{\text{initial}} = E_{\gamma} + E_{\text{final}}), being careful with the negative sign of (E_{\text{final}}).
Step-by-Step Reasoning
- Convert to eV:
- Apply the transition energy equation:
- Final level: (E_{\text{final}} = -3.40\ \text{eV})
- Emission: (E_{\gamma} = E_{\text{initial}} - E_{\text{final}})
Rearrange:
Substitute:
This makes sense physically: (-0.85\ \text{eV}) is higher than (-3.40\ \text{eV}) (less negative), so the electron can drop down and emit energy.
Key Takeaways
- Emitted photon energy equals the difference between initial and final energy levels.
- Keep track of signs: hydrogen energy levels are negative.
Common Mistakes
- Using (E_{\text{initial}} = E_{\text{final}} - E_{\gamma}) (wrong sign for emission).
- Forgetting to convert J to eV before combining with energy levels in eV.
Things to Be Careful About
- A higher energy level in hydrogen is less negative, not “more negative”.
- Write the energy difference equation explicitly to avoid sign errors.
Determine the wavelength, in , of this radiation as detected by the observer on the Earth.
wavelength = ______
Working
For recession ((v \ll c)):
Answer
(498\ \text{nm})
498 nm
Background Concept
For light from a moving source, the observed wavelength changes due to the Doppler effect. For speeds much smaller than the speed of light, the redshift (recession) approximation is:
which is equivalent to:
A receding source gives a larger observed wavelength.
Understanding the Question
The emitted wavelength is (488\ \text{nm}). The galaxy is moving away at (6.2 \times 10^6\ \text{m s}^{-1}). You must calculate the wavelength detected on Earth.
Approach
- Compute (v/c).
- Multiply the emitted wavelength by (1 + v/c) to get the observed wavelength.
Step-by-Step Reasoning
- Find the fractional speed:
- Apply the redshift approximation:
The wavelength increases, consistent with redshift.
Key Takeaways
- Recession (\Rightarrow) (\lambda) increases by approximately a fraction (v/c).
- Check that the final wavelength is larger than the emitted wavelength.
Common Mistakes
- Using (1 - v/c) for a receding source (this would be for approaching / blueshift).
- Mixing up frequency and wavelength shifts (frequency decreases when wavelength increases).
Things to Be Careful About
- Ensure (v \ll c) to justify the approximation; here (v/c \approx 0.021), so it is reasonable.
- Quote the answer to appropriate significant figures (here (498\ \text{nm}) to 3 s.f.).
A value for the Hubble constant is .
Determine the distance of the galaxy from the Earth.
distance = ______
Working
Hubble law:
Answer
(2.7 \times 10^{24}\ \text{m})
2.7 × 10^24 m
Background Concept
Hubble’s law relates the recessional speed (v) of a galaxy to its distance (d) from the observer:
where (H_0) is the Hubble constant. In this question (H_0) is given in (\text{s}^{-1}), which is consistent because (v) is in (\text{m s}^{-1}) and (d) comes out in metres.
Understanding the Question
You are given:
- galaxy recession speed: (v = 6.2 \times 10^{6}\ \text{m s}^{-1})
- Hubble constant: (H_0 = 2.3 \times 10^{-18}\ \text{s}^{-1})
You must determine the galaxy’s distance from Earth.
Approach
Rearrange Hubble’s law to (d = v/H_0) and substitute the values.
Step-by-Step Reasoning
Start with:
Rearrange:
Substitute:
Unit check:
Key Takeaways
- Hubble’s law is a direct proportionality: distance is found by dividing the recessional speed by (H_0).
- Units are a useful self-check.
Common Mistakes
- Multiplying by (H_0) instead of dividing.
- Treating (H_0) as having units of (\text{m s}^{-1}) (it does not; it is (\text{s}^{-1}) here).
Things to Be Careful About
- Standard form arithmetic: dividing by (10^{-18}) increases the power of ten by (+18).
- Quote to appropriate significant figures (here 2 s.f. is reasonable from given data).
Answer
Binding energy is the energy required to separate a nucleus completely into its individual protons and neutrons (to infinite separation).
Energy required to separate the nucleus into free nucleons (at infinite separation).
Background Concept
Nuclei are made of protons and neutrons (nucleons) bound together by the strong nuclear force. When nucleons bind together, energy is released and the resulting nucleus has a smaller mass than the total mass of the separated nucleons. This “missing mass” is the mass defect.
Binding energy is a way to quantify how strongly the nucleons are held together.
Understanding the Question
The question asks for the meaning of “binding energy of a nucleus”. No calculation is required; it is asking for the definition in words.
Approach
Use the standard definition used in Cambridge mark schemes: binding energy is the energy needed to split a nucleus into its separate nucleons, far apart so they no longer interact.
Step-by-Step Reasoning
- “Separate completely” means break all nuclear bonds.
- “Individual nucleons” means separate protons and neutrons.
- “To infinity” (or infinite separation) is included to make clear the nucleons have no remaining attractive nuclear interaction energy.
Key Takeaways
- Binding energy = energy required to dismantle the nucleus into free nucleons.
- A larger binding energy means a more strongly bound (more stable) nucleus.
Common Mistakes
- Defining it as “energy released in decay” (not the definition; decay energy is related but different).
- Saying it is “the mass defect” rather than energy (mass defect must be converted using ).
Things to Be Careful About
- Binding energy is for the whole nucleus, not per nucleon (unless explicitly asked).
- Include the idea of nucleons being separated so there is no remaining nuclear force interaction (often phrased as “infinite separation”).
Table 9.1 shows the masses of two sub-atomic particles and a polonium-212 () nucleus.
Table 9.1
| mass / u | |
|---|---|
| proton | 1.007276 |
| neutron | 1.008665 |
| polonium-212 nucleus | 211.942749 |
For the polonium-212 nucleus, determine:
Working
For : , .
Mass of separated nucleons:
Mass defect:
Using ,
Answer
2.95 × 10^-27 kg
Background Concept
For a nucleus :
- = number of protons.
- = total number of nucleons (protons + neutrons).
- = number of neutrons.
The mass defect is
where and are the proton and neutron masses, and is the mass of the nucleus.
Understanding the Question
You are given the masses (in atomic mass units, u) of a proton, a neutron, and a polonium-212 nucleus. You must:
- find how many protons and neutrons are in ,
- calculate the difference between the total mass of the free nucleons and the mass of the nucleus,
- convert that mass difference from u to kg.
Approach
- Use nuclide notation to get and .
- Compute .
- Subtract the nucleus mass to get in u.
- Convert u to kg using .
Step-by-Step Reasoning
- Identify numbers of nucleons:
- For , .
- So .
- Total mass of separated nucleons:
- Mass defect in u:
This is positive, meaning the nucleus has less mass than the separated nucleons.
- Convert to kg:
Key Takeaways
- Always get and correct before calculating mass defect.
- Mass defect is a mass difference; binding energy is found only after multiplying by .
Common Mistakes
- Using or instead of .
- Forgetting that the given polonium mass is already the nucleus mass (so do not add electron masses).
- Incorrect conversion from u to kg or incorrect power of ten.
Things to Be Careful About
- Keep consistent units: do the subtraction in u, then convert once at the end.
- Use an appropriate value for (typically unless otherwise specified).
Working
Answer
binding energy
2.66 × 10^-10 J
Background Concept
The binding energy is related to mass defect by Einstein’s mass–energy relation:
where:
- is the mass defect (in kg),
- is the speed of light ().
Understanding the Question
You have already found the mass defect for the polonium-212 nucleus. This part asks you to convert that mass defect into the binding energy in joules.
Approach
Take the value of from part (i) (in kg) and multiply by .
Step-by-Step Reasoning
Using :
So to 3 s.f.
Key Takeaways
- Binding energy comes from mass defect via .
- Even a tiny mass defect corresponds to a large energy because is huge.
Common Mistakes
- Using but forgetting to square it.
- Using the mass defect still in u instead of converting to kg first.
- Quoting the answer in kg (wrong unit) instead of J.
Things to Be Careful About
- Track powers of ten carefully: .
- Give the final unit as joules, , as requested.
Working
Answer
binding energy per nucleon
1.25 × 10^-12 J
Background Concept
Binding energy per nucleon is a measure of how tightly, on average, each nucleon is bound:
where is the nucleon number.
Understanding the Question
You have found the total binding energy of the nucleus. This part asks for the average binding energy for each of the nucleons.
Approach
Divide the total binding energy (in J) by .
Step-by-Step Reasoning
Using :
Key Takeaways
- “Per nucleon” always means divide by .
- This quantity is what is plotted in the well-known binding-energy curve.
Common Mistakes
- Dividing by or instead of .
- Forgetting the unit remains joules per nucleon (normally written simply as J, since “per nucleon” is descriptive).
Things to Be Careful About
- Use the correct for the nucleus (here ).
- Keep the answer to sensible significant figures based on the earlier parts.
On Fig. 9.1, sketch the variation with nucleon number of binding energy per nucleon for values of from to .
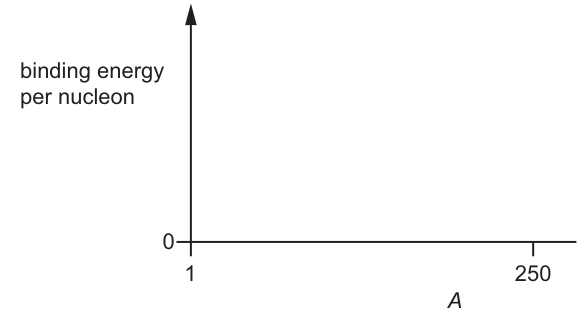
Answer
Sketch a curve that:
- rises steeply from to about ,
- continues to rise to a maximum at about ,
- then falls gradually from to .
Correct binding energy per nucleon curve shape sketched.
Background Concept
The binding energy per nucleon varies with nucleon number because:
- very light nuclei gain a lot of stability by fusing (binding energy per nucleon increases rapidly),
- medium-mass nuclei (around iron) are the most tightly bound (peak binding energy per nucleon),
- very heavy nuclei become less tightly bound per nucleon due to increasing proton–proton repulsion and the limited range of the strong force (binding energy per nucleon slowly decreases).
Understanding the Question
You are given blank axes for “binding energy per nucleon” against nucleon number from to . You must sketch the standard shape of the curve over this range.
Approach
Draw the standard binding-energy-per-nucleon graph:
- start low at ,
- rise steeply for small ,
- reach a maximum around ,
- then slowly decrease for large up to .
Step-by-Step Reasoning
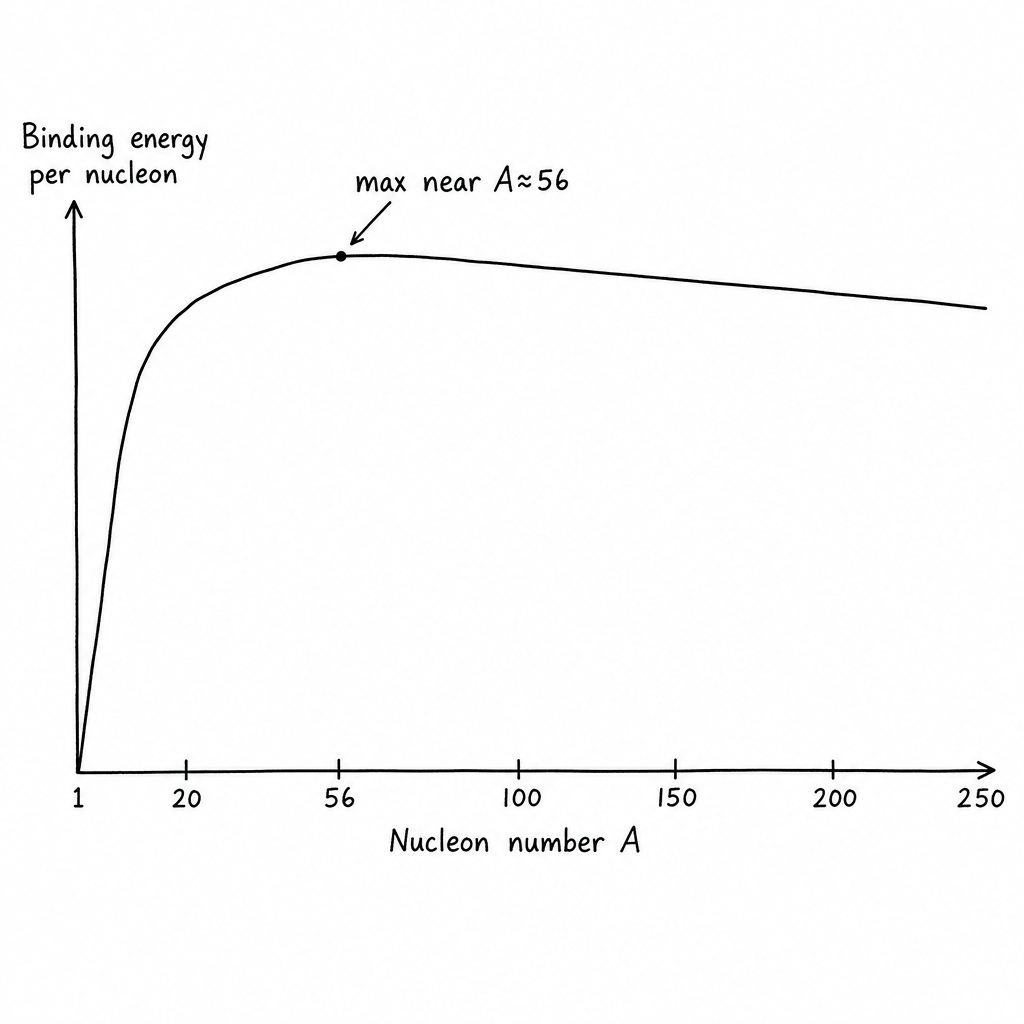
- At (a single nucleon), binding energy per nucleon is essentially zero because there is no nucleus.
- For light nuclei (a few nucleons up to roughly ), the curve rises steeply.
- The curve reaches a broad maximum around iron/nickel ().
- For heavier nuclei beyond that, the curve slowly falls, staying fairly high but gradually decreasing up to .
Key Takeaways
- Peak binding energy per nucleon occurs around .
- The curve rises quickly for small and decreases slowly for very heavy nuclei.
Common Mistakes
- Drawing a straight line increase all the way to .
- Putting the maximum at very high instead of around .
- Making the decrease after the peak too steep (it should be gradual).
Things to Be Careful About
- The question asks for a sketch: correct overall shape and key turning point matter more than exact numbers.
- Ensure the peak is clearly before , and the curve is slightly lower again by .
Answer
Place X at on the falling (heavy-nuclei) side of the curve (well to the right of the peak).
X at A = 212 on the descending heavy-nuclei region.
Background Concept
On the binding-energy-per-nucleon curve, nuclei with greater than about lie on the right-hand (heavy-nuclei) side, where binding energy per nucleon decreases slowly with increasing .
Understanding the Question
You must mark the position of polonium-212 on your sketched curve. Polonium-212 has nucleon number , which is close to the high end of the given range (up to ).
Approach
- Find on the horizontal axis.
- Move vertically to your curve and place an X on the curve at that .
Step-by-Step Reasoning
- Since is much larger than , it must be to the right of the peak.
- The curve is gently decreasing there, so the X should be on the descending part near the right side of the graph.
Key Takeaways
- is a heavy nucleus, so it lies on the right side of the binding energy curve.
Common Mistakes
- Putting the X near the peak at .
- Putting the X on the left-hand steeply rising region (light nuclei).
Things to Be Careful About
- The X must be on your curve, not just above/below it.
- Ensure it is at the correct horizontal position: close to but not at the extreme end (since ).
Polonium-212 is radioactive and undergoes alpha-decay.
Suggest and explain, with reference to Fig. 9.1, why the alpha-decay of polonium-212 results in a release of energy.
Answer
After -decay the daughter nucleus has a smaller and lies closer to the peak of the binding energy per nucleon curve, so its binding energy per nucleon is higher.
Hence the total binding energy of the products is greater than that of , so mass decreases and energy is released ().
Products have higher binding energy (per nucleon), so total binding energy increases and energy is released.
Background Concept
The binding energy per nucleon curve tells you how stable nuclei are:
- Higher binding energy per nucleon means nucleons are more tightly bound, so the nucleus is more stable.
Energy is released in a nuclear process if the total binding energy of the final products is greater than that of the initial nucleus. An increase in binding energy corresponds to a decrease in mass (mass defect increases), and the difference appears as released energy:
Understanding the Question
Polonium-212 is a heavy nucleus () on the right side of the binding energy per nucleon curve. It undergoes -decay, meaning it emits an alpha particle (), so the daughter nucleus has nucleon number .
The question asks you to use Fig. 9.1 (your curve) to explain why energy is released.
Approach
- Use the curve to compare binding energy per nucleon of:
- the original heavy nucleus (),
- the decay products (a slightly lighter heavy nucleus around and an alpha particle at ).
- Argue that the products have higher total binding energy, so energy must be released.
Step-by-Step Reasoning
- On the heavy side of the curve, as decreases slightly (moving left from to about ), the binding energy per nucleon typically increases because you move closer to the peak.
- The alpha particle () is also relatively tightly bound compared with many other very light nuclei.
- Therefore, after the decay, the products correspond to a state where nucleons are, overall, more tightly bound than before.
- If nucleons become more tightly bound, the total binding energy increases.
- Increased binding energy means the total rest mass of the products is smaller than the initial mass, and that mass difference is released as energy (shared as kinetic energy of the alpha particle and the recoiling daughter nucleus, and possibly gamma radiation).
Key Takeaways
- Energy is released when a nuclear reaction moves the system toward higher binding energy (greater stability).
- Heavy nuclei can release energy by splitting/emitting particles because they lie to the right of the peak.
Common Mistakes
- Saying “alpha decay releases energy because the nucleus is unstable” without linking to binding energy per nucleon.
- Claiming binding energy per nucleon decreases and still concluding energy is released (wrong direction).
- Confusing “binding energy” with “binding energy per nucleon” without making the stability comparison clear.
Things to Be Careful About
- The curve is for binding energy per nucleon; the energy released depends on the change in total binding energy of the whole system.
- Always reference the direction on the graph: for heavy nuclei, moving left (smaller ) generally moves closer to the maximum, meaning higher binding energy per nucleon and a more stable configuration.
Describe how reflected ultrasound pulses may be used to obtain diagnostic information about internal structures.
Answer
- A transducer sends a short ultrasound pulse into the body and detects the reflected (echo) pulses from boundaries between tissues.
- The time delay of an echo gives the depth of the boundary (using the speed of sound), and the size of the reflected pulse (intensity) gives information about the type of boundary/tissue contrast.
Pulse-echo: time delay gives depth; echo amplitude gives information about tissue boundaries.
Background Concept
Diagnostic ultrasound commonly uses the pulse-echo method. When an ultrasound wave meets a boundary between two media with different acoustic properties, part of the wave is reflected and part transmitted. The reflected part returns to the source and can be detected.
If the speed of sound in the tissue is approximately known (often taken as a typical value for soft tissue), then the distance to the reflecting boundary can be found from the time taken for the pulse to go to the boundary and return.
Understanding the Question
You are asked how reflected ultrasound pulses provide diagnostic information about internal structures. That means describing:
- what is sent in,
- what is measured on return,
- how the measurements are interpreted (depth/location and tissue boundary information).
Approach
State the pulse-echo process: transmit pulse, receive echoes. Then give two key diagnostic links:
- echo time delay (\rightarrow) depth/position of boundary,
- echo intensity/amplitude (\rightarrow) strength of reflection, hence information about the type of boundary (different tissues have different impedance mismatches).
Step-by-Step Reasoning
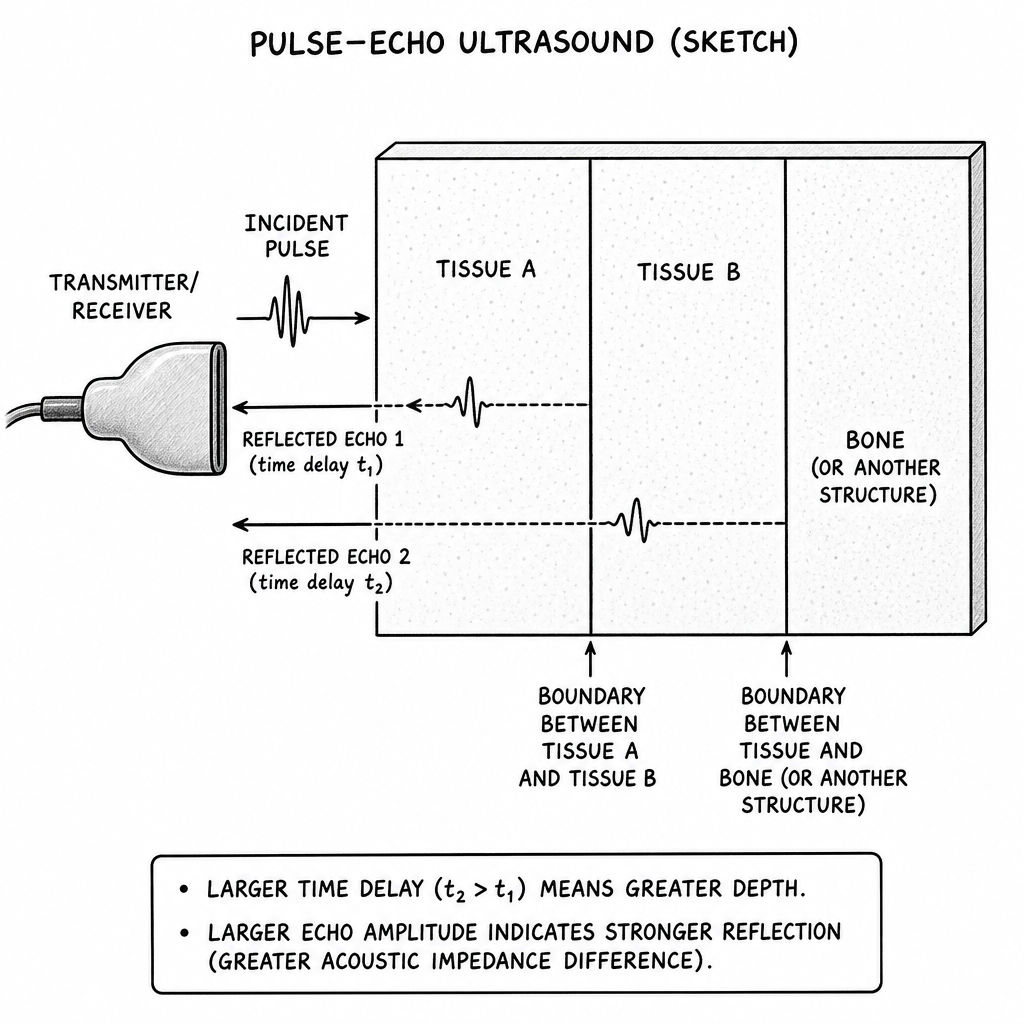
- The transducer emits a short pulse of ultrasound into the body.
- Whenever the pulse meets a boundary between different tissues (or tissue and bone, etc.), some energy is reflected.
- The same transducer (or a receiver) detects the reflected pulse (echo).
- If the echo returns after time (t), then the depth (d) of the boundary is found using the round trip:
where (c) is the speed of sound in the tissue.
5) The size (intensity/amplitude) of the echo depends on how strong the reflection is at that boundary, so larger echoes indicate a larger contrast in acoustic properties between the two regions.
Key Takeaways
- Ultrasound imaging uses reflections at boundaries.
- Echo time delay locates boundaries (depth).
- Echo amplitude/intensity indicates boundary/tissue contrast.
Common Mistakes
- Forgetting the factor of (\tfrac{1}{2}) for the pulse traveling to the boundary and back.
- Saying only “it forms an image” without mentioning what is measured (time delay and echo size).
- Confusing the roles of reflected and transmitted waves.
Things to Be Careful About
- The question asks about reflected pulses specifically: make sure to mention detection of echoes.
- Keep the explanation linked to diagnostic information (position and nature of boundaries), not just how ultrasound is generated.
Answer
Specific acoustic impedance (Z) of a medium is
where (\rho) is the density and (c) is the speed of sound in the medium.
Specific acoustic impedance: .
Background Concept
For waves at a boundary, how much reflects depends on how well the two media “match” acoustically. This matching is described by the specific acoustic impedance (Z), which is a property of the medium.
At A Level, it is defined using density (\rho) and speed of sound (c):
(Z) has units:
Understanding the Question
The question asks for a definition of specific acoustic impedance “of a medium”. So you should state what it is and give the defining expression (and ideally identify the symbols).
Approach
Write the standard definition used in ultrasound problems: (Z = \rho c), then define (\rho) and (c).
Step-by-Step Reasoning
- Specific acoustic impedance is a medium property combining how massive the medium is ((\rho)) and how fast sound travels in it ((c)).
- Therefore:
with (\rho) in (\text{kg m}^{-3}) and (c) in (\text{m s}^{-1}).
Key Takeaways
- Remember (Z = \rho c).
- Large differences in (Z) between two media lead to strong reflections.
Common Mistakes
- Writing (Z = \rho / c) or (Z = c/\rho).
- Not defining the symbols or calling (c) “frequency” instead of speed of sound.
Things to Be Careful About
- Use (c) specifically as the speed of sound in the medium, not the speed of light.
- Keep units consistent if asked later to calculate reflection coefficients.
Table 10.1 shows some data for water and for glass.
Table 10.1
| density / | speed of sound / | |
|---|---|---|
| water | 1000 | 1420 |
| glass | 2500 | 4560 |
Determine the intensity reflection coefficient for ultrasound that is incident on a water–glass boundary.
intensity reflection coefficient = ______
Working
Specific acoustic impedance:
Water:
Glass:
Intensity reflection coefficient:
Answer
Intensity reflection coefficient (\approx 0.61).
0.61
Background Concept
When an ultrasound wave is incident normally on a boundary between two media with acoustic impedances (Z_1) and (Z_2), part of the incident intensity is reflected.
The intensity reflection coefficient (R) is the fraction of incident intensity reflected:
For normal incidence, the standard result in A Level ultrasound is:
You must first find (Z) for each medium using:
Understanding the Question
You are given (\rho) and (c) for water and glass, and asked to determine the intensity reflection coefficient for ultrasound incident on a water-glass boundary. So:
- compute (Z_\text{water}) and (Z_\text{glass}),
- substitute into the reflection coefficient formula,
- give a dimensionless value (between 0 and 1).
Approach
- Calculate impedances: (Z = \rho c).
- Decide which is (Z_1) and (Z_2) (order does not matter because of the square).
- Apply
- Evaluate carefully using standard form to avoid calculator mistakes.
Step-by-Step Reasoning
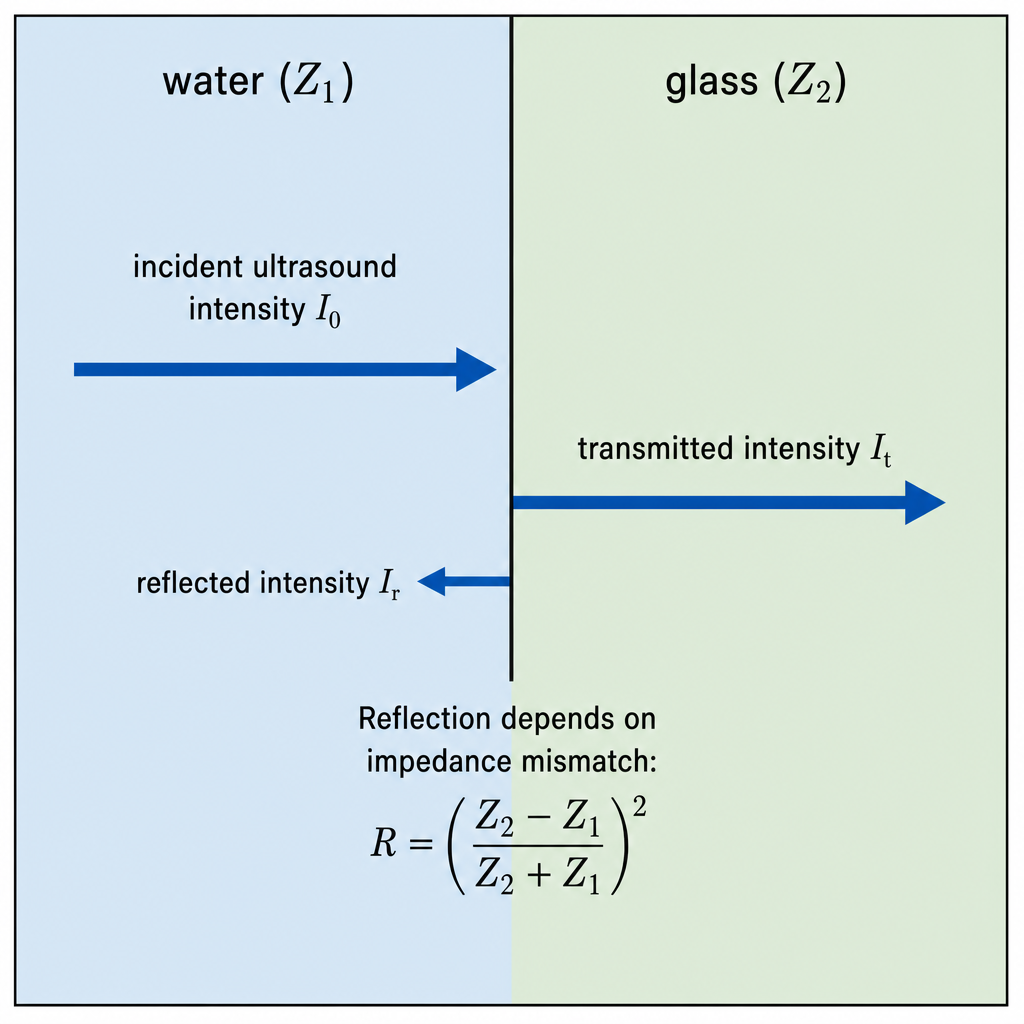
1) Calculate acoustic impedances
For water:
For glass:
2) Substitute into reflection coefficient
Take (Z_1 = Z_\text{water}), (Z_2 = Z_\text{glass}):
Compute numerator and denominator:
So
Finally square to get intensity fraction:
This means about 61% of the incident intensity is reflected at a water-glass boundary (a strong reflection because impedances differ greatly).
Key Takeaways
- First compute (Z) for each medium using (Z=\rho c).
- Use the squared impedance-mismatch ratio for intensity reflection.
- The reflection coefficient is dimensionless and should lie between 0 and 1.
Common Mistakes
- Forgetting to square the ratio (gives an amplitude-type coefficient, not intensity).
- Using (R = \frac{Z_2 - Z_1}{Z_2 + Z_1}) without the square.
- Arithmetic errors with powers of ten when adding/subtracting impedances.
- Giving units for (R) (it has none).
Things to Be Careful About
- Keep at least 3 significant figures during intermediate steps; round only at the end.
- Order of (Z_1), (Z_2) does not matter because ((Z_2-Z_1)^2) is the same either way.
- Ensure you use intensity reflection coefficient (squared form), not pressure/amplitude reflection coefficient.