Physics 9702/41 — May/June 2024
Cambridge A-Level · A Level Structured Questions · worked solutions for every part, with the mark scheme
Topics Gravitational Fields · Temperature · Ideal Gases · Thermodynamics · Oscillations · Electric Fields · +7 more
Answer
Gravitational potential at a point is the work done per unit mass by an external agent in bringing a small test mass from infinity to the point (with no change in kinetic energy).
Work done per unit mass by an external agent to bring a test mass from infinity to the point (no change in KE).
Background Concept
Gravitational potential at a point is defined using the idea of work and energy in a gravitational field. We choose the gravitational potential to be zero at infinity. Then, for a small test mass , the gravitational potential energy is .
A key definition is:
- at a point = work done per unit mass (by an external agent) to bring a test mass from infinity to that point, slowly, so that kinetic energy does not change.
Understanding the Question
You are asked to give the definition of gravitational potential at a point. No numbers are needed; you must include the reference point (infinity) and the “per unit mass” idea.
Approach
State the standard definition used in Cambridge A Level Physics:
- from infinity, 2) work done (or energy required), 3) per unit mass, 4) no change in kinetic energy.
Step-by-Step Reasoning
- “Work done” connects the field concept to energy.
- “Per unit mass” distinguishes potential from potential energy .
- “From infinity” sets the zero level of potential.
- “No change in kinetic energy” means the work done corresponds only to a change in gravitational potential energy.
A fully correct definition is therefore: work done per unit mass by an external agent to bring a small test mass from infinity to the point.
Key Takeaways
- Gravitational potential is energy per unit mass.
- The reference level is at infinity.
- Potential energy and potential are related by .
Common Mistakes
- Defining potential energy instead of potential (missing “per unit mass”).
- Not mentioning that the mass is brought from infinity.
- Saying “work done by the field” without clarity (the standard definition uses work done by an external agent).
Things to Be Careful About
- Use the words “per unit mass” explicitly.
- Include “from infinity”; otherwise the definition is incomplete.
A satellite X, of mass , orbits a planet at a constant distance from the centre of the planet, as shown in Fig. 1.1.
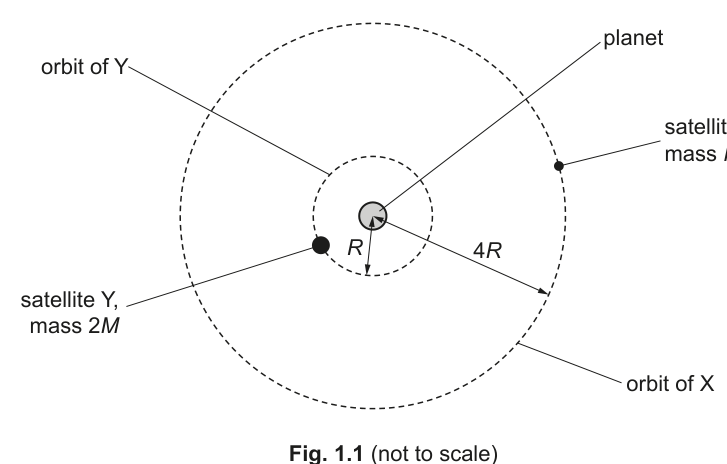
A second satellite Y, of mass , orbits the planet with orbital radius .
The gravitational potential at X due to the planet is . The planet is a uniform sphere.
Answer
Gravitational potential is defined to be zero at infinity. Since gravity is attractive, a mass at X is in a bound state and work must be done to move it to infinity, so its potential (relative to infinity) is negative.
Because potential is zero at infinity and gravity is attractive, a mass at X must gain energy (external work is required) to reach infinity, so the potential at X is negative.
Background Concept
Gravitational potential is defined with . For a spherically symmetric mass, outside the mass we have
which is negative for any finite .
The negative sign comes from the fact that gravity is an attractive interaction: you must supply energy (do external work) to take a mass from a point in the field out to infinity.
Understanding the Question
You are told the gravitational potential at X (a finite distance from the planet) is . You must explain why it is negative, i.e. why the sign is “minus”.
Approach
Use the definition and describe what happens energetically:
- A mass at finite distance is attracted inward.
- To move it out to infinity, an external agent must do positive work.
- Therefore the potential energy at finite distance is lower than at infinity, meaning the potential is negative.
Step-by-Step Reasoning
- Zero of potential is chosen at infinity: .
- At a point nearer the planet, a test mass is attracted towards the planet.
- If you try to take the test mass from X to infinity, you must pull against the attractive force, so you must do positive work.
- That means the test mass has lower potential energy at X than at infinity.
- Therefore (potential energy per unit mass) is less than zero, so it is negative.
Key Takeaways
- The negative sign is a consequence of the choice and the attractive nature of gravity.
- Finite-distance gravitational states are “bound” and have negative potential (and potential energy).
Common Mistakes
- Saying “because gravity is negative” without referencing the zero at infinity.
- Mixing up potential and field strength: field strength is positive in magnitude but potential can be negative.
Things to Be Careful About
- Always connect the sign to the reference level at infinity.
- Use energy/work language clearly: work must be done to move away from the planet.
State an expression, in terms of , for the gravitational potential at Y due to the planet.
gravitational potential = ______
Working
For outside the planet,
At X, and :
At Y, :
Answer
-4\Phi
Background Concept
Outside a uniform spherical planet, the gravitational potential is the same as if all the planet’s mass were concentrated at its centre:
So for points outside the planet.
Understanding the Question
Satellite X is at distance from the planet’s centre and has potential . Satellite Y is at distance . You are asked for the potential at Y due to the planet, in terms of .
Approach
Use the proportionality :
- If the radius becomes 4 times smaller (from to ), the magnitude of the potential becomes 4 times larger.
- Keep the negative sign because the potential remains negative at any finite radius.
Step-by-Step Reasoning
- Write potential at radius :
- At X:
So
- At Y (radius ):
Key Takeaways
- For a spherical planet, outside it: .
- Potential scales as (not ).
- The sign stays negative for finite when .
Common Mistakes
- Using (that is for field strength , not potential).
- Forgetting the negative sign and writing .
Things to Be Careful About
- X is at from the centre, not radii above the surface.
- here represents the magnitude of the potential at X (since the potential is given as ).
Complete Table 1.1 by giving expressions, in terms of some or all of , and , for the quantities indicated for each of the satellites X and Y.
Table 1.1
| satellite X | satellite Y | |
|---|---|---|
| gravitational field strength at satellite due to planet | ||
| gravitational potential energy of satellite |
Working
From part (ii), at :
Field strength .
Satellite X ():
Satellite Y ():
Potential energy .
Satellite X (, ):
Satellite Y (, ):
Answer
- Field strength: X , Y
- Potential energy: X , Y
X: g = \Phi/(4R), U = -M\Phi; Y: g = 4\Phi/R, U = -8M\Phi
Background Concept
For a spherically symmetric planet, at distances outside the planet:
and gravitational field strength (magnitude) is
Gravitational potential energy of a mass at a point is
So once you know at a point, follows immediately by multiplying by the satellite’s mass.
Understanding the Question
You have two satellites at different orbital radii:
- X: mass , radius , potential .
- Y: mass , radius .
You must fill a table with expressions for:
- gravitational field strength at each satellite due to the planet,
- gravitational potential energy of each satellite.
All answers must be in terms of some or all of , , and .
Approach
- Use the given potential at X to eliminate the planet parameter .
- Use to get and .
- Use (with the potential values at X and Y) to get potential energies.
Step-by-Step Reasoning
1) Find in terms of and .
At X, and
Cancel the minus signs:
So
2) Field strengths
Use .
- At X, :
- At Y, :
These are magnitudes; the field direction is towards the planet.
3) Potential energies
Use .
- For X: and :
- For Y: first use the potential at Y (from part (ii)), , and :
Key Takeaways
- Outside a spherical planet: and .
- You can use a given potential at one radius to determine and then find other quantities.
- Potential energy is simply .
Common Mistakes
- Using (confusing with potential).
- Forgetting that satellite Y has mass when calculating .
- Missing the negative sign in potential energy: bound gravitational potential energy is negative when zero is at infinity.
Things to Be Careful About
- Distinguish carefully between:
- (potential, per unit mass),
- (potential energy),
- (field strength).
- Use and as distances from the centre (as stated), not height above the surface.
- Final expressions should be algebraic in , , with correct factors (4, 16, etc.).
Answer
Absolute zero is .
0 K
Background Concept
The thermodynamic temperature scale is the kelvin scale, where temperature is measured in kelvin (K). It is an absolute scale: it has a true zero corresponding to the lowest possible thermal energy of random molecular motion.
Absolute zero is the temperature at which a system has minimum possible internal energy (in classical terms, zero random kinetic energy), and it is defined as .
Understanding the Question
The question asks for two things: the magnitude (numerical value) and the unit of absolute zero on the thermodynamic temperature scale.
Approach
This is direct recall: absolute zero is the zero point of the kelvin scale, so state the value and unit.
Step-by-Step Reasoning
- On the thermodynamic (kelvin) scale, the zero point is absolute zero.
- Therefore the magnitude is and the unit is kelvin (K): .
Key Takeaways
- Thermodynamic temperature is measured in kelvin.
- Absolute zero corresponds to .
Common Mistakes
- Writing as the answer (the question specifically asks for the thermodynamic scale).
- Giving the unit as instead of K.
Things to Be Careful About
- Use the correct unit symbol: (not or ).
- Do not include a degree sign with kelvin.
Explain why temperature measured using a laboratory liquid-in-glass thermometer does not give a measurement of thermodynamic temperature.
Answer
A liquid-in-glass thermometer measures temperature via expansion of the liquid (and the glass), which is not directly proportional to thermodynamic temperature and depends on the materials. It must be calibrated using fixed points, so it does not measure thermodynamic temperature directly.
It uses liquid expansion (material-dependent, not directly proportional), so it needs calibration and is not a direct thermodynamic temperature measurement.
Background Concept
A practical thermometer uses a thermometric property: a physical property that changes with temperature (e.g. length of a liquid column, electrical resistance, emf of a thermocouple). To read a temperature from that property, we must assume a relationship between the property and temperature.
Thermodynamic temperature is the “true” temperature defined by thermodynamics (independent of any particular substance). A practical thermometer generally cannot produce thermodynamic temperature directly; it must be calibrated so that its readings correspond to thermodynamic temperature.
Understanding the Question
You are asked why a laboratory liquid-in-glass thermometer (which uses the length/volume of the liquid column) does not directly measure thermodynamic temperature.
Approach
State what it measures (expansion of liquid) and why that is not the same as thermodynamic temperature (material dependence, non-linearity), so calibration is needed.
Step-by-Step Reasoning
- In a liquid-in-glass thermometer, the thermometric property is the volume (or length) of the liquid column.
- The expansion of the liquid is not perfectly proportional to thermodynamic temperature across all temperatures. Also, the glass bulb and capillary expand too, affecting the reading.
- Because the relationship is not fundamental and depends on the liquid and glass, the thermometer must be calibrated using fixed points (e.g. ice point and steam point) to assign temperatures.
- Therefore, the instrument’s reading is a practical temperature scale, not a direct measurement of thermodynamic temperature.
Key Takeaways
- Practical thermometers measure a thermometric property, not temperature itself.
- Thermodynamic temperature is substance-independent; liquid expansion depends on the liquid and the container.
Common Mistakes
- Saying only “it is inaccurate” (too vague; the key idea is material dependence/calibration).
- Claiming it “cannot measure kelvin” (it can be calibrated to read in K, but it is still not a direct thermodynamic measurement).
Things to Be Careful About
- Make clear it’s not the presence of a scale marking that matters; it’s the assumed relationship between expansion and temperature.
- Mentioning calibration or non-linearity/material dependence is usually essential for the mark.
Fig. 2.1 shows a simplified diagram of a type of thermometer called a platinum resistance thermometer.
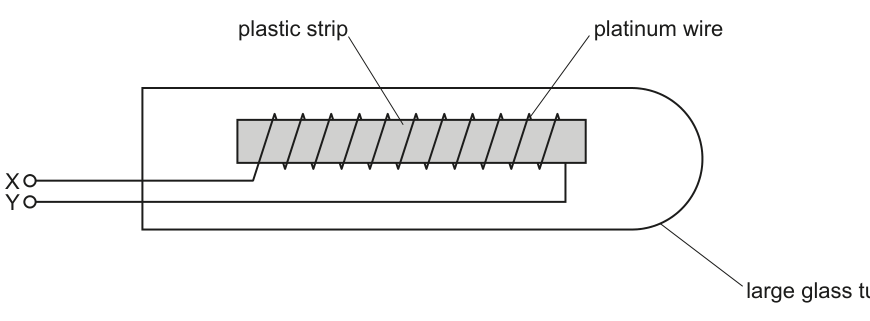
The glass tube is immersed in the environment for which the temperature is to be determined. The resistance between the terminals X and Y is measured.
Fig. 2.2 shows the variation of the resistivity of platinum with thermodynamic temperature .
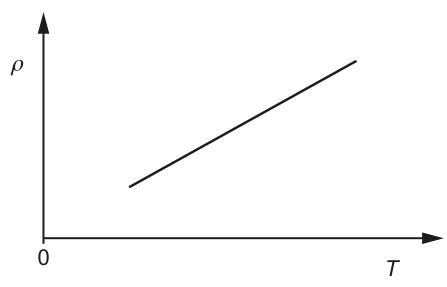
Explain how Fig. 2.2 shows that platinum is a suitable metal for use in a resistance thermometer.
Answer
Fig. 2.2 shows increases linearly with (straight line), so resistance (hence ) has a predictable, repeatable change with temperature and can be calibrated easily. The non-zero gradient means a change in gives a measurable change in (good sensitivity).
ρ varies linearly with T with a clear gradient, giving a predictable, calibratable and sensitive change in resistance.
Background Concept
A resistance thermometer works because the electrical resistance of a metal changes with temperature.
For a wire of length and cross-sectional area :
If and are fixed, then measuring is effectively measuring resistivity . A good thermometric property should:
- change significantly with temperature (sensitivity),
- change in a predictable way (often close to linear),
- be repeatable and stable.
Understanding the Question
You are given that the thermometer’s platinum wire is in the environment, and the resistance between terminals and is measured. Fig. 2.2 plots platinum’s resistivity against thermodynamic temperature and shows a straight-line increase.
The question asks how that graph indicates platinum is suitable for a resistance thermometer.
Approach
Use the graph features that matter: straight line (linear relation) and clear positive gradient (measurable change per kelvin). Connect these to calibration and sensitivity.
Step-by-Step Reasoning
- Since the graph of against is a straight line, is directly proportional to over the range shown.
- Because (for constant geometry), the resistance also changes linearly with temperature.
- A linear relationship makes calibration straightforward: equal temperature intervals correspond to equal resistance intervals.
- The positive gradient means that a small change in produces a change in (and thus ) that can be detected; this indicates good sensitivity.
Key Takeaways
- In resistance thermometers, is used as the thermometric property.
- A linear, significant change of with makes a material suitable.
Common Mistakes
- Just stating “it is suitable because it is a metal” (doesn’t use the graph evidence).
- Talking about the intercept value at without linking it to thermometer performance.
Things to Be Careful About
- The question refers to resistivity , but the instrument measures resistance ; you must link them using .
- Don’t claim the line must pass through the origin; for metals, at need not be zero due to residual resistivity.
Suggest a reason why a platinum resistance thermometer is not suitable for measuring a rapidly changing temperature.
Answer
It has a slow response (large thermal mass / needs time to reach thermal equilibrium with the surroundings), so it cannot follow rapidly changing temperature.
Slow response time due to thermal mass/time to reach thermal equilibrium.
Background Concept
A thermometer must exchange thermal energy with its surroundings until it reaches thermal equilibrium; only then does its thermometric property correspond to the surroundings’ temperature.
The time taken to respond depends on factors such as:
- thermal mass (heat capacity) of the sensing element,
- surface area and thermal contact,
- thermal conductivity of materials,
- insulation and protective casing.
A large thermal mass or poor heat transfer causes a time lag.
Understanding the Question
The platinum resistance thermometer shown is housed in a glass tube and contains a plastic strip with platinum wire wound around it. This construction likely increases the thermal mass and reduces how quickly the platinum wire’s temperature matches the environment.
You must suggest one reason it is not suitable when temperature changes rapidly.
Approach
State that it does not respond instantly because it needs time to come into equilibrium; link this to the physical construction (glass/plastic) giving thermal inertia.
Step-by-Step Reasoning
- When the environment temperature changes, the platinum wire must gain/lose thermal energy to change its temperature.
- The glass tube and plastic support add thermal mass and can reduce the rate of heat transfer to the wire.
- Therefore the wire temperature (and hence resistance) lags behind the true environment temperature.
- For rapid changes, the reading is always “behind”, making it unsuitable.
Key Takeaways
- Rapidly changing temperature measurements require sensors with small thermal mass and fast heat transfer.
- Platinum resistance thermometers can be accurate but may be slow.
Common Mistakes
- Saying “resistance changes too slowly” without linking to thermal equilibrium/time lag.
- Claiming the resistance change is non-linear (the given graph shows it is linear).
Things to Be Careful About
- Don’t confuse electrical response time with thermal response time; the limitation is mainly thermal.
- Keep the answer focused on one clear reason for the 1 mark (time lag / slow response).
Suggest a type of thermometer that is suitable for measuring a rapidly changing temperature.
Answer
A thermocouple.
Thermocouple
Background Concept
A thermocouple uses the Seebeck effect: an emf is produced that depends on the temperature difference between two junctions made of different metals. The sensing junction can be made very small, giving low thermal mass and therefore a fast response.
Understanding the Question
You need to name a thermometer suitable for rapidly changing temperatures, i.e. one with a short response time.
Approach
Choose an instrument known for fast thermal response due to a small sensing element.
Step-by-Step Reasoning
- A thermocouple junction can be tiny.
- Small thermal mass means it reaches thermal equilibrium with the surroundings quickly.
- Therefore it can follow rapid temperature changes.
Key Takeaways
- Fast-response temperature sensors include thermocouples and (small) thermistors.
Common Mistakes
- Naming a liquid-in-glass thermometer (typically slow).
- Naming a gas thermometer (accurate for thermodynamic temperature but not fast or convenient).
Things to Be Careful About
- The question asks for a type of thermometer, not a material.
- Ensure the example is genuinely suitable for rapid changes (thermocouple is the standard answer).
A negative temperature coefficient thermistor may be used as a type of resistance thermometer.
State one way in which the variation with temperature of the resistance of a thermistor differs from that of a platinum wire.
Answer
A thermistor has a negative temperature coefficient: its resistance decreases as temperature increases (and the change is non-linear), whereas a platinum wire’s resistance increases approximately linearly with temperature.
Thermistor resistance decreases with temperature (negative coefficient), unlike platinum which increases (approximately linearly).
Background Concept
In resistance thermometers, resistance depends on temperature, but different materials behave differently.
- Metals (e.g. platinum): as temperature increases, lattice vibrations increase, electron scattering increases, so resistance typically increases approximately linearly over a wide range.
- Thermistors (semiconductors, often metal oxides): as temperature increases, more charge carriers become available, so resistance typically decreases; the variation is usually strongly non-linear (often close to exponential over some range).
Understanding the Question
You are asked for one difference between how the resistance of a negative temperature coefficient (NTC) thermistor varies with temperature compared with a platinum wire.
Approach
Give one clear contrasting statement: either the direction of change (negative vs positive coefficient) or the shape (non-linear vs linear). One is enough.
Step-by-Step Reasoning
- For an NTC thermistor, increasing temperature increases the number of free carriers in the semiconductor.
- Increased carrier number reduces resistance.
- For platinum, increasing temperature increases resistance (approximately linear).
Key Takeaways
- Thermistor: resistance decreases with temperature (NTC), usually non-linear.
- Platinum wire: resistance increases with temperature, often close to linear.
Common Mistakes
- Saying both increase (confuses with metals).
- Only saying “they are different” without stating how.
Things to Be Careful About
- The question specifies negative temperature coefficient thermistor, so the sign of the change is the most direct, mark-winning difference.
- If you mention non-linearity, make sure it is clearly contrasted with platinum’s approximately linear behaviour.
Answer
An ideal gas is a gas that obeys the equation of state
at all temperatures and pressures, because its molecules occupy negligible volume and exert negligible intermolecular forces (except during elastic collisions).
An ideal gas obeys pV = NkT (or pV = nRT) for all temperatures and pressures; molecules have negligible volume and no intermolecular forces (collisions elastic).
Background Concept
An ideal gas is a model used to simplify real gases. It is based on kinetic theory, which treats a gas as a very large number of small particles moving randomly.
The key mathematical description is the ideal gas equation of state:
where is pressure, is volume, is thermodynamic temperature, is number of moles, is number of molecules, is the molar gas constant and is the Boltzmann constant.
Understanding the Question
The question asks for what is meant by an ideal gas (2 marks). Typically, marks are awarded for (1) stating that it obeys the ideal gas equation and (2) stating the physical assumptions behind why it does so (negligible molecular volume and negligible intermolecular forces / elastic collisions).
Approach
Give the defining behaviour (obeys or for all conditions), then add one or more kinetic-theory assumptions that distinguish an ideal gas model from a real gas.
Step-by-Step Reasoning
- State the equation of state: (or ).
- Add the modelling assumptions:
- molecules are effectively point particles (negligible volume compared with the container),
- no intermolecular forces except during collisions,
- collisions are perfectly elastic.
Any two of these points usually secure full credit.
Key Takeaways
- “Ideal gas” means it follows exactly.
- The reason is the simplifying kinetic-theory assumptions (no forces, negligible size, elastic collisions).
Common Mistakes
- Saying only “it obeys ” without indicating the “all temperatures and pressures” aspect.
- Confusing ideal gas with “real gas at low pressure” (that is a condition where real gases approximate ideal behaviour, not the definition).
Things to Be Careful About
- Temperature must be on the kelvin scale in the equation of state.
- Do not introduce extra conditions like “low pressure only” as part of the definition (that describes when real gases behave ideally).
Use one of the basic assumptions of the kinetic theory to explain what can be deduced about the potential energy associated with the random motion of molecules in an ideal gas.
Answer
For an ideal gas, a basic kinetic-theory assumption is that intermolecular forces are negligible (except during collisions). Hence there is no significant intermolecular potential energy, so the potential energy associated with the random motion is constant and can be taken as zero.
Intermolecular forces are negligible, so intermolecular potential energy is negligible/constant (taken as zero).
Background Concept
The internal energy of a gas is the total microscopic energy of its molecules. In general it includes:
- random translational kinetic energy,
- rotational/vibrational kinetic energy (for non-monatomic gases),
- intermolecular potential energy (due to forces between molecules).
A defining kinetic-theory assumption for an ideal gas is that molecules exert negligible forces on each other except during brief collisions. If there are no forces, there is no energy stored in separation (i.e. no intermolecular potential energy to consider).
Understanding the Question
You are asked to use one basic kinetic-theory assumption to deduce what can be said about the potential energy associated with random molecular motion in an ideal gas.
The intended assumption is: “no intermolecular forces (except during collisions)”. From that, we deduce that intermolecular potential energy is negligible (effectively zero or constant).
Approach
- Choose the assumption: negligible intermolecular forces.
- Translate “negligible force” into “negligible potential energy change / negligible potential energy associated with separation”.
- State the consequence clearly.
Step-by-Step Reasoning
- Potential energy between molecules exists only if there are intermolecular forces.
- In an ideal gas model, intermolecular forces are ignored.
- Therefore, molecules do not store energy in their relative positions; the intermolecular potential energy does not change and is taken as zero.
This is why (for an ideal gas) internal energy is treated as coming from kinetic energy only.
Key Takeaways
- No intermolecular forces no intermolecular potential energy contribution.
- For an ideal gas, internal energy is not increased by “separating” molecules (because no energy is stored in that separation).
Common Mistakes
- Saying the potential energy is “maximum” or “increases with temperature” (that would require intermolecular forces).
- Mixing up gravitational potential energy (macroscopic) with intermolecular potential energy (microscopic).
Things to Be Careful About
- The question is about potential energy linked to random motion (i.e. intermolecular potential energy), not about kinetic energy.
- You must explicitly connect the assumption (no forces) to the conclusion (no potential energy / constant potential energy).
A sample of of an ideal gas is at pressure and temperature .
Determine:
Working
Using
Answer
1.3 × 10^25
Background Concept
For an ideal gas, the macroscopic variables are related by the equation of state:
where is the number of molecules and is the Boltzmann constant. This form is useful when the question asks for number of molecules directly.
Understanding the Question
Given:
You must determine , the number of molecules.
Approach
Rearrange to make the subject:
Then substitute the values (all already in SI units).
Step-by-Step Reasoning
- Start from the ideal gas equation:
- Rearrange for :
- Substitute:
- Divide:
Key Takeaways
- Use when asked for number of molecules.
- is equivalent to joules, which helps check consistency.
Common Mistakes
- Using instead of without switching to moles ().
- Using temperature in °C instead of K.
- Dropping powers of ten in .
Things to Be Careful About
- Significant figures: data are given to about 2 s.f., so should be quoted as .
- Ensure is in (not litres or ).
Working
Average translational kinetic energy per molecule:
Answer
6.0 × 10^-21 J
Background Concept
Kinetic theory links temperature to the random motion of molecules. For an ideal gas, the mean translational kinetic energy per molecule is
This is a key result: temperature measures the average translational kinetic energy of molecules.
Understanding the Question
You are asked to calculate the average translational kinetic energy of one molecule at . No other values are needed.
Approach
Use
and substitute and .
Step-by-Step Reasoning
- Write the relation:
- Substitute values:
- Multiply:
- (approximately)
Key Takeaways
- For an ideal gas, mean translational kinetic energy is proportional to absolute temperature.
- The factor comes from three translational degrees of freedom.
Common Mistakes
- Using instead of .
- Forgetting that must be in kelvin.
Things to Be Careful About
- This is energy per molecule, so use , not .
- Quote the answer to appropriate significant figures and include the unit joule.
Working
For an ideal gas, intermolecular forces are negligible, so internal energy is due to random kinetic energy only:
Since ,
Answer
7.8 × 10^4 J
Background Concept
Internal energy is the total microscopic energy of a system. For a gas, it is usually described as:
- the total random kinetic energy of the molecules, plus
- the total intermolecular potential energy.
For an ideal gas, a key assumption is that intermolecular forces are negligible. That means the intermolecular potential energy is negligible/constant, so changes in internal energy come only from changes in molecular kinetic energy.
For a (monatomic) ideal gas, the total random translational kinetic energy is
Using , this can also be written as
Understanding the Question
You have the same gas sample as in (b): and and . You must find the internal energy and explain why that expression is valid for an ideal gas.
Approach
- State the physical reasoning: ideal gas has negligible intermolecular forces, so no potential energy contribution.
- Use .
- Replace with for a quicker calculation.
Step-by-Step Reasoning
-
Explanation part:
- With negligible intermolecular forces, there is no significant potential energy stored between molecules.
- Therefore internal energy is just the total random kinetic energy.
-
Use the kinetic-theory expression:
- Use the ideal gas equation :
- Substitute and :
- Multiply by :
Key Takeaways
- Ideal gas: potential energy contribution is negligible, so depends only on .
- Useful identity: for a monatomic ideal gas, .
Common Mistakes
- Saying (missing the factor ).
- Claiming internal energy depends on volume directly for an ideal gas without specifying what is held constant.
- Forgetting to explain why potential energy can be ignored.
Things to Be Careful About
- The expression is for translational kinetic energy (monatomic ideal gas). In A-level ideal-gas questions, this is the intended model when has been used.
- Keep in pascals and in so that comes out in joules.
The volume of the gas in (b) is now varied, keeping its pressure constant.
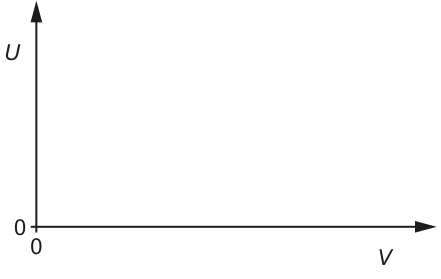
On Fig. 3.1, sketch the variation with of the internal energy of the gas.
Answer
At constant pressure, (for fixed ). For an ideal gas, , so .
Hence increases linearly with : a straight line through the origin with positive gradient.
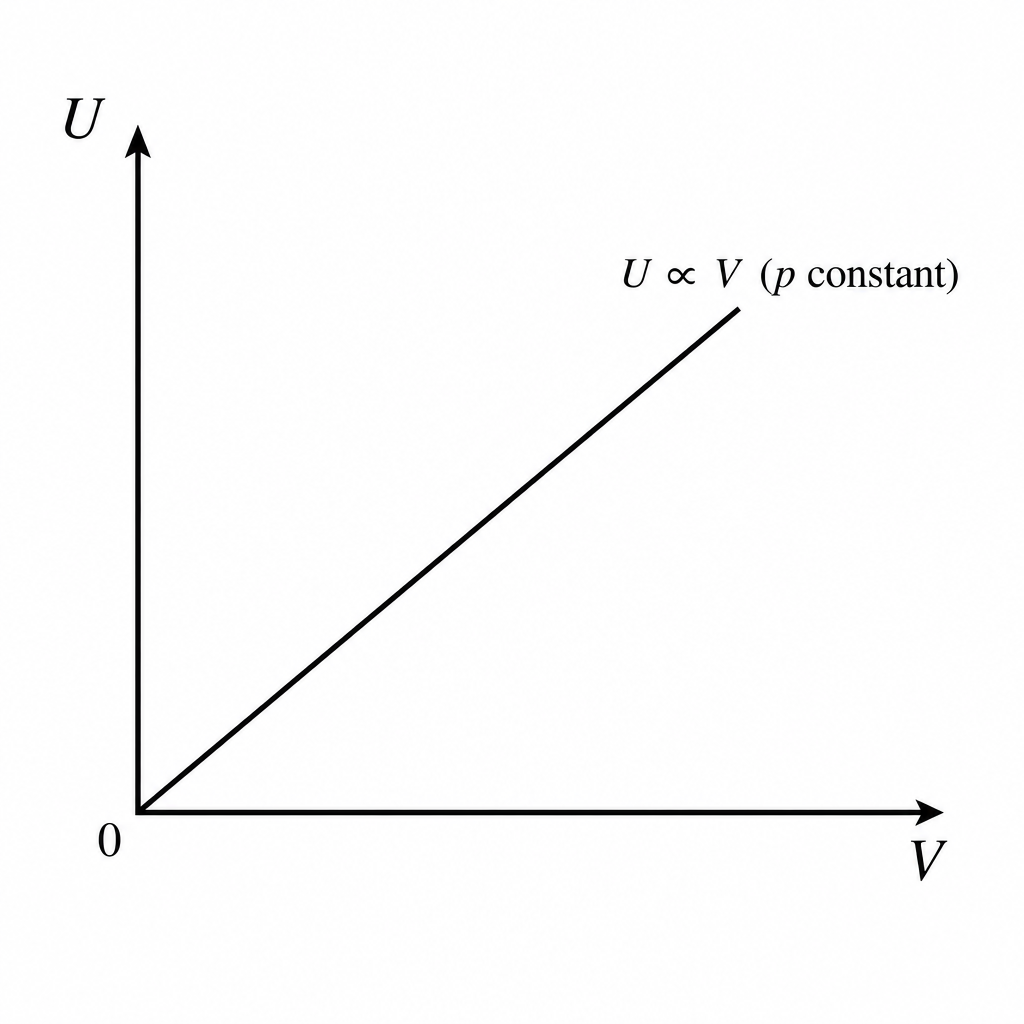
Straight line through origin with positive gradient (U ∝ V at constant p).
Background Concept
For an ideal gas, internal energy depends only on temperature because intermolecular potential energy is negligible. Using the kinetic theory result (as in part b), for the same gas sample:
So, for fixed , we have .
The ideal gas equation also tells us:
If is kept constant and is fixed (same sample), then .
Understanding the Question
You now change the volume while keeping pressure constant. You must sketch how internal energy varies with on axes labelled (vertical) against (horizontal).
So the task is to decide whether is constant, increases linearly, curves, etc., and draw the correct qualitative graph.
Approach
- Use with constant to find how depends on .
- Use the fact that for an ideal gas .
- Combine these to get as a function of and sketch.
Step-by-Step Reasoning
- Start with the ideal gas equation:
- Pressure is constant, and it is the same gas sample, so is constant. Rearranging:
So:
- For an ideal gas (using the same model as part (b)):
- Combine with :
- Therefore, as increases, increases in direct proportion: the – graph is a straight line with positive slope passing through the origin (because would imply and hence in this idealised model).
Key Takeaways
- For an ideal gas, depends only on .
- At constant , , so .
- Sketching graphs often comes from chaining proportionalities.
Common Mistakes
- Drawing constant with (that would be true if temperature were held constant, not pressure).
- Drawing an inverse curve (confusing constant pressure with constant temperature or constant ).
- Drawing a straight line not through the origin without justification.
Things to Be Careful About
- “Keeping its pressure constant” means fixed, not fixed.
- This is the same sample of gas: is constant.
- A sketch mark is usually for the correct shape (straight line) and correct intercept behaviour (through the origin).
Answer
Resonance is when a system is driven at a frequency equal to its natural frequency, so that energy transfer is maximum and the oscillation amplitude becomes maximum.
Resonance occurs when the driving frequency equals the natural frequency, giving maximum energy transfer and maximum amplitude.
Background Concept
Resonance is a feature of forced oscillations. A system that can oscillate (mass–spring, pendulum, vibrating string, etc.) has a natural frequency: the frequency at which it oscillates if displaced and released.
If the system is instead driven by an external periodic force (a “driver”) of frequency , the system responds by oscillating at (approximately) the driver’s frequency. The amplitude of that response depends strongly on how close is to the natural frequency.
Understanding the Question
The question asks for the meaning of resonance (2 marks). That normally requires:
- the condition: driving frequency equals natural frequency
- the effect: maximum amplitude (equivalently, maximum power/energy transfer from the driver to the oscillator)
Approach
Give a definition that includes both:
- matching of driving and natural frequencies
- resulting large/maximum amplitude due to maximum energy transfer.
Step-by-Step Reasoning
- A driver supplies energy each cycle.
- When equals the natural frequency, the driver’s force is in the correct timing (phase relationship) to add energy to the oscillator most effectively each cycle.
- Therefore the rate of energy transfer is greatest, so the amplitude reaches a maximum value (limited in practice by damping).
Key Takeaways
- Resonance happens in forced oscillations.
- Condition: .
- Consequence: maximum amplitude / maximum energy transfer.
Common Mistakes
- Saying only “large amplitude” without stating why/when (missing the frequency condition).
- Saying “frequency becomes maximum” (frequency is set by the driver; it’s the amplitude that peaks).
Things to Be Careful About
- In real systems, damping prevents the amplitude from becoming infinite; it is just a maximum at resonance.
A small ball is held in place using a stretched string. One end of the string is fixed to a wall and the other end is attached to a vibration generator, as shown in Fig. 4.1.
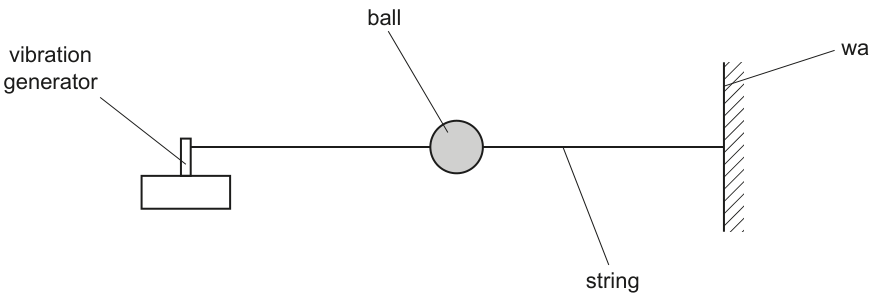
Initially, the vibration generator is switched off.
A student displaces the ball vertically and then releases it. Fig. 4.2 shows the variation of the displacement of the ball with time after it is released.
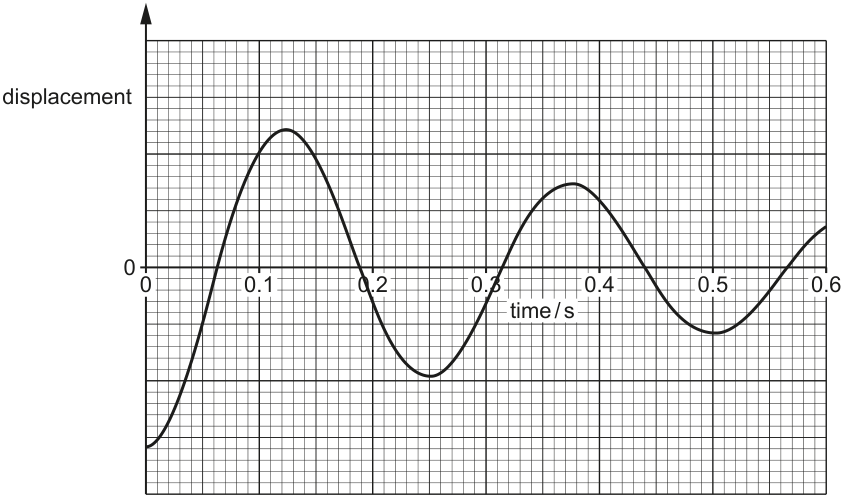
State the name of the phenomenon illustrated by the decrease in the amplitude of the oscillations in Fig. 4.2.
Answer
Damping (damped oscillations).
Damping.
Background Concept
In many oscillating systems, resistive forces (e.g. air resistance, friction) act opposite to the motion. These forces remove mechanical energy from the oscillation each cycle.
When this happens, the system’s oscillations continue but the amplitude gradually decreases: this is called damping.
Understanding the Question
Fig. 4.2 shows displacement against time with oscillations whose peaks get smaller with time. The question asks for the name of the phenomenon responsible for that decreasing amplitude.
Approach
Recognise the signature of damping: a sinusoidal-like oscillation with an envelope that decays with time.
Step-by-Step Reasoning
- The graph shows repeated oscillations.
- The maximum displacement (amplitude) gets smaller each cycle.
- This is the defining feature of damped oscillations.
Key Takeaways
- Decreasing amplitude over time on a displacement–time graph indicates damping.
Common Mistakes
- Writing “friction” or “air resistance” as the phenomenon (those are causes; the phenomenon is damping).
Things to Be Careful About
- “Damping” is the process; “damped oscillations” is also an accepted phrase.
Answer
Resistive forces (e.g. air resistance / internal friction in the string) do work on the ball, so mechanical energy is transferred to the surroundings (as heat/sound). Hence the energy of oscillation decreases and the amplitude falls with time.
Resistive forces dissipate energy to the surroundings, so the oscillation energy decreases and the amplitude falls.
Background Concept
For an oscillator, the total mechanical energy is the sum of kinetic and potential energy. For ideal SHM with no resistive forces, this energy stays constant and so does the amplitude.
With damping, a resistive force (often approximately opposite to velocity) removes energy:
- the resistive force does negative work on the oscillator
- energy is transferred to the surroundings, usually as thermal energy (and sometimes sound)
As energy decreases, the maximum displacement achievable (the amplitude) must also decrease.
Understanding the Question
The ball on a stretched string oscillates vertically after being released. The graph shows that the peak displacements get smaller as time goes on.
You are asked to explain why the amplitude decreases with time (2 marks): you need to mention energy loss (cause) and dissipation to surroundings (effect).
Approach
Explain damping in energy terms:
- identify resistive forces present
- state these forces remove mechanical energy each cycle
- conclude less energy means smaller amplitude.
Step-by-Step Reasoning
- As the ball moves, it experiences forces such as air resistance and internal friction/energy loss in the stretched string and at any attachment points.
- These forces oppose the motion, so they do negative work on the ball.
- Therefore the mechanical energy of the oscillation decreases each cycle.
- The lost energy is transferred to the surroundings (mainly thermal energy, possibly some sound).
- With less total energy, the oscillator cannot reach as large a maximum displacement, so the amplitude decays with time.
Key Takeaways
- Damping = resistive forces remove energy from an oscillator.
- Decreasing energy of oscillation implies decreasing amplitude.
Common Mistakes
- Saying only “there is friction” without linking to energy transfer and amplitude.
- Claiming the frequency decreases significantly; in light damping the frequency changes only slightly, but amplitude falls noticeably.
Things to Be Careful About
- Use the idea of energy dissipation (to heat/sound) for clear, mark-scheme-style explanation.
- Don’t confuse decreasing amplitude with decreasing period.
Working
From Fig. 4.2, time between peaks:
(also ).
Answer
4.0 Hz
Background Concept
For periodic oscillations:
- the period is the time for one complete cycle
- the frequency is the number of cycles per second
They are related by:
On a displacement–time graph, can be found by measuring the time between identical points on successive cycles (e.g. peak to peak).
Understanding the Question
The graph shows a damped oscillation, but it is still periodic. You need the frequency of the oscillation.
The given peaks are at approximately , and , which allows you to find .
Approach
- Find the period from the time separation between successive maxima.
- Calculate .
- Use a consistent value (or average) to reduce reading uncertainty.
Step-by-Step Reasoning
- First period estimate:
- Second period estimate:
- These agree, so take .
- Convert to frequency:
Key Takeaways
- Read from repeating features (peaks/troughs) on a time graph.
- Then use .
Common Mistakes
- Using the time from to the first peak as the period (that is typically for a sine-like motion).
- Reading peak positions inconsistently (e.g. peak to trough is ).
Things to Be Careful About
- Damping reduces amplitude, but the period usually stays approximately constant (especially for light damping).
- Use more than one cycle when possible to improve reliability (here, two intervals match well).
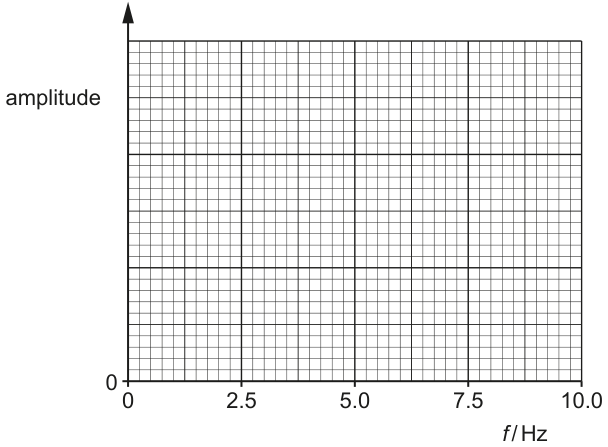
The vibration generator in (b) is switched on and its frequency of vibration is gradually increased from 0 to .
On Fig. 4.3, sketch the variation with of the amplitude of the oscillations of the ball.
Answer
Sketch a resonance curve: small amplitude at low , rising to a maximum at the natural frequency (), then decreasing at higher (peak is finite due to damping).
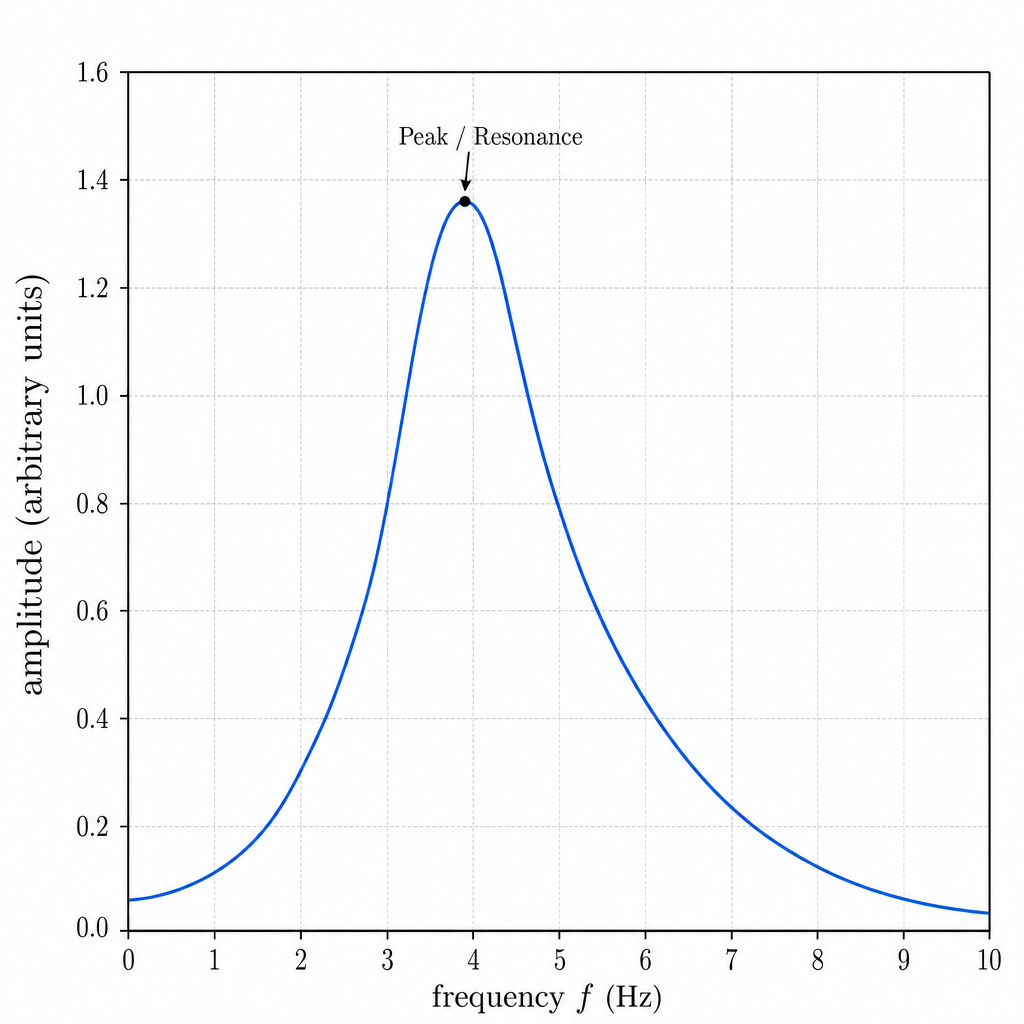
Resonance curve with a maximum at about 4 Hz and lower amplitudes at frequencies below and above this.
Background Concept
In forced oscillations, an oscillator is driven by an external periodic force of frequency .
The steady (long-term) amplitude depends on :
- far below or far above the natural frequency, the response amplitude is small
- near the natural frequency , energy transfer from the driver is most effective, so the amplitude is largest (resonance)
- with damping, the resonance peak is finite and broader (not infinitely tall)
Understanding the Question
You switch on the vibration generator and slowly increase its frequency from to . You must sketch how the ball’s oscillation amplitude varies with .
From part (b)(iii), the ball’s natural frequency is about , so the maximum on the graph should occur near .
Approach
- Use the standard amplitude–frequency response for a driven, damped oscillator.
- Place the resonance peak at .
- Ensure the curve is low at very small and very large .
Step-by-Step Reasoning
- At , the driver changes very slowly, so the system does not build up large oscillations → small amplitude.
- As increases towards , the driver supplies energy in step with the motion → amplitude increases.
- At , resonance occurs → maximum amplitude.
- For , the motion becomes increasingly out of phase with the driving force and energy transfer is less effective → amplitude decreases.
- Because damping is present (seen in part b), the resonance peak should not be infinitely sharp; it has a rounded top.
Key Takeaways
- Resonance curve: amplitude peaks at the natural frequency.
- Damping limits the maximum amplitude and broadens the peak.
Common Mistakes
- Drawing the maximum at (must be near the measured natural frequency ).
- Drawing a straight line increase with (the response must fall after resonance).
- Drawing an infinitely tall spike (real systems are damped).
Things to Be Careful About
- The sketch is qualitative, but the peak position should be consistent with part (b)(iii).
- Ensure axes are used correctly: amplitude on vertical axis, frequency on horizontal axis.
Answer
Electric field strength at a point is the force per unit positive charge placed at that point:
Electric field strength is force per unit positive charge at a point (E = F/q).
Background Concept
An electric field is a region where an electric charge experiences a force. The electric field strength at a point is defined by
where:
- is the electric force on a charge,
- is the charge placed at the point.
The definition uses a positive test charge, so the direction of is the direction a positive charge would be pushed.
Understanding the Question
You are asked to define electric field (in A Level exams this means electric field strength). So you should give the standard definition and (optionally) the equation connecting , and .
Approach
State the definition in words and/or give , making clear it is force per unit positive charge.
Step-by-Step Reasoning
- Start from the idea that a charge in an electric field experiences a force.
- Define field strength as force per unit charge:
- Mention “positive charge” to fix the direction convention.
Key Takeaways
- Electric field strength is defined by .
- The direction of is the direction of force on a positive test charge.
Common Mistakes
- Defining it as force per unit negative charge.
- Confusing electric field strength with potential difference .
Things to Be Careful About
- Use correct wording: “force per unit positive charge at a point”.
- Units: has units (or ).
Fig. 5.1 shows two parallel conducting plates that are in a vacuum. The plates are separated by a distance of and have a potential difference (p.d.) of between them.
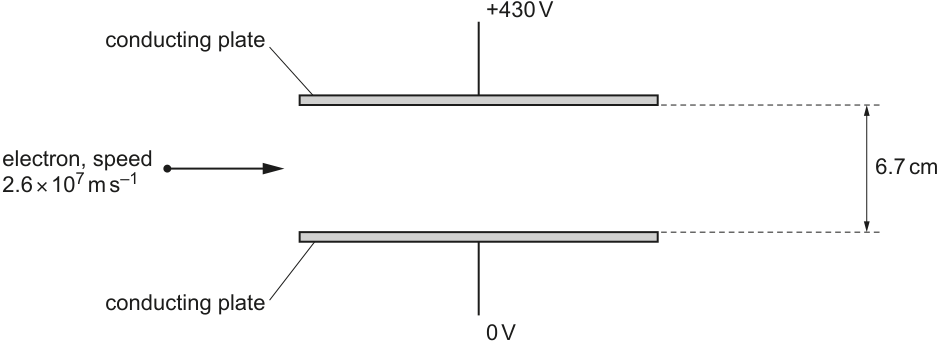
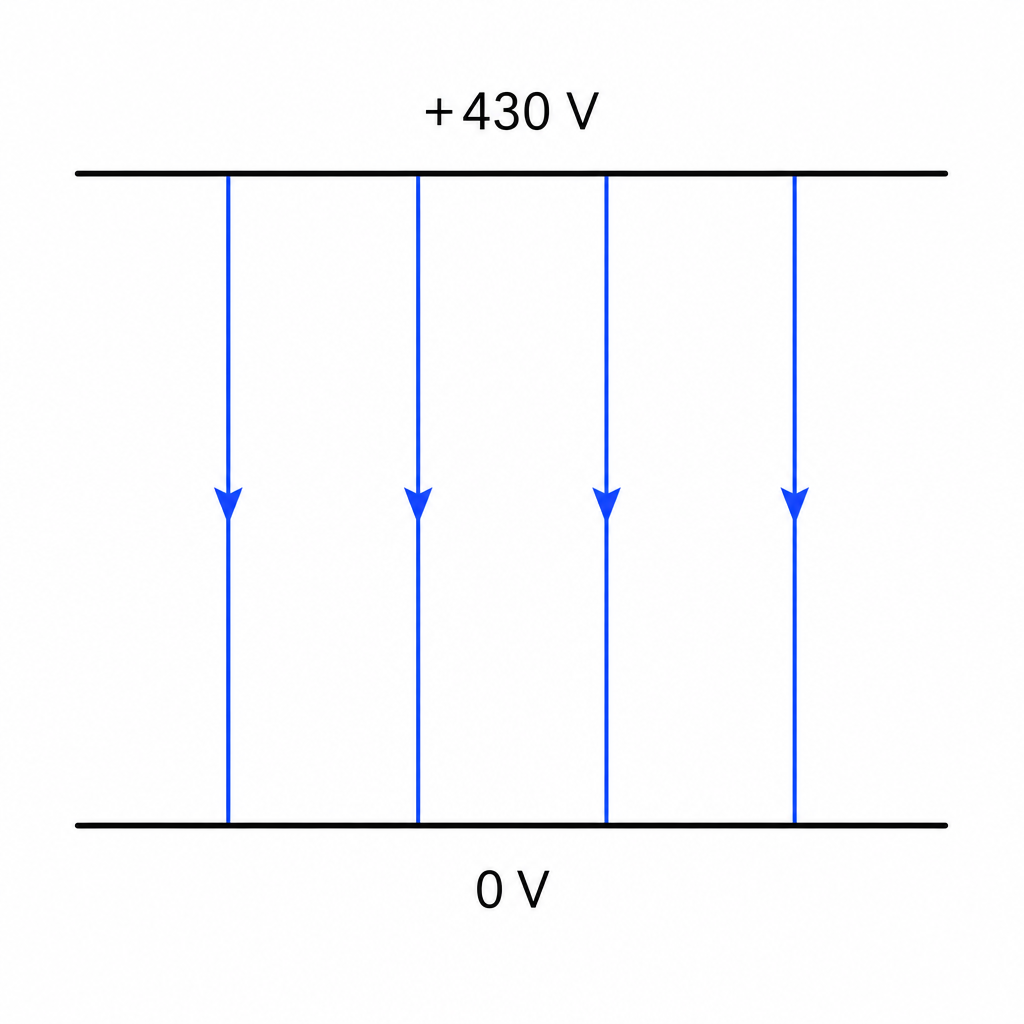
Answer
Four straight, parallel, equally spaced field lines perpendicular to the plates, with arrows from the plate to the plate.
Uniform field: straight parallel equally spaced lines from +430 V plate to 0 V plate.
Background Concept
Electric field lines are a visual way to represent an electric field:
- The direction of the field line shows the direction of force on a positive test charge.
- The spacing indicates relative field strength (closer = stronger).
- Between large parallel plates (away from edges) the field is approximately uniform, so the lines are straight, parallel, and equally spaced.
Field lines go from positive to negative, and also from higher potential to lower potential.
Understanding the Question
The diagram shows two parallel plates, top at and bottom at . You must draw four field lines between them.
Approach
Since the field between parallel plates is uniform:
- draw straight lines,
- make them perpendicular to the plates,
- include arrowheads showing direction from the positive plate to the lower potential plate.
Step-by-Step Reasoning
- Identify which plate is at higher potential: the top plate is .
- Electric field direction is from higher potential to lower potential (same as from positive to negative): top to bottom.
- Because it is uniform between parallel plates, draw several straight, parallel lines, equally spaced.
Key Takeaways
- Uniform field between parallel plates: straight, parallel, equally spaced lines.
- Direction: from plate (higher ) to lower .
Common Mistakes
- Drawing curved lines between plates (suggests non-uniform field).
- Forgetting arrowheads.
- Drawing arrows from the plate to the plate.
Things to Be Careful About
- Keep lines perpendicular to plates.
- Do not bunch lines together in the middle (would imply stronger field there).
Working
For uniform field,
Answer
6.4 × 10^3 N C^-1
Background Concept
Between parallel plates (ignoring edge effects), the electric field is uniform. The field strength is related to potential difference by
where:
- is the potential difference across the plates,
- is the separation between plates.
Units: is in (equivalently ).
Understanding the Question
You are given:
- separation
You must find between the plates.
Approach
Use the uniform-field relation , ensuring is in metres.
Step-by-Step Reasoning
- Convert distance:
- Substitute into :
- Quote with appropriate significant figures (limited by 2 s.f. in ):
Key Takeaways
- For parallel plates: .
- Always convert to .
Common Mistakes
- Using instead of (gives an answer 100 times too small).
- Omitting units.
Things to Be Careful About
- and are equivalent for electric field strength.
- Significant figures should usually follow the least precise given data.
An electron travels at a speed of towards the region between the plates, as shown in Fig. 5.1.
On Fig. 5.1, draw the path of the electron as it moves between and beyond the plates.
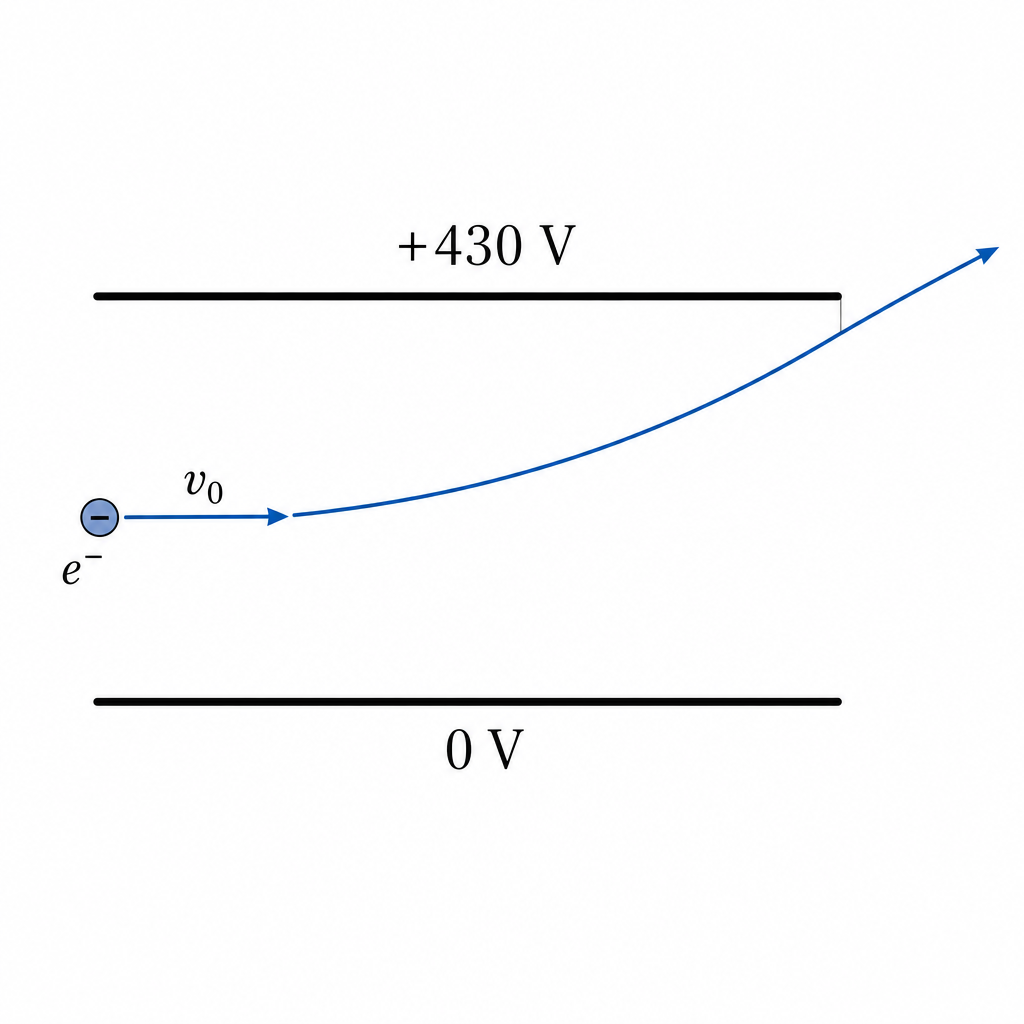
Answer
Electron curves upwards between the plates (towards the plate), then continues beyond the plates in a straight line along the tangent to the curve at exit.
Curves upward between plates, then straight-line continuation at exit.
Background Concept
A charge in an electric field experiences a force
- For a positive charge, the force is in the same direction as .
- For an electron (), the force is opposite to .
In a uniform field, the force (and hence acceleration) is constant in direction and magnitude, so the path while inside the plates is a parabola (like projectile motion) if the initial velocity has a component perpendicular to the acceleration.
Understanding the Question
The electron enters between the plates moving horizontally. The field between the plates is downward (from to ). You must sketch the electron’s path between and beyond the plates.
Approach
- Use the field direction to find the force direction on an electron.
- Constant sideways (horizontal) velocity + constant vertical acceleration gives a curved (parabolic) path.
- Once outside the plates, the field is (approximately) zero, so it travels in a straight line at constant velocity along the exit direction.
Step-by-Step Reasoning
- Field lines point downward from the top plate to the bottom plate.
- Electron has charge , so electric force is upward (opposite to ), i.e. toward the positive top plate.
- Therefore, as it moves to the right, it accelerates upward, producing a curve upward.
- After it leaves the region between the plates, there is no longer a significant electric force, so it continues in a straight line tangent to the path at the exit.
Key Takeaways
- Direction of force depends on the sign of charge.
- Uniform field gives constant acceleration, so trajectories are parabolic in the field region.
Common Mistakes
- Curving the path downward (forgetting the electron is negative).
- Drawing a curved path even after the electron has left the plates (there should be no force then).
Things to Be Careful About
- Keep the sketch realistic: gentle curvature (not required to be to scale) and a straight-line continuation after exit.
- The electron is attracted toward the positive plate.
A uniform magnetic field is now applied in the region of the electric field in Fig. 5.1, so that the electron in (b)(iii) travels undeviated through the region.
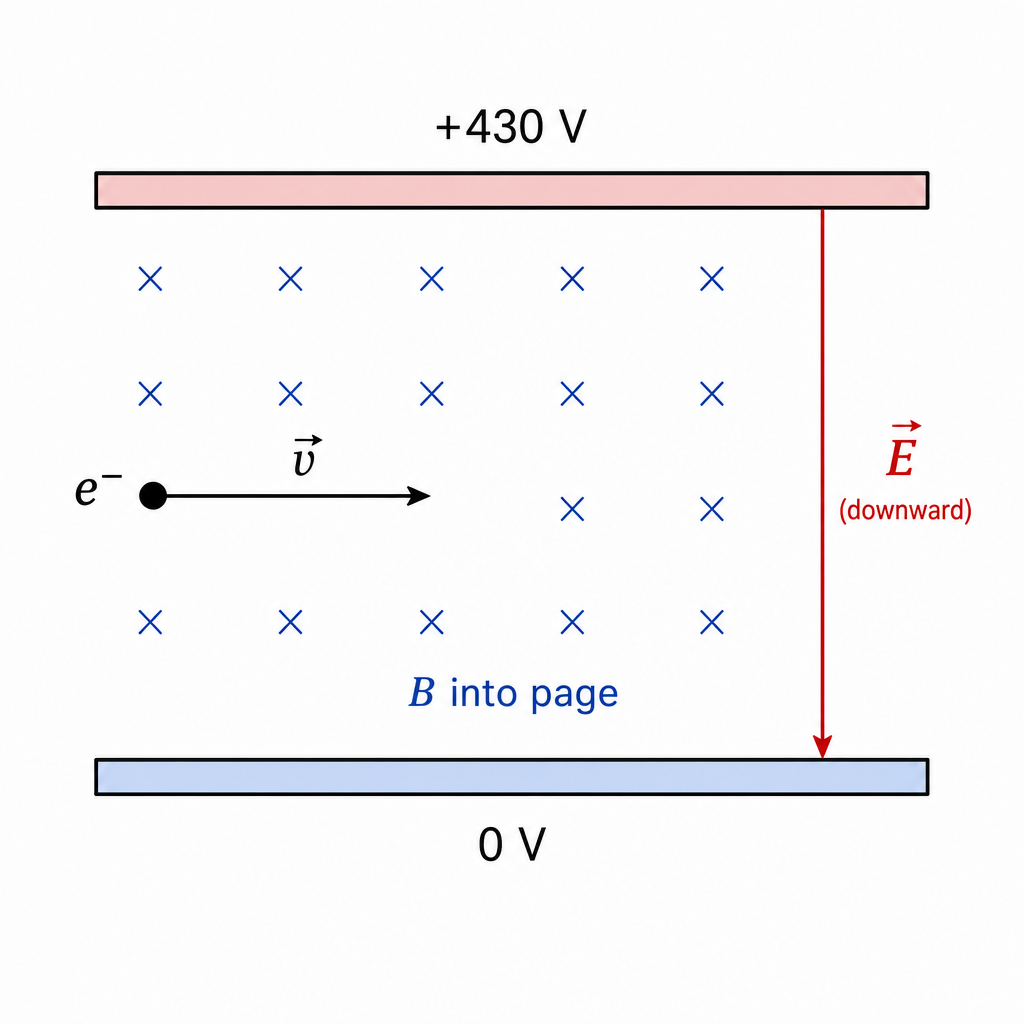
Answer
Magnetic field is into the page (so that the magnetic force on the electron is downward, opposing the upward electric force).
Into the page.
Background Concept
A moving charge in a magnetic field experiences a magnetic force
Key points:
- The force is perpendicular to both and .
- For a positive charge, direction is given by .
- For an electron (), the force direction is opposite to .
Understanding the Question
In part (b), the electron was deflected by the electric field. Now a uniform magnetic field is applied so that the electron travels undeviated through the region. You need the direction of .
The electron velocity is to the right. The electric field between the plates points downward, so the electric force on an electron is upward. Therefore the magnetic force must be downward to cancel it.
Approach
- Determine the direction of electric force on the electron.
- Require magnetic force to be opposite.
- Use with to choose direction (into/out of page).
Step-by-Step Reasoning
- Electric field is downward (from +430 V to 0 V).
- Electric force on electron:
Since , is upward.
3. For undeviated motion, need downward.
4. With to the right, choose so that points upward (then the electron’s force, opposite to that, is downward). This occurs when is into the page.
Key Takeaways
- Always include the sign of the charge when using .
- For straight-line undeflected motion: magnetic and electric forces must be equal and opposite.
Common Mistakes
- Forgetting the electron is negative and giving the opposite direction.
- Mixing up “into the page” and “out of the page”.
Things to Be Careful About
- State direction clearly using standard symbols: crosses () for into the page, dots () for out of the page.
- Ensure the magnetic force opposes the electric force, not the field direction itself.
Explain, with reference to the forces exerted by the two fields on the electron, why the path of the electron is undeviated.
Answer
The electric field exerts a force on the electron upward (). The magnetic field exerts a force downward ().
Since these forces are equal in magnitude and opposite in direction, resultant force is zero, so there is no acceleration and the electron is undeviated.
Electric and magnetic forces are equal and opposite, so resultant force is zero and no deflection.
Background Concept
An electron in crossed electric and magnetic fields can experience two forces:
- Electric force:
- Magnetic force (if moving):
If these forces are equal and opposite, the net force is zero, so acceleration is zero and the particle continues in a straight line at constant velocity.
Understanding the Question
The electron previously curved due to the electric field. Now a magnetic field is applied such that it travels straight through the region. You must explain this by referring to the forces from each field.
Approach
State:
- direction of the electric force on the electron,
- direction of the magnetic force on the electron,
- that they balance (equal magnitude, opposite direction), so the resultant force is zero and no deflection occurs.
Step-by-Step Reasoning
- The electric field between the plates is downward. For an electron (), the electric force is upward.
- With the chosen magnetic field direction, the magnetic force on the moving electron acts downward.
- When adjusted so that
the resultant force is
- Zero resultant force means zero acceleration (Newton’s 2nd law), so the electron’s velocity direction does not change: it is undeviated.
Key Takeaways
- Undeflected motion in crossed fields requires zero net force.
- Balance condition is .
Common Mistakes
- Saying “fields cancel” instead of “forces cancel” (the fields do not cancel; they both exist).
- Forgetting that magnetic force depends on velocity.
Things to Be Careful About
- Make clear you are talking about forces on the electron.
- Mention both magnitude (equal) and direction (opposite).
Determine the flux density of the uniform magnetic field. Give a unit with your answer.
= ______ unit ______
Working
For undeviated motion,
Answer
2.5 × 10^-4 T
Background Concept
In crossed fields, if is perpendicular to and is perpendicular to , the magnitudes of the forces are:
and (when ):
For no deflection, these must balance:
Understanding the Question
You already found the electric field strength between the plates in (b)(ii), and you are given the electron speed . You must calculate the magnetic flux density that makes the electron travel straight.
Approach
Use the balance condition (forces equal and opposite), cancel , and substitute values into .
Step-by-Step Reasoning
- Write the force balance for undeflected motion:
- Cancel the common factor :
- Substitute and :
- Quote to 2 s.f.:
Key Takeaways
- For a velocity selector (no deflection): .
- Unit of magnetic flux density is the tesla (T).
Common Mistakes
- Using instead of .
- Forgetting that only when .
- Missing the unit T.
Things to Be Careful About
- Use the speed in .
- Keep consistent significant figures with and .
Fig. 6.1 shows a capacitor of capacitance connected in series with a resistor of resistance .
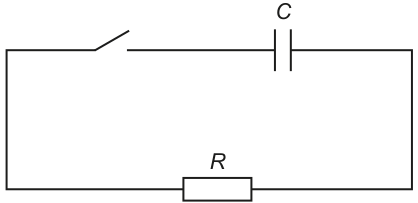
Initially the switch is open and there is a p.d. of across the capacitor.
At time , the switch is closed so that there is a current in the resistor.
Fig. 6.2 shows the variation of with .
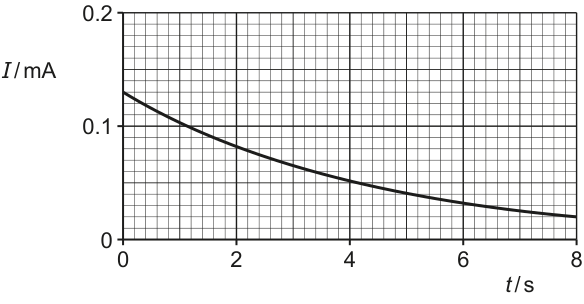
Answer
When the switch is closed, the p.d. across the resistor is initially so the current is initially maximum.
As the capacitor discharges, its charge and p.d. fall, so the p.d. across the resistor falls and hence decreases.
Since the capacitor discharge is exponential, decreases exponentially towards zero (rate of decrease becomes smaller with time).
Current decays exponentially to zero because the capacitor voltage (and hence p.d. across R) decreases exponentially during discharge.
Background Concept
For a capacitor discharging through a resistor:
- The capacitor voltage is related to charge by .
- The current in the circuit is related to how fast charge leaves the capacitor:
The discharge obeys an exponential law:
So the voltage also falls exponentially:
Because the resistor is the only resistance, the current is
and in this simple series discharge, , so
Understanding the Question
Initially, the capacitor has across it. When the switch is closed at , the capacitor starts to discharge through , producing a current in the resistor. The graph shows that current starts at some value and then falls with time.
You are asked to explain why the graph has that shape (why it is not a straight line, and why it approaches zero).
Approach
Connect the graph shape to how the capacitor’s p.d. changes during discharge:
- Use the fact that the resistor current is set by the p.d. across it: .
- Recognise that the p.d. across the resistor comes from the capacitor, and that decreases as the capacitor discharges.
- Recall that the discharge of a capacitor through a resistor is exponential, so must also fall exponentially.
Step-by-Step Reasoning
- At the instant the switch is closed, the capacitor still has the full across it. That means the p.d. driving current through the resistor is largest at , so the current is largest at .
- As current flows, charge leaves the capacitor plates. Since , the charge decrease implies the capacitor voltage decreases.
- The current at any time is . But the resistor’s p.d. is supplied by the capacitor during discharge, so .
- Therefore, as decreases, decreases.
- The key point for the shape is that (and ) does not decrease linearly: it decreases exponentially with time constant . Hence current follows
so the graph is a steep drop at first and then it flattens off, approaching zero but never going negative.
Key Takeaways
- In a discharging circuit, , , and all decay exponentially with the same time constant .
- The current is largest initially because the capacitor p.d. is initially largest.
- The current tends to zero because eventually the capacitor becomes nearly uncharged, so there is almost no p.d. to drive current.
Common Mistakes
- Saying “current decreases because resistance increases” (the resistance is constant).
- Claiming the current becomes zero at a fixed finite time; exponential decay approaches zero asymptotically.
- Forgetting to link the decreasing current to the decreasing capacitor p.d. via .
Things to Be Careful About
- Distinguish between why current falls (voltage falls as capacitor discharges) and why it is exponential (the governing differential equation leads to an exponential form).
- Avoid describing it as a straight-line decrease; the curve’s changing gradient is essential.
Use Fig. 6.2 to determine:
Working
From Fig. 6.2, at , .
Initially , so
Answer
9.2 × 10^4 Ω
Background Concept
At any instant in an discharge, the resistor current is set by Ohm’s law:
At (just after closing the switch), the capacitor still holds its initial p.d., so the resistor initially has the full driving p.d. across it.
Understanding the Question
You are told the capacitor initially has across it. The graph provides the current at (the initial current). Using those two pieces of information, you can find from .
Approach
- Read from the graph at .
- Convert mA to A.
- Use with .
Step-by-Step Reasoning
- From the graph, the y-intercept at is .
- Convert to amperes:
- Apply Ohm’s law at :
- Quote to an appropriate s.f. based on the graph reading: .
Key Takeaways
- The initial current in a discharge is .
- Always convert mA to A before using SI equations.
Common Mistakes
- Using at a later time instead of .
- Forgetting the when converting mA to A.
- Using instead of .
Things to Be Careful About
- Graph readings usually justify only 2 s.f.
- Ensure you use the initial capacitor p.d. () at , not a later smaller value.
Working
Initial current .
At ,
From Fig. 6.2, the time when is .
Answer
3.0 s
Background Concept
For exponential decay of current in an discharge:
The time constant is
A very useful definition is: at , the quantity has fallen to of its initial value:
Understanding the Question
The graph gives against for a discharging capacitor. You must extract the circuit time constant from that curve.
Approach
- Read the initial current from the graph.
- Calculate (or ).
- On the graph, find the time at which the current equals this value; that time is .
Step-by-Step Reasoning
- From the y-intercept at , .
- Compute the current at one time constant:
- Locate on the vertical axis, draw a horizontal line to the decay curve, then drop vertically to the time axis to read .
- From the provided curve, this occurs at about , so
(Any close value consistent with a careful graph reading would typically be credited.)
Key Takeaways
- For any exponential decay , the time constant is the time to fall to .
- Reading from a graph usually means using the (or 0.37) rule.
Common Mistakes
- Using instead of .
- Mixing up with (i.e. treating the decay as base-10).
- Reading the time where is almost zero rather than applying the defined criterion.
Things to Be Careful About
- Keep units consistent (here mA throughout is fine, since you are only scaling by ).
- Don’t round too aggressively before locating it on the graph; it can shift the time reading noticeably.
- Ensure you start from the correct at exactly .
Working
Answer
3.3 × 10^-5 F
Background Concept
The time constant of an circuit is defined as
It sets the timescale for the exponential discharge:
Once you know and , you can find the capacitance using algebra.
Understanding the Question
You have already determined (from part (b)):
- the resistance using
- the time constant using the point on the decay graph.
Now you must combine them to obtain .
Approach
Rearrange to make the subject:
Then substitute the numerical values with units.
Step-by-Step Reasoning
- Start with
- Rearrange for :
- Substitute and :
- Round appropriately (limited by graph readings):
Key Takeaways
- The link between the graph (time constant) and circuit component values is .
- Capacitance can be found once and are known.
Common Mistakes
- Using instead of .
- Forgetting that , so the units must come out as farads.
- Using an inconsistent or (e.g. mixing a later current value with ).
Things to Be Careful About
- Significant figures: and are obtained from a graph, so 2 s.f. is usually appropriate.
- Ensure is in ohms (not k\Omega) when used in the calculation unless you explicitly convert.
A circuit contains a power supply that provides a sinusoidal alternating input voltage . There is an output voltage across a load resistor , as shown in Fig. 7.1.
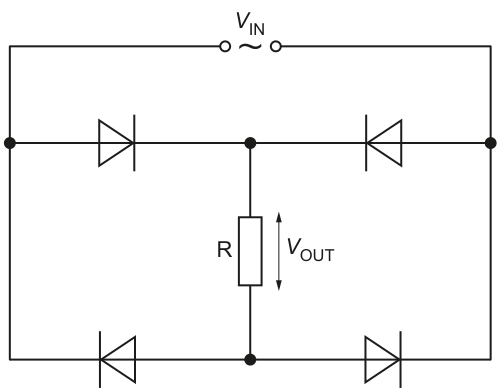
Answer
To rectify the a.c. input, giving a unidirectional (pulsating d.c.) output across (full-wave rectification).
To rectify the a.c. input, giving a unidirectional (pulsating d.c.) output across R (full-wave rectification).
Background Concept
A bridge rectifier uses four diodes arranged so that, for both halves of an a.c. input, the current through the load resistor flows in the same direction. The output is therefore not a steady d.c. value, but a pulsating d.c. waveform (the negative half-cycles are flipped to be positive).
Understanding the Question
You are shown a bridge rectifier circuit with an a.c. input voltage and an output voltage across a load resistor . The question asks what the circuit is for (i.e. what it does to the input).
Approach
Recognise the diode bridge arrangement and state its standard function: converting a.c. to a one-direction (unidirectional) output across the load.
Step-by-Step Reasoning
- In one half-cycle of the a.c. input, two diodes conduct and route current through in (say) the left-to-right direction.
- In the opposite half-cycle, the other two diodes conduct, but the circuit routes current through in the same left-to-right direction again.
- Therefore, the output p.d. across keeps the same polarity: this is full-wave rectification.
Key Takeaways
- A bridge rectifier produces a full-wave rectified (pulsating d.c.) output.
- “Unidirectional current through the load” is the key phrase.
Common Mistakes
- Saying it “smooths” the signal (that needs a capacitor/reservoir, not shown here).
- Saying it “increases voltage” (it does not; ideal diodes only redirect current).
Things to Be Careful About
- Use correct language: rectifies a.c. to d.c. (more precisely, pulsating d.c.).
- If asked for “full-wave” explicitly, include it.
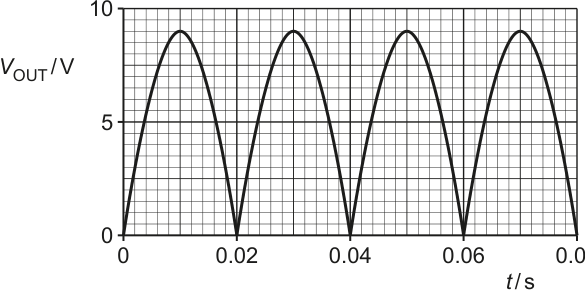
Fig. 7.2 shows the variation of with time .
Working
From Fig. 7.2, .
Answer
.
0.22 W
Background Concept
For a resistor, the instantaneous power converted to thermal energy is
Using Ohm's law , we can write power in forms that use either or :
When the voltage varies with time, the instantaneous power varies with time too, and the maximum power occurs when the magnitude of the voltage is at its maximum.
Understanding the Question
From the full-wave rectified output graph (Fig. 7.2), you are given a peak output voltage across the resistor . You must show the maximum power dissipated is .
Approach
- Read the peak output voltage from the graph.
- Use the resistor power relation with .
- Evaluate and round appropriately.
Step-by-Step Reasoning
- The graph indicates a peak output voltage of . This is the maximum instantaneous voltage across the resistor.
- For a resistor,
- Substitute:
- To 2 s.f., .
Key Takeaways
- Maximum power in a resistor corresponds to maximum instantaneous voltage: .
- Always include the unit (watts).
Common Mistakes
- Using but not finding correctly.
- Using instead of .
- Reading the wrong vertical value (e.g. using an average instead of the peak).
Things to Be Careful About
- Ensure you use the peak value from the graph, not an rms value.
- Quote the final power to sensible significant figures consistent with .
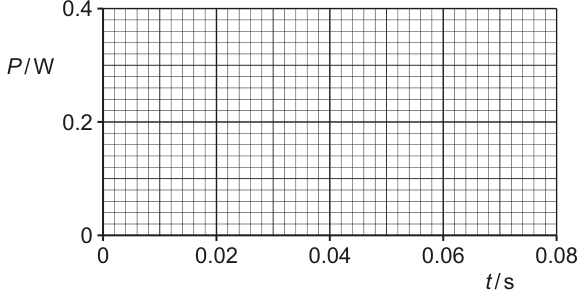
Working
For a resistor,
So is always positive, is zero when , and has maximum value when .
Answer
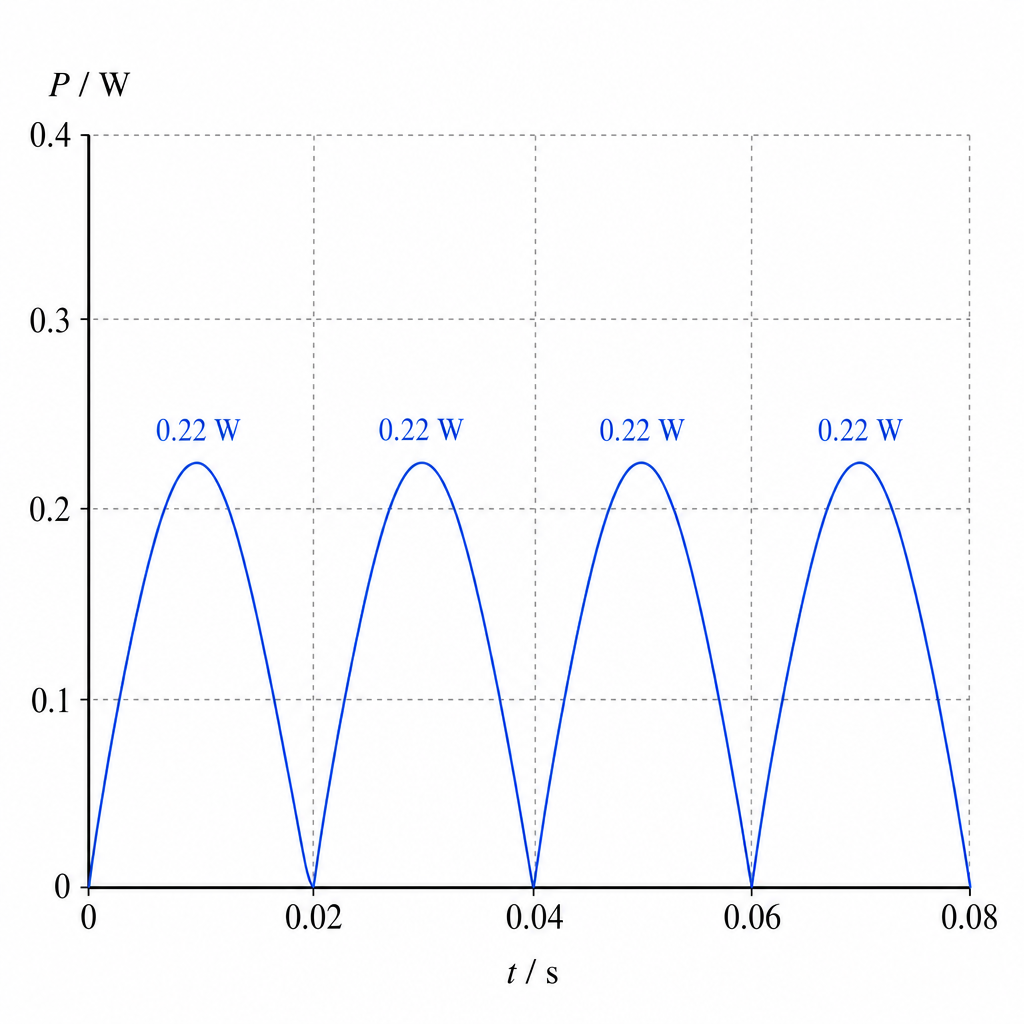
Sketch as shown: repeating -shaped pulses with peak and the same zeros/timing as .
See sketch: P ∝ V_OUT^2, always positive, peaks at 0.22 W with the same period as V_OUT.
Background Concept
For a resistor,
Squaring has two crucial effects:
- Negative voltages produce the same power as positive voltages of the same magnitude.
- The shape becomes more “peaked” because squaring makes values near the peak relatively larger compared with values near zero.
If is a (rectified) sine wave, then is proportional to .
Understanding the Question
You are given versus time for a full-wave rectified output. You must sketch the power dissipated in the load resistor versus time on the provided axes.
Key information inherited from the stem and earlier part:
- is a sequence of positive half-sine pulses (full-wave rectified).
- Peak .
- .
- From (b)(i), .
Approach
- Use .
- Mark the key times when ; at those times .
- At the times of voltage peaks, set power peaks to .
- Draw smooth curves between these points with a -like shape.
Step-by-Step Reasoning
- Start from the relationship:
- Identify zeros: whenever the rectified voltage waveform touches the time axis (at the ends of each half-cycle pulse), so
- Identify maxima: at each peak of , the power is
So every pulse in the power graph reaches .
- Shape: between 0 and the peak, is sinusoidal in shape; squaring gives a curve that rises more gently near zero and is more rounded near the top (a pulse). The power never goes negative.
Key Takeaways
- Instantaneous power in a resistor: .
- Squaring means power is always positive and peaks when voltage peaks.
- For rectified sine, the power waveform is a series of pulses.
Common Mistakes
- Drawing negative power during parts of the cycle (power in a resistor cannot be negative).
- Keeping the same shape as instead of squaring (power should be more “peaked”).
- Using the wrong peak power (must match from part (i)).
Things to Be Careful About
- Put peaks at the correct times (same times as voltage peaks).
- Ensure the graph touches at the same times .
- Use the given axis scale up to and label the peak at about .
Working
For a sinusoidal voltage across a resistor,
Answer
0.11 W
Background Concept
Instantaneous power in a resistor is
For a sinusoidal voltage (or its full-wave rectified form), the square involves :
The key average is
So the mean power is half the maximum power.
Understanding the Question
You already found the maximum power in (b)(i) as . You are now asked for the mean power dissipated in for the waveform shown (full-wave rectified sine).
Approach
Use the standard result that the time average of over a whole number of cycles is , hence .
Step-by-Step Reasoning
- The output voltage is sinusoidal in magnitude; power depends on , so it is proportional to .
- Over one complete pulse period, the average value of is .
- Therefore,
(Using more digits from (b)(i) would give , which rounds to .)
Key Takeaways
- For a sinusoidal voltage across a resistor: .
- Equivalently: .
Common Mistakes
- Averaging the voltage instead of averaging .
- Thinking rectification changes the mean power for the same peak voltage (it does not, because power depends on ).
Things to Be Careful About
- Make sure you average over a whole number of cycles.
- Quote the answer with unit and sensible significant figures.
The circuit of Fig. 7.1 is disconnected, and is connected directly across the power supply.
Explain, without calculation, how the mean power now dissipated in compares with the answer in (b)(iii).
Answer
The mean power is the same.
Power in a resistor is , so changing the negative half-cycles to negative values (instead of rectifying them) does not change and hence does not change the mean power.
The same.
Background Concept
For a resistor,
The crucial point is that power depends on the square of the voltage, so the sign of does not matter:
Therefore, for the same peak voltage, a sine wave and a full-wave rectified wave produce the same instantaneous power waveform , and hence the same mean power.
Understanding the Question
You remove the bridge rectifier and connect the resistor directly to the a.c. supply. You must compare the new mean power with the mean power found in (b)(iii), with no calculations.
Approach
Think about what changes when the bridge rectifier is removed:
- The voltage across will now be positive for half the time and negative for half the time.
- But power uses , so negative voltages still give positive power.
Hence the mean power is unchanged (assuming ideal diodes and the same peak voltage across ).
Step-by-Step Reasoning
- With the bridge: is always positive, but varies sinusoidally in magnitude.
- Without the bridge: alternates positive and negative (a standard sine wave).
- In both cases, the power is
- Squaring removes the sign, so the power variation is the same form in both situations.
- Therefore the time average (mean) power is the same as in (b)(iii).
(Practical note: in a real bridge rectifier, there are diode voltage drops so the rectified peak may be slightly smaller; then removing the diodes would slightly increase the mean power. Unless explicitly stated, exam questions usually treat diodes as ideal.)
Key Takeaways
- Mean power in a resistor depends on , not on the mean value of .
- Rectification changes the sign of voltage/current but not the power for the same voltage magnitude.
Common Mistakes
- Saying the mean power becomes zero because the mean voltage is zero (mean voltage is not what determines mean power).
- Claiming the mean power halves because “half the cycle is negative” (negative voltage does not mean negative power in a resistor).
Things to Be Careful About
- The comparison assumes the same peak magnitude across ; if the question mentioned diode drops explicitly, you would consider that effect.
- State the key physics link: (or ) to justify the comparison.
Answer
A photon is a quantum (discrete packet) of electromagnetic radiation.
It carries energy
A photon is a quantum (discrete packet) of electromagnetic radiation, with energy E = hf.
Background Concept
Electromagnetic (EM) radiation can be described using the photon model. In this model, EM energy is not transferred continuously, but in discrete bundles called photons.
Each photon has:
- energy
where is the Planck constant and is the frequency of the radiation.
Understanding the Question
The question asks for what a photon means (a definition). For 2 marks, you typically need both:
- that it is a discrete quantum/packet of EM radiation, and
- a key property such as its quantised energy .
Approach
Give the definition first (“quantum of EM radiation”), then add the standard energy relation to secure the second mark.
Step-by-Step Reasoning
- State that a photon is a discrete packet (quantum) of electromagnetic radiation.
- State that its energy depends on frequency, given by .
Key Takeaways
- Photons are quanta of EM radiation.
- Photon energy is proportional to frequency: .
Common Mistakes
- Describing a photon as “a ray of light” without saying it is quantised.
- Giving (not relevant here).
Things to Be Careful About
- “Photon” refers specifically to electromagnetic radiation.
- For full credit, include the idea of a discrete packet and a correct relation such as .
Fig. 8.1 shows a tube in which X-rays are produced at a metal target.
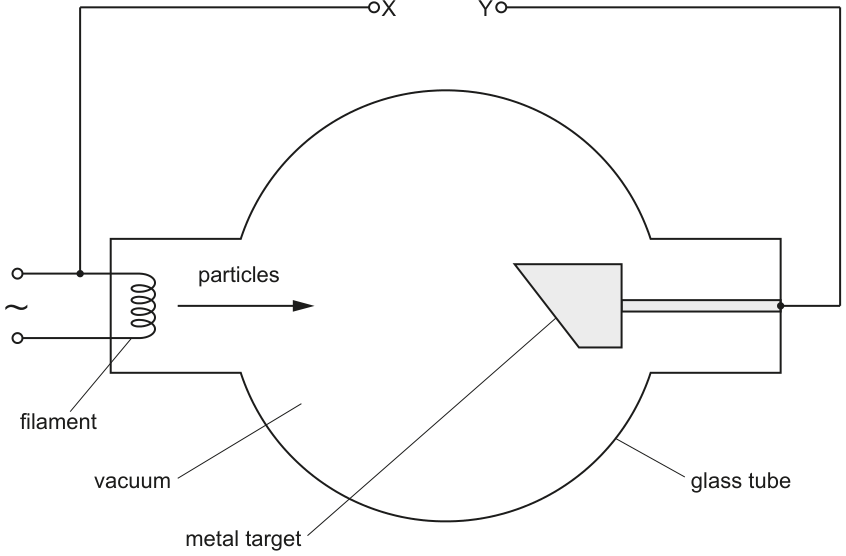
Particles are accelerated from the filament to the target by a constant high voltage applied across the terminals X and Y.
Answer
Electrons.
Electrons
Background Concept
In an X-ray tube, a filament is heated so that it emits electrons by thermionic emission. These electrons are then accelerated through a high potential difference towards a metal target (anode). When they decelerate rapidly in the target, X-rays are produced.
Understanding the Question
The diagram shows particles leaving the filament and travelling to the target under a high voltage. The question asks for the name of those particles.
Approach
Recall how an X-ray tube works: the heated filament is the electron source.
Step-by-Step Reasoning
- Heating the filament provides electrons with enough energy to escape the metal surface.
- Therefore the particles accelerated across the tube are electrons.
Key Takeaways
- X-ray tubes accelerate electrons from a cathode (filament) to an anode (target).
Common Mistakes
- Saying “protons” or “ions” (the filament emits electrons, not positive charges).
Things to Be Careful About
- The filament is the cathode (electron emitter) in a typical X-ray tube.
On Fig. 8.1, use and signs to label terminals X and Y to indicate the polarity of the high voltage.
Answer
is negative and is positive.
X is − and Y is +
Background Concept
An electron has charge , so it experiences a force opposite to the electric field direction. In an electric potential difference, electrons accelerate towards the more positive terminal (higher potential).
Understanding the Question
Electrons move from the filament to the target. The question asks you to label the terminals and with and so that the electric field accelerates electrons from the filament to the target.
Approach
- Identify where the electrons start (filament) and where they end (target).
- Electrons must be attracted to the positive terminal, so the target must be positive relative to the filament.
Step-by-Step Reasoning
- Electrons are emitted from the filament (cathode).
- They accelerate towards the metal target (anode).
- Therefore the target must be at higher potential (), and the filament at lower potential ().
- So terminal (filament side) is and terminal (target side) is .
Key Takeaways
- Electrons accelerate towards positive potential.
- In an X-ray tube: cathode (filament) is negative, anode (target) is positive.
Common Mistakes
- Reversing the polarity (forgetting electrons are negatively charged).
Things to Be Careful About
- Always use the sign of the moving charge: conventional current direction is not the same as electron motion direction.
For an accelerating voltage of in Fig. 8.1, determine:
the maximum energy, in MeV, of an X-ray photon produced at the target
maximum photon energy = ______
Working
Maximum photon energy:
Answer
0.032 MeV
Background Concept
In an X-ray tube, electrons are accelerated through a potential difference . The electrical potential energy lost by one electron becomes kinetic energy gained:
where .
The maximum energy photon is produced if one electron gives (approximately) all its kinetic energy to a single photon in the target.
Also:
Understanding the Question
The accelerating voltage is . The question asks for the maximum X-ray photon energy in MeV.
Approach
- Use .
- Recognise that a voltage in kV directly corresponds to energy in keV for a single electron.
- Convert keV to MeV.
Step-by-Step Reasoning
- An electron accelerated through gains energy .
- Therefore the maximum photon energy is:
- Convert to MeV:
Key Takeaways
- Accelerating a charge through gives energy .
- in kV corresponds to electron energy in keV.
Common Mistakes
- Writing (wrong by a factor of ).
- Converting to joules unnecessarily and then making a power-of-ten error.
Things to Be Careful About
- Use “maximum”: this assumes one photon takes essentially all the electron energy.
- Keep track of prefixes: , .
the maximum momentum of an X-ray photon produced at the target
maximum photon momentum = ______
Working
Answer
1.71 × 10^-23 N s
Background Concept
For a photon:
where is momentum, is energy, and is the speed of light.
To use this equation numerically with SI units, must be in joules.
Understanding the Question
You already found (or can find) the maximum photon energy from the accelerating voltage. You must calculate the corresponding maximum photon momentum.
Approach
- Find in joules using .
- Substitute into .
Step-by-Step Reasoning
- Convert the accelerating voltage energy to joules:
- Use the photon momentum relation:
- Units: .
Key Takeaways
- Photon momentum is proportional to photon energy: .
- Convert eV to joules when using SI constants.
Common Mistakes
- Using (photons have zero rest mass).
- Forgetting to convert to joules.
Things to Be Careful About
- Use .
- Ensure the final unit is (equivalently ).
the minimum wavelength of X-rays produced at the target.
minimum wavelength = ______
Working
Answer
3.9 × 10^-11 m
Background Concept
Photon energy is related to frequency by and wave speed by . Eliminating gives the key link between photon energy and wavelength:
So:
In an X-ray tube, the minimum wavelength corresponds to the maximum photon energy (because higher energy means shorter wavelength).
Understanding the Question
With accelerating voltage , electrons have a maximum kinetic energy . If that becomes photon energy, we get , and then the minimum wavelength is found from .
Approach
- Calculate from the voltage (in joules).
- Use .
Step-by-Step Reasoning
- Maximum photon energy:
- Substitute into the wavelength relation:
- Compute :
- Then:
So .
Key Takeaways
- Minimum wavelength corresponds to maximum photon energy.
- Use with SI units.
Common Mistakes
- Using (missing the factor ).
- Using in eV while using and in SI without conversion.
Things to Be Careful About
- The question asks for minimum wavelength (so use maximum energy).
- Powers of ten: keV to joules is often where errors occur.
Explain why X-rays can be used to produce images of internal body structures that have good contrast.
Answer
Different body tissues absorb (attenuate) X-rays by different amounts.
Bone (higher density / higher effective atomic number) absorbs more strongly than soft tissue, so fewer X-rays reach the detector through bone.
The detector records different transmitted intensities, producing light and dark regions and hence good contrast between structures.
X-rays are attenuated by different amounts in different tissues (bone absorbs much more than soft tissue), so the transmitted intensity varies across the body and the detector records this variation as contrasting light/dark regions.
Background Concept
X-ray imaging is based on attenuation (reduction in intensity) of X-rays as they pass through matter. If is the incident intensity and is the transmitted intensity, then thicker or more strongly absorbing material gives a smaller transmitted intensity. Different materials attenuate X-rays differently.
In general, attenuation is greater for:
- larger thickness,
- higher density,
- higher (effective) atomic number.
An image is formed because a detector (film or digital sensor) measures the transmitted intensity pattern across many rays.
Understanding the Question
The question asks why X-rays can produce images of internal body structures with good contrast. “Good contrast” means different structures show up as noticeably different brightness/greyscale on the final image.
Approach
Explain, in linked steps:
- different tissues attenuate X-rays differently,
- this leads to different transmitted intensities,
- the detector converts these intensity differences into light/dark regions (contrast).
Step-by-Step Reasoning
- X-rays passing through the body are partly absorbed/scattered; the intensity decreases.
- Bone contains calcium and is denser with higher effective atomic number than soft tissue, so it attenuates X-rays much more.
- Therefore, through bone, the transmitted intensity at the detector is much lower than through surrounding soft tissue.
- A detector (or photographic film) responds differently to different X-ray intensities, so regions behind bone and regions behind soft tissue appear with different brightness. This difference produces a high-contrast image of internal structures.
Key Takeaways
- Contrast arises from differences in attenuation between tissues.
- Bone attenuates X-rays much more strongly than soft tissue, so it is easily distinguished.
Common Mistakes
- Saying only “X-rays pass through the body” (penetration alone does not explain contrast).
- Not mentioning that different tissues absorb different amounts.
Things to Be Careful About
- Use the correct idea: contrast comes from transmitted intensity differences, not from reflection.
- Mention at least one physical reason for different attenuation (density / atomic number / thickness).
Answer
Half-life is the time taken for the number of undecayed nuclei (or the activity) of the isotope to fall to half its original value.
Time for the number of undecayed nuclei (or activity) to halve.
Background Concept
Radioactive decay is a random process in which unstable nuclei transform into other nuclei. The number of undecayed nuclei decreases with time.
The half-life is a way of describing how quickly this decrease happens.
Understanding the Question
You are asked for a definition of half-life for a radioactive isotope. There are no numbers to use; you just need a precise statement.
Approach
Give the standard Cambridge definition: “time taken for to reduce to its initial value”. It is also acceptable to define it using activity because is proportional to .
Step-by-Step Reasoning
- Consider an initial number of undecayed nuclei .
- Half-life is reached when the number remaining is .
- Since activity and , it is equivalently the time for the activity to halve.
Key Takeaways
- Half-life is a time interval.
- It can be defined using either number of nuclei or activity.
Common Mistakes
- Saying “time for half the nuclei to decay” without mentioning from the original number (can be ambiguous).
- Confusing half-life with the decay constant .
Things to Be Careful About
- Use “undecayed nuclei remaining” (or “activity”) and “falls to half its initial value”.
- Do not write “time for the mass to halve” unless you clearly link mass to number of nuclei remaining.
Radioactive isotope X decays to isotope Y.
A sample contains only nuclei of X at time . Fig. 9.1 shows the variation with of the numbers of nuclei of X and of Y as the sample decays.
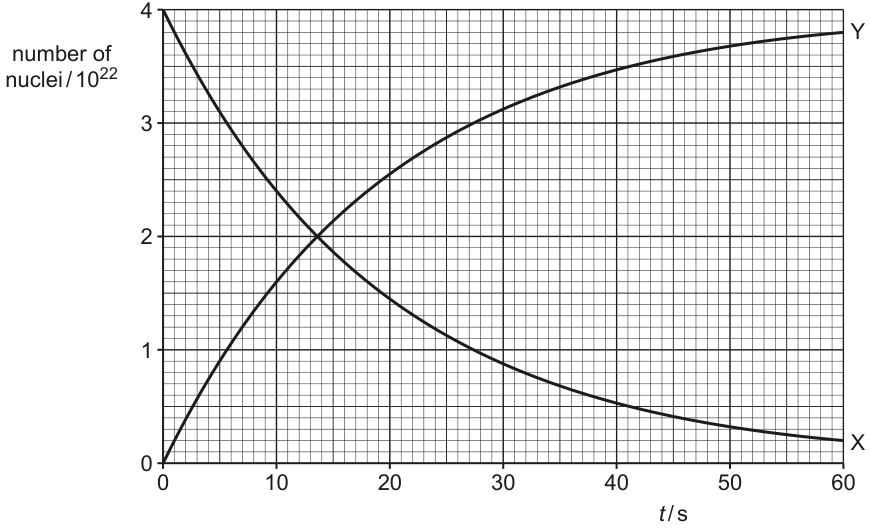
State the name of the quantity represented by the magnitude of the gradient of line X in Fig. 9.1.
Answer
Magnitude of gradient of line X represents the activity (decay rate) of isotope X, .
Activity (decay rate) of X.
Background Concept
For a radioactive sample, the activity is the number of decays per second.
If is the number of undecayed nuclei, then activity is defined by
The negative sign is because decreases with time. The magnitude of the gradient of an against graph is therefore the activity.
Understanding the Question
In Fig. 9.1, line X is a graph of number of nuclei of X, , against time .
The question asks what physical quantity is represented by the magnitude of the gradient of that curve.
Approach
- Recognise this is a “rate of change” question: gradient means .
- For radioactive decay, is activity.
- Since it asks for the magnitude, we ignore the negative sign.
Step-by-Step Reasoning
- The gradient of X on the – graph is .
- Because X is decaying, is negative.
- Activity is
- Therefore the magnitude of the gradient is
Key Takeaways
- Gradient on an – graph is a rate.
- For radioactive decay, that rate corresponds to activity.
Common Mistakes
- Saying “decay constant” (the decay constant relates to the fractional rate , not the gradient itself).
- Forgetting the question asks for magnitude and writing a negative quantity.
Things to Be Careful About
- Activity has unit (or Bq), whereas the gradient is “nuclei per second” which is numerically the same thing.
- The gradient changes with time (curve is not a straight line), so activity decreases as time increases.
State three conclusions about X or Y that may be drawn from Fig. 9.1. The conclusions may be qualitative or quantitative. Use the space below for any working that you need.
Answer
Any three conclusions, e.g.
- At , and .
- The curves intersect at with , so the half-life of X is .
- As increases, tends to while , so essentially all X eventually becomes Y (Y is stable / does not decay significantly on this timescale).
Example conclusions: N_X(0)=4.0×10^22, N_Y(0)=0; half-life of X = 14 s; eventually N_Y→4.0×10^22 and N_X→0 (Y stable on this timescale).
Background Concept
When a parent isotope X decays to a daughter isotope Y, the number of X nuclei decreases with time, typically exponentially. If Y is stable (or its half-life is very long compared with the time shown), the number of Y nuclei increases and tends towards the initial number of X nuclei.
If every X decay produces one Y nucleus, then (ignoring any subsequent decay of Y):
Also, half-life can be read from a decay curve as the time for to halve.
Understanding the Question
You are given a graph of and against time.
You must state three conclusions that are supported by features of the curves. These can be:
- numerical (values at given times, half-life), or
- qualitative (shape of curves, what happens at long times).
Approach
Pick three clear, unambiguous statements that can be directly read from the graph:
- initial values, 2) half-life from the halving point, 3) long-time behaviour / stability of Y / conservation of nuclei.
Step-by-Step Reasoning
-
Initial values: read values at .
- The X curve starts at on the axis labelled “”, so .
- The Y curve starts at , so .
-
Half-life of X: find when is half of its initial value.
- Half of is .
- The graph shows the two curves intersect at and .
- At that time, has fallen to half its initial value, so
- Long-time behaviour / stability of Y:
- As becomes large, the X curve approaches zero, meaning almost all original X has decayed.
- The Y curve approaches (the original number of X nuclei), implying each X nucleus becomes a Y nucleus and Y does not significantly decay during the time shown.
- This is consistent with throughout.
Other valid conclusions you could state include:
- X decays exponentially (shape of X curve).
- The activity of X decreases with time (slope magnitude of X decreases).
Key Takeaways
- You can read half-life directly from where halves.
- For a simple parent-daughter decay with stable daughter, stays constant.
- Exponential decay gives a curve whose slope becomes less steep with time.
Common Mistakes
- Claiming the half-life is (confusing the intersection time with “two half-lives” or misreading the axis).
- Saying Y decays faster because it increases quickly at first (increase in Y is due to production, not its own decay).
- Forgetting the axis scale factor of .
Things to Be Careful About
- Quote values with the correct power of ten: “”, not just “2.0”.
- “Y is stable” is an inference from the curve tending to a constant; phrase it as “does not decay significantly on this timescale” to be safe.
- Ensure your conclusions are actually supported by the graph, not general nuclear facts.
The mass of radioactive isotope X in the sample in (b) is at time .
Determine the nucleon number of isotope X.
nucleon number = ______
Working
From Fig. 9.1 at :
Mass of one nucleus:
Using nucleon mass :
Answer
Nucleon number
11
Background Concept
The nucleon number (mass number) is the total number of protons + neutrons in a nucleus.
A nucleus has mass approximately equal to times the nucleon mass (proton/neutron mass), because each nucleon has mass about
(The actual nucleus mass is slightly smaller due to binding energy, but for finding an integer nucleon number this approximation is sufficient.)
Understanding the Question
You are told the total mass of isotope X in the sample at is .
From part (b) / the graph, at the sample contains only X, so the number of X nuclei present initially is the initial value on the X curve:
.
You must find the nucleon number of isotope X.
Approach
- Read at from the graph.
- Find mass per nucleus: .
- Divide by nucleon mass to estimate how many nucleons are in each nucleus:
Then round to the nearest whole number (since nucleon number is an integer).
Step-by-Step Reasoning
- Number of nuclei at
From the graph, curve X starts at 4.0 on the scale of :
- Mass per nucleus
Total mass is , shared among identical nuclei:
Do the powers of ten carefully:
- Convert mass per nucleus to nucleon number
Divide by nucleon mass :
Since must be an integer:
Key Takeaways
- You can determine a nucleus’s mass from total mass divided by number of nuclei.
- Nucleon number is found by comparing nucleus mass with the mass of one nucleon.
- Always round to an integer for nucleon number.
Common Mistakes
- Using (the intersection value) instead of at .
- Dropping the scale factor from the graph.
- Rounding to instead of (must be the nearest integer).
Things to Be Careful About
- Keep powers of ten consistent when dividing.
- Use an appropriate nucleon mass (typically ).
- The slight difference between nuclear mass and (binding energy) is not large enough to change the nearest integer here.
Answer
Luminosity is the total energy emitted per unit time (total power output) by a star, over all wavelengths.
Unit: .
Total power (energy per unit time) emitted by the star, in W.
Background Concept
Luminosity is an intrinsic property of a star: it tells you how much energy the star emits every second.
Because it is energy per unit time, it is a power:
- energy has unit joule,
- time has unit second,
- so luminosity has unit .
It is not the same as what an observer measures at Earth, because the measured intensity decreases with distance.
Understanding the Question
You are asked to state what is meant by the luminosity of a star. This is asking for the definition of (an intrinsic property), not the apparent brightness or flux measured by an observer.
Approach
Give a concise definition: “total energy emitted per unit time” or “total power output”, and include that it is over all wavelengths.
Step-by-Step Reasoning
- A star emits radiation (electromagnetic energy).
- The rate at which energy is emitted is power.
- Therefore luminosity is the star’s total power output, summing over all wavelengths and directions.
Key Takeaways
- Luminosity is intrinsic to the star.
- is a power, measured in watts.
Common Mistakes
- Defining luminosity as “brightness seen by the observer” (that is flux or intensity, depends on distance).
- Forgetting that luminosity is total (all wavelengths), not just at one wavelength.
Things to Be Careful About
- Use “power” or “energy per second” explicitly.
- If a unit is requested or helpful, give .
Explain how a standard candle in a distant galaxy can be used to determine the distance of the galaxy from an observer.
Answer
A standard candle has known luminosity .
Measure the flux (apparent brightness) received by the observer.
Use
so
Use known luminosity L of the standard candle and measured flux F, with F = L/(4πd^2) so d = √(L/(4πF)).
Background Concept
For an isotropic source (emitting equally in all directions), the emitted power spreads out over the surface of a sphere of radius .
Area of that sphere:
Flux (sometimes called radiant flux intensity) is power received per unit area:
So flux decreases with the square of distance (inverse-square law).
A “standard candle” is an astronomical object whose luminosity is known (because its type has a known absolute luminosity).
Understanding the Question
The question asks how observing a standard candle in a distant galaxy lets you find the galaxy’s distance. You are expected to connect:
- known intrinsic luminosity of the candle,
- measured flux at Earth,
- inverse-square law to solve for distance .
Approach
- Identify that the standard candle provides a known .
- State that we measure (apparent brightness) at the observer.
- Use and rearrange for .
Step-by-Step Reasoning
- Because the candle’s luminosity is known, the only unknown in is once is measured.
- Rearranging:
- The distance to the standard candle is then the distance to the galaxy containing it (to a good approximation).
Key Takeaways
- Standard candle gives known .
- Measure and apply inverse-square law.
- Distance follows from a single rearrangement.
Common Mistakes
- Saying “use redshift” (not what a standard candle method is).
- Confusing luminosity with flux .
- Missing the square root when solving for .
Things to Be Careful About
- is power per unit area at the observer.
- The factor must be included for isotropic emission.
- The method assumes negligible absorption/extinction or that it has been corrected for.
The Sun has a radius of and a surface temperature of .
Light from the Sun is observed to have a peak intensity at a wavelength of .
Calculate the luminosity of the Sun. Give a unit with your answer.
luminosity = ______ unit ______
Working
Stefan-Boltzmann law:
Answer
3.85 × 10^26 W
Background Concept
A star’s luminosity can be related to its surface temperature if it behaves approximately like a black body.
For a black body, the power emitted per unit area (the intensity at the surface) is given by the Stefan-Boltzmann law:
where:
- is power per unit area ()
- is absolute temperature in kelvin.
The star’s total power output (luminosity) is then
Understanding the Question
You are given the Sun’s radius and its surface temperature .
You must calculate the Sun’s luminosity and state its unit. (The wavelength information is not needed for this particular calculation.)
Approach
Use the Stefan-Boltzmann expression:
- Calculate the surface area .
- Calculate .
- Multiply by .
- Quote in watts.
Step-by-Step Reasoning
Start with
Substitute :
Surface area:
Now evaluate :
Multiply to get emitted power per unit area:
Finally multiply by area:
This matches the known order of magnitude for the Sun’s luminosity (), which is a useful sanity check.
Key Takeaways
- Use for a (black-body) star.
- Keep SI units: in metres, in kelvin.
- Final unit of luminosity is .
Common Mistakes
- Using without multiplying by surface area.
- Using diameter instead of radius.
- Using in degrees Celsius instead of kelvin.
- Arithmetic slips with the power and indices.
Things to Be Careful About
- Quote with correct powers and units.
- When squaring and raising to the fourth power, keep track of standard form.
- Give the final answer to a sensible number of significant figures (typically 3 s.f. here).
Another star emits radiation that has a peak intensity at a wavelength of .
Determine the surface temperature of this star.
surface temperature = ______
Working
Wien’s law:
Answer
4.65 × 10^3 K
Background Concept
A star that approximately behaves as a black body emits a continuous spectrum with a peak at some wavelength .
Wien’s displacement law relates the peak wavelength to the absolute temperature:
where .
So a hotter star has a smaller (bluer) peak wavelength, and a cooler star has a larger (redder) peak wavelength.
Understanding the Question
You are told that another star’s radiation has peak intensity at . You must find its surface temperature.
The key is to:
- convert to ,
- apply Wien’s law and rearrange for .
Approach
- Write Wien’s law .
- Convert into metres.
- Rearrange: .
Step-by-Step Reasoning
Convert wavelength:
Use Wien’s law:
Compute powers of ten:
Compute the numerical factor:
So
This is cooler than the Sun (which peaks at a shorter wavelength), which is consistent with the longer peak wavelength of .
Key Takeaways
- Wien’s law: .
- Always convert to before substituting.
- Longer peak wavelength means lower temperature.
Common Mistakes
- Forgetting to convert to , giving a temperature too small by a factor of .
- Using with the wrong unit (it must be ).
- Mixing up the rearrangement and calculating .
Things to Be Careful About
- Keep standard form and check the power of ten carefully.
- Quote the final temperature in kelvin, not degrees Celsius.
- Use an appropriate number of significant figures (typically 3 s.f. to match the given wavelength).