Physics 9702/51 — May/June 2023
Cambridge A-Level · Planning, Analysis and Evaluation · worked solutions for every part, with the mark scheme
Topics Analysis, Conclusions and Evaluation · Planning
A wooden cube of mass is placed on an inclined plane. The cube is attached to a cylinder of mass using string that passes over a pulley, as shown in Fig. 1.1.
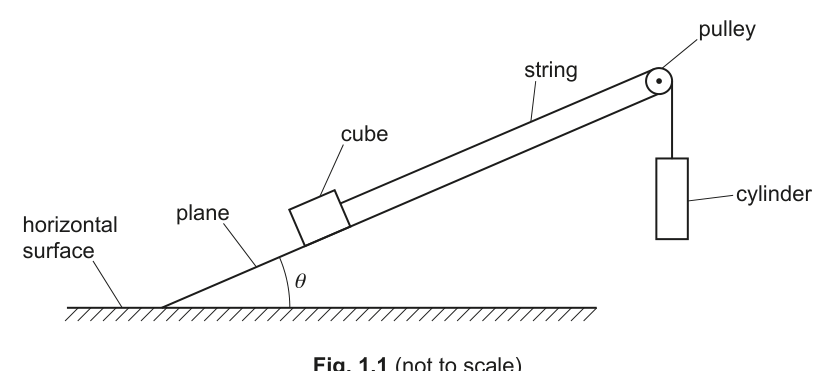
The angle between the plane and the horizontal surface is . Initially the cylinder is held at rest.
The cylinder is released. The time for the cylinder to fall a distance is .
It is suggested that is related to by the relationship
where and are constants.
Plan a laboratory experiment to test the relationship between and .
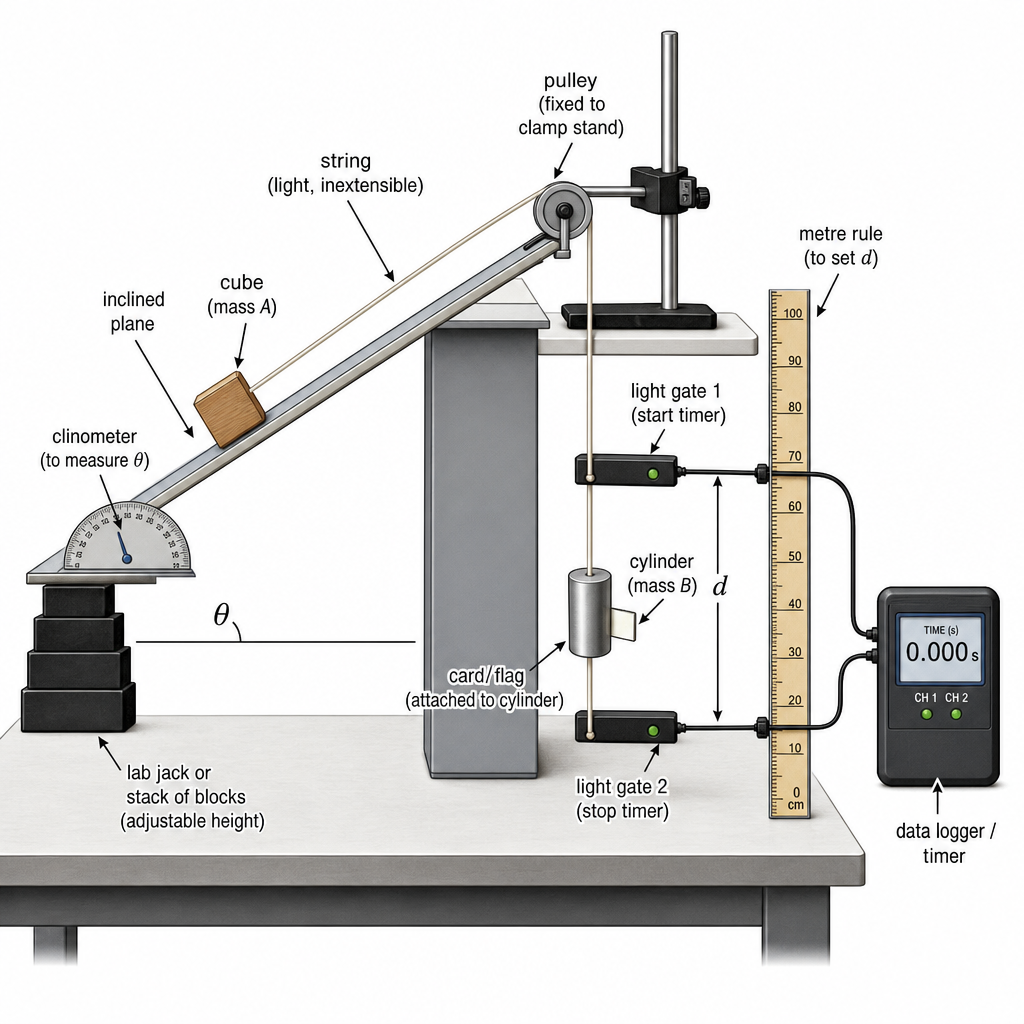
Draw a diagram showing the arrangement of your equipment.
Explain how the results could be used to determine values for and .
In your plan you should include:
- the procedure to be followed
- the measurements to be taken
- the control of variables
- the analysis of the data
- any safety precautions to be taken.
Answer
Variables
- Independent variable: (angle of the plane).
- Dependent variable: (time for the cylinder to fall distance ).
- Controlled variables: and (masses), (fall distance), same cube face/surfaces (friction), same string and pulley, same release method and start position.
Apparatus / arrangement
Inclined plane with adjustable height, pulley at top, light inextensible string, wooden cube (mass ) on plane, hanging cylinder (mass ), clamp stand, metre rule, clinometer/protractor, top-pan balance, two light-gates + data logger (or electronic timer), marker to set .
Procedure and measurements
- Measure masses (cube) and (cylinder) with a balance.
- Set the plane to a chosen angle using a clinometer/protractor; record .
- Choose and fix a fall distance (e.g. ) measured vertically with a metre rule; mark the start and end positions for the cylinder.
- Hold the cylinder at the start position with the string taut and cube at a fixed start line on the plane.
- Release the cylinder without a push (e.g. quick-release clamp/electromagnet). Start timing as the cylinder begins to move and stop timing when it has fallen distance (e.g. first light-gate at start, second light-gate at the position).
- Record . Repeat at least 3 times for the same and take mean .
- Change over a suitable range (at least 6 values), keeping , and the same each time.
Analysis (to test the relationship and find and )
Given
For each run calculate:
Plot a graph of (vertical axis) against (horizontal axis).
A straight line confirms the suggested relationship.
From :
Hence
Safety
- Secure the pulley/plane so it cannot slip; keep feet/hands clear of the falling mass.
- Prevent the cylinder hitting the floor violently (use a tray/soft stop) and do not use an excessive height.
- Keep the area below the cylinder clear; check the string is not frayed.
See working
Background Concept
The relationship given is already in a form that suggests a straight-line graph. In general, if you can write an equation as
then plotting against should give a straight line whose gradient is and whose y-intercept is .
Here the suggested relationship is
The key idea is:
- you can measure for different values of while keeping other quantities fixed,
- then you can compute derived quantities ( and ),
- then you use a graph to extract the constants and from gradient and intercept.
Understanding the Question
You have a cube on a slope connected by a string over a pulley to a hanging cylinder. You release the cylinder from rest and measure the time for it to fall a fixed distance .
You are asked to plan an experiment to test how depends on (the slope angle). Specifically, you must:
- describe what you will vary and what you will measure,
- describe how to keep other factors constant (fair test),
- describe what graph/data processing you will do,
- show how to determine numerical values of two constants, and .
Approach
- Choose as the independent variable: set several different angles.
- For each , measure the time for a fixed fall distance .
- Convert the equation into the straight-line form by defining
- Plot against . If the model is correct, the points lie close to a straight line.
- Use the measured gradient and intercept to calculate and .
- Improve reliability: repeat timings, average, use light-gates or data logging, and control frictional conditions.
Step-by-Step Reasoning
1) Decide what to vary and what to measure
- Vary by changing the height of one end of the ramp.
- Measure , the time taken for the cylinder to fall a distance .
- Keep constant (choose a convenient value and always time over that same distance).
2) Set up a timing method that is accurate and repeatable
The most reliable method is two light-gates with a data logger:
- Put one light-gate at the start position to start the timer when the cylinder begins to fall.
- Put the second light-gate exactly at the position corresponding to a vertical fall of .
- Attach a card/flag to the cylinder so it reliably triggers the gates.
This avoids reaction-time error from a hand-held stopwatch.
3) Control of variables (fair test)
To ensure changes in are due only to changing :
- Use the same cube and cylinder throughout so and are constant.
- Use the same string and pulley; ensure the string length is sufficient and remains taut at release.
- Keep the cube on the same face and do not change surfaces (friction affects the motion, and would change the constant effectively).
- Keep the start position fixed each time (same initial conditions).
- Ensure the pulley rotates freely; check alignment so the string does not rub on the pulley side.
4) Collect sufficient data
For each angle :
- record (in degrees or radians, but you will use in calculation),
- time at least 3 repeats and calculate the mean .
Use at least 6 values of across a sensible range (e.g. not so small that motion is too slow/sticky, and not so large that motion is too fast to measure cleanly).
5) Linearise and plot
Start from
Define
and
Then
So the graph of against should be a straight line.
- If you do get a straight line within scatter/uncertainty, that supports (tests) the suggested relationship.
- The gradient gives information about .
- The y-intercept gives information about .
6) Extract and
From the straight-line fit :
and
Measure and from the best-fit line (large triangle for ), then substitute the measured masses and .
Key Takeaways
- Good plans identify independent/dependent/control variables clearly.
- Turn the given relationship into so a straight-line graph tests it.
- Choose and so that the gradient and intercept map directly to the constants.
- Improve timing reliability (light-gates, repeat readings, average).
Common Mistakes
- Plotting against directly: the suggested model is linear in versus , not in versus .
- Forgetting to keep constant, which changes independently of .
- Not stating how and come from gradient/intercept (must show the algebraic link).
- Using too few angles or no repeats, giving weak evidence for a straight-line relationship.
- Stopwatch timing without addressing reaction time (often limits accuracy).
Things to Be Careful About
- Use vertical fall distance as stated; mark positions carefully and measure with a ruler/metre rule.
- Ensure release without an initial push (a push changes the initial velocity, affecting ).
- Keep frictional conditions unchanged: dust, different cube face, or different ramp surface can change results.
- When calculating , ensure the calculator is in the correct angle mode.
- When finding gradient, use a large triangle on the best-fit line and calculate (not ).
The rest of this paper
1 more questions- Q2Analysis, Conclusions and Evaluation15M