Physics 9702/52 — February/March 2023
Cambridge A-Level · Planning, Analysis and Evaluation · worked solutions for every part, with the mark scheme
Topics Analysis, Conclusions and Evaluation · Planning
An electric pump is placed in a container of liquid. A model wind turbine is connected to the pump by a cable, as shown in Fig. 1.1.
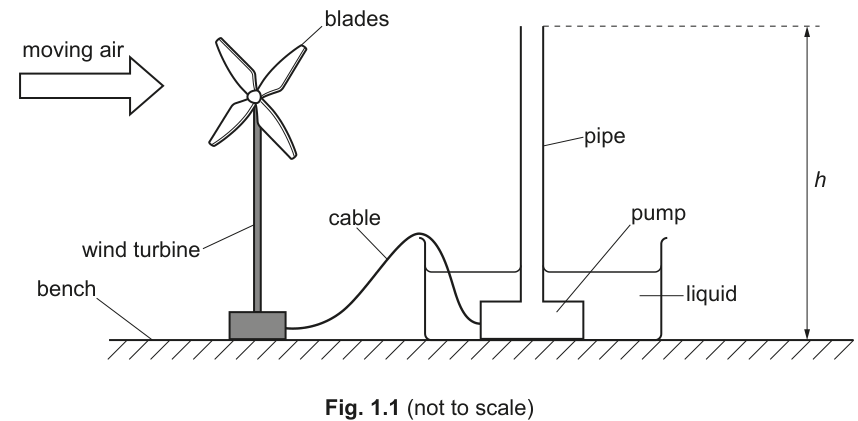
The turbine is placed in moving air. As the turbine blades turn, electricity is generated and the pump pushes liquid through a vertical pipe.
The frequency of rotation of the turbine blades is . The height the liquid moves is . The mass per unit time of the liquid leaving the top of the pipe is .
It is suggested that is related to by the relationship
where is the acceleration of free fall, and and are constants.
Plan a laboratory experiment to test the relationship between and .
Draw a diagram showing the arrangement of your equipment.
Explain how the results could be used to determine values for and .
In your plan you should include:
- the procedure to be followed
- the measurements to be taken
- the control of variables
- the analysis of the data
- any safety precautions to be taken.
Variables
- Independent variable: (frequency of rotation of turbine blades).
- Dependent variable: (mass of liquid leaving per unit time).
- Control variables: height (keep fixed), same pump and pipe, same liquid (density/viscosity), same turbine and electrical connection, same outlet arrangement, minimise temperature change, ensure steady flow before readings.
Apparatus / diagram
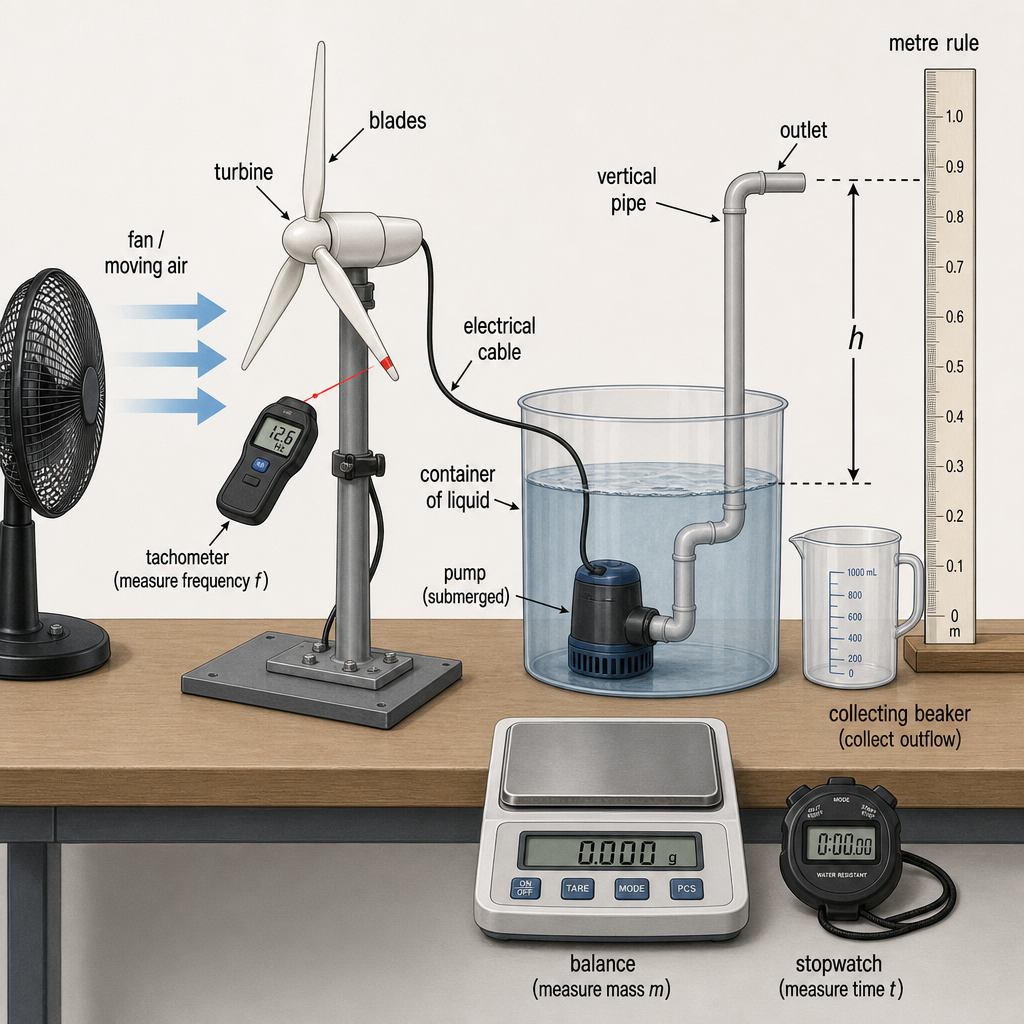
Procedure and measurements
- Set the pump fully submerged in the container and connect it to the turbine generator with the cable.
- Clamp the vertical pipe so that the outlet is a fixed vertical height above the liquid surface; measure with a metre rule.
- Use a fan to provide moving air to the turbine. Vary by changing fan speed (or distance between fan and turbine / angle of turbine).
- For a chosen setting, allow the system to reach steady operation.
- Measure using a tachometer (or a stroboscope / light gate and counter) and record .
- Collect the liquid leaving the top of the pipe for a measured time (stopwatch). Measure the collected mass using a balance.
- Calculate
- Repeat steps 4–7 for at least 6 different values of over as wide a range as possible, keeping constant.
- Repeat each reading (same ) at least twice and average .
Table of results
Record: (once), and for each run , , , , , and .
Analysis (to test the relationship and find and )
Given
Let and . Plot a graph of (vertical axis) against (horizontal axis).
- A straight line supports the suggested relationship.
- Gradient .
- -intercept .
Safety
- Use a low-voltage supply for the turbine/pump circuit; keep electrical connections dry and away from spills.
- Mop up spilled liquid immediately to prevent slipping.
- Keep fingers/hair/clothing away from rotating turbine blades and the fan; secure the apparatus so it cannot tip.
See working
Background Concept
The suggested model links the mechanical/electrical power available from the rotating turbine to the rate at which the pump can lift liquid.
If liquid of mass flow rate is lifted through a vertical height , then the gain in gravitational potential energy per unit time (i.e. power) is
The relationship provided is
This has the form of a straight-line equation if we choose
So, if we can measure , and , we can test whether plotting against gives a straight line, and then use the intercept and gradient to find and .
Understanding the Question
You are asked to plan (not to calculate) a laboratory experiment that:
- varies the rotation frequency of a model wind turbine,
- measures the mass flow rate of liquid coming out of the top of a vertical pipe,
- uses the measured data to check the relationship ,
- and explains how and can be obtained from your results.
You must also include practical details: how to take the measurements, what to keep constant (especially ), how to analyse the data, and safety precautions (water + electricity + rotating parts).
Approach
- Choose variables: make the independent variable by changing the wind speed from a fan.
- Measure : collect the outflow for a known time and measure its mass; then .
- Keep constant: clamp the outlet at a fixed height above the liquid surface and measure .
- Linearise: compute and for each run, then plot vs .
- Extract constants: from , intercept gives and gradient gives .
- Quality: repeat readings to reduce random error and use a wide range of .
Step-by-Step Reasoning
1) Setting up the apparatus
- Place the pump in a container so it stays submerged.
- Connect the pump to the turbine generator.
- Attach the vertical pipe to the pump outlet and clamp it so the outlet position is fixed.
2) Measuring the height
- Define as the vertical distance from the liquid surface in the container to the outlet at the top of the pipe.
- Measure this with a metre rule (or ruler) held vertically next to the pipe.
- Keep constant for the whole experiment because the model equation includes ; if changes, the same would produce a different and spoil the test.
3) Producing and varying the frequency
- Use a fan to provide moving air.
- Vary by adjusting fan speed (preferred) or changing distance/angle.
- Measure with a tachometer, or by using a light gate/strobe method:
- tachometer reads directly in (Hz),
- or mark one blade and count revolutions in a timed interval, then (less precise at high ).
4) Measuring the mass flow rate
- Place a beaker (or measuring jug) at the outlet to collect the liquid.
- Collect for a measured time using a stopwatch.
- Measure mass collected using a balance (mass is usually more accurate than reading volume from a measuring cylinder).
- Calculate
Units: if is in kg and in s, then is in .
5) Repeats and range
- Take at least 6 different fan settings (so at least 6 different values), spanning as wide a range as possible.
- Repeat each run (same fan setting) at least twice and average to reduce random timing/collection fluctuations.
- Ensure steady flow before starting timing; otherwise the collected mass does not represent the steady-state .
6) Data processing and graph
For each run compute:
and
Then plot against .
- If the relationship is correct, points lie close to a straight line.
- Draw a best-fit line.
- Use a large triangle to find the gradient:
- Read the -intercept at ; this gives .
7) Uncertainties (what to do in a plan)
- Estimate uncertainty in from balance resolution, in from reaction time/stopwatch resolution, in from instrument resolution, and in from ruler reading.
- Add error bars vertically using uncertainty in (dominated by uncertainty in from and ).
- If required, a worst acceptable line through the error bars can be used to estimate uncertainty in gradient and intercept .
Key Takeaways
- A planning question is scored for: variables, workable method, clear measurements, control of variables, correct linearisation, and safety.
- Mass flow rate is found from a timed collection: .
- To determine two constants, rearrange to a straight-line graph: plot vs so intercept and gradient .
Common Mistakes
- Plotting against (or even against ) without accounting for as required by the given equation.
- Not stating how is measured (must specify collecting liquid and timing, then ).
- Failing to control or even mention that must be kept constant.
- Using too few readings of (insufficient to judge linearity) or not repeating measurements.
- Ignoring safety issues with electrical equipment near liquid or exposed rotating blades.
Things to Be Careful About
- Measure consistently from the liquid surface to the outlet; if the water level changes significantly, either top it up between runs or re-measure each time.
- Ensure steady-state operation before taking and readings.
- Use consistent SI units so that has units of power (W).
- When finding gradient, use with points far apart on the best-fit line, not between adjacent plotted points.
- Keep the fan/turbine position fixed for each run while measurements are taken to avoid drifting during the timed collection.
The rest of this paper
1 more questions- Q2Analysis, Conclusions and Evaluation15M