Physics 9702/53 — May/June 2022
Cambridge A-Level · Planning, Analysis and Evaluation · worked solutions for every part, with the mark scheme
Topics Analysis, Conclusions and Evaluation · Planning
Two parallel metal plates, each of area , are separated by a small distance , as shown in Fig. 1.1.
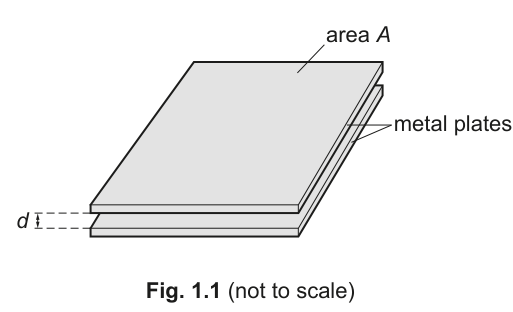
The plates are initially charged using a power supply.
The plates are then connected to an uncharged capacitor. The potential difference across the capacitor is measured.
It is suggested that is related to by the relationship
where is the capacitance of the capacitor, and and are constants.
Plan a laboratory experiment to test the relationship between and .
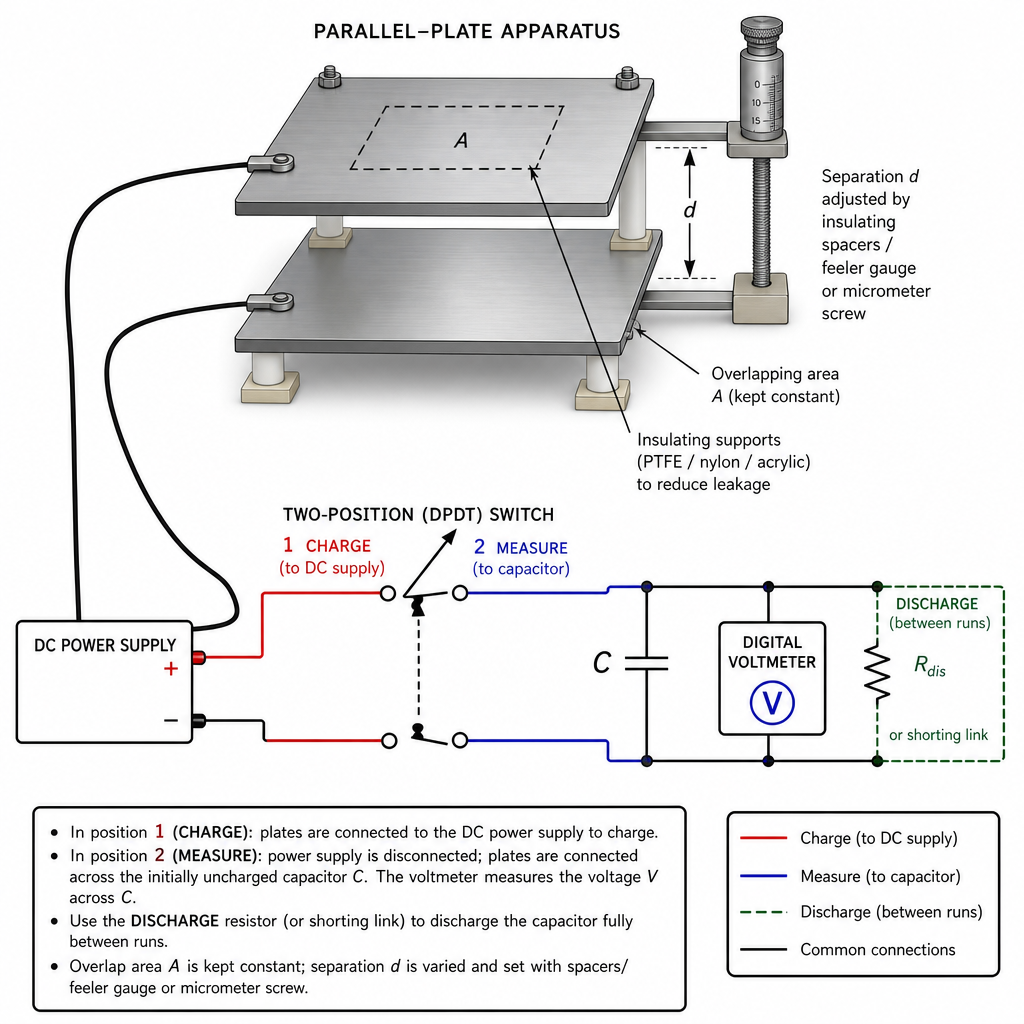
Draw a diagram showing the arrangement of your equipment.
Explain how the results could be used to determine values for and .
In your plan you should include:
● the procedure to be followed
● the measurements to be taken
● the control of variables
● the analysis of the data
● any safety precautions to be taken.
Variables
- Independent variable: plate separation .
- Dependent variable: potential difference across the capacitor after connection.
- Controlled variables: plate overlap area (keep plates parallel and fixed overlap), capacitor (same capacitor), initial charging conditions of plates (same power-supply setting and charging time each run), same connections/leads and environment (reduce leakage).
Apparatus / arrangement
- Two parallel metal plates mounted on insulating supports; insulating spacers/feeler gauges or micrometer screws to set .
- DC power supply for charging.
- Uncharged capacitor of known .
- High-resistance digital voltmeter across the capacitor.
- Switch(es) to (i) charge plates then (ii) disconnect supply and connect plates to capacitor.
- Ruler/vernier to measure plate dimensions for ; micrometer/vernier/feeler gauges for .
Procedure and measurements
- Measure plate dimensions and calculate (keep overlap constant throughout).
- Set a value of separation using spacers/micrometer; measure .
- Ensure capacitor is fully discharged (briefly connect across a resistor / short with a lead).
- With switch in “charge” position, connect plates to the DC supply at fixed setting for a fixed time.
- Move switch to “measure” position: disconnect supply and connect plates to the (initially uncharged) capacitor and voltmeter; record once steady.
- Repeat steps 2–5 for at least 6 different values of over a suitable range; repeat readings of for each and average.
Analysis of data
Given
Divide by :
So plot against .
- Intercept .
- Gradient .
Using ,
Determine and from the best-fit line (and worst acceptable line for uncertainties), then calculate and .
Safety
- Plates can retain charge: do not touch metal surfaces; discharge safely (through a resistor) before adjusting .
- Switch off supply before changing connections; keep voltages low and leads insulated.
See working
Background Concept
The relationship given links the measured capacitor p.d. to the plate separation after charge has been transferred from the initially charged plates to an uncharged capacitor. To test a proposed relationship experimentally, you:
- vary one independent variable (here ),
- measure the dependent variable (here ),
- keep all other relevant quantities constant (especially any that appear in the equation: and ),
- and choose an analysis method that gives a clear test (usually a straight-line graph).
A key Paper 5 skill is linearisation: rearranging an equation into the form
so that plotting against should give a straight line if the model is correct. From the gradient and intercept , you can determine the unknown constants.
Understanding the Question
You are given two parallel plates of fixed area with adjustable separation . The plates are charged using a power supply, then connected to an initially uncharged capacitor (capacitance ). You measure the resulting p.d. across the capacitor.
You must plan an experiment to test whether depends on according to
and explain how to find numerical values for the constants and from your results.
Because and are constants, the experiment must ensure that each run starts from the same initial conditions (especially the way the plates are charged) so that any change in is due only to changing .
Approach
- Choose variables: vary ; measure .
- Design a reliable switching sequence: charge plates in a controlled way, then isolate from the supply and connect to the capacitor for measurement.
- Control variables: keep fixed (same overlap), use the same capacitor , keep charging voltage/time the same, and reduce leakage.
- Linearise the equation into where you can plot using measured quantities (you can measure and , but you cannot directly compute because is unknown).
- Graph and constants: plot the linear graph; obtain gradient and intercept; compute and .
- Uncertainties: repeat readings; plot error bars; use worst-acceptable lines to estimate uncertainties in gradient/intercept and therefore in and .
Step-by-Step Reasoning
1) Practical set-up and why switching is needed
You need two distinct circuit states:
- Charge state: plates connected to the power supply so they are charged in a repeatable way.
- Measure state: power supply disconnected (so it does not affect the redistribution), and plates connected to the uncharged capacitor, with a high-resistance voltmeter across the capacitor.
A DPDT switch (or two labelled switches used carefully) lets you move cleanly between these states.
2) Measurements to take
For each value of :
- measure with a micrometer/vernier/feeler gauges (ensure plates remain parallel; measure at more than one point and average if possible),
- charge the plates under the same supply setting and charging time,
- discharge the capacitor before each run,
- connect plates to the capacitor and record once steady.
Also measure:
- from plate dimensions (length width) and keep overlap constant,
- (from capacitor label or a capacitance meter) and keep the same capacitor for all trials.
Repeats: repeating at each and averaging reduces random uncertainty and gives sensible error bars.
3) Linearising the given relationship
Start with
You cannot plot directly because is unknown. Divide the whole equation by :
This is now in straight-line form with:
- (can be calculated from measured ),
- (measured directly),
- intercept ,
- gradient .
So if the model is correct, a plot of against should be a straight line.
4) Determining and from the graph
From the intercept:
From the gradient:
Substitute into the gradient expression:
Rearrange to obtain
So measuring and allows you to calculate both constants.
5) Uncertainty treatment (what to say in a plan)
- Put uncertainty in from the instrument resolution (and from any lack of parallelism if relevant).
- Put uncertainty in from the voltmeter resolution and repeat scatter.
- When plotting , convert the uncertainty: a small uncertainty in produces an uncertainty in (you can estimate it using percentage uncertainties, e.g. for small uncertainties).
- Draw a best-fit line and a worst-acceptable line through the error bars to estimate uncertainties in gradient and intercept, then propagate to and (e.g. percentage uncertainties add/subtract appropriately for products/quotients).
6) Control of variables (what earns marks)
- constant: do not change the overlap area; mount plates so only separation changes.
- constant: use the same capacitor throughout.
- Initial charging constant: same power-supply setting (and same charging time) each run.
- Leakage: clean/dry insulators, avoid touching charged parts, and take readings promptly.
7) Safety
Even at modest voltages, charged plates/capacitors can give an unpleasant shock and can damage instruments if shorted suddenly.
- Switch off/disconnect before altering .
- Discharge through a resistor before handling.
- Use insulated leads and a high-impedance voltmeter.
Key Takeaways
- A strong plan includes: clear variables, a workable method, control of variables, repeat readings, and a linear graph test.
- When a constant (here ) is unknown, rearrange so your plotted quantities use only measurable data (here vs ).
- For , constants are extracted from gradient/intercept: here and .
Common Mistakes
- Trying to plot vs (impossible because is unknown).
- Not ensuring the capacitor is fully discharged before each run (changes the initial condition and ruins the test).
- Forgetting to keep constant (changing overlap area changes the physics).
- Using a low-resistance voltmeter (loads the circuit and alters ).
- Not stating how and are obtained from the gradient/intercept.
Things to Be Careful About
- Keep plates parallel; if not, the effective separation is ill-defined (large systematic error).
- Choose a suitable range of and enough points (typically 6–8) for a convincing straight-line test.
- When plotting , ensure units are consistent (e.g. in gives in ).
- When finding the gradient, use a large triangle and compute (not ).
- Discharge safely through a resistor rather than directly shorting if the charge could be significant.
The rest of this paper
1 more questions- Q2Analysis, Conclusions and Evaluation15M