Physics 9702/51 — October/November 2021
Cambridge A-Level · Planning, Analysis and Evaluation · worked solutions for every part, with the mark scheme
Topics Analysis, Conclusions and Evaluation · Planning
A student investigates stationary sound waves in cylindrical tubes. Fig. 1.1 shows a stationary wave pattern in a tube which is open at both ends.
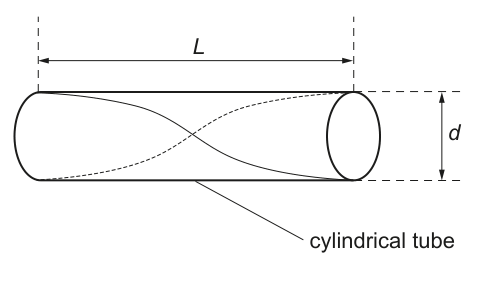
The tube has length and diameter . The frequency of the sound for the stationary wave pattern shown is .
There are a number of different tubes available.
It is suggested that the relationship between and is
where is the speed of sound in air and is a constant.
Design a laboratory experiment to test the relationship between and .
Explain how your results could be used to determine values for and .
You should draw a diagram, on page 3, showing the arrangement of your equipment. In your account you should pay particular attention to:
- the procedure to be followed
- the measurements to be taken
- the control of variables
- the analysis of the data
- any safety precautions to be taken.
Procedure and measurements
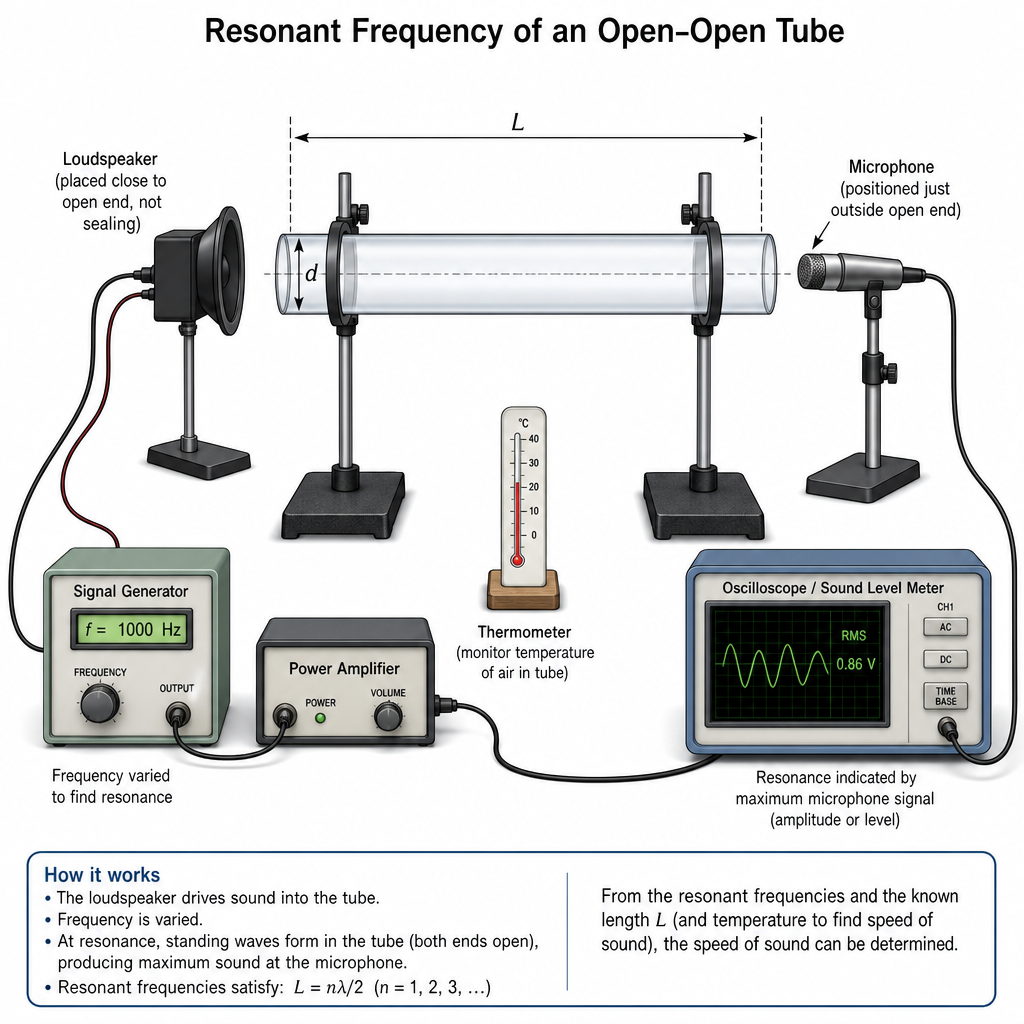
- Use a signal generator (and amplifier if needed) to drive a loudspeaker placed close to one open end of the tube; place a microphone connected to an oscilloscope / sound level meter at the other open end.
- Choose tubes all with the same length (or cut to the same ); measure for each tube with a metre rule.
- Measure internal diameter of each tube using vernier calipers (measure in two perpendicular directions and average).
- For each tube, sweep the frequency and record the resonant frequency for the same mode as Fig. 1.1 (fundamental for open-open: one node at centre, antinodes at both ends), identified by a clear maximum microphone signal.
- Repeat the resonance search (e.g. 2–3 times) and average .
- Use at least 6 different values of .
Control of variables
- Keep constant.
- Keep air temperature (and hence ) constant: perform measurements in the same room in a short time; record temperature.
- Keep the same resonance mode for every tube.
- Keep the positions of the loudspeaker and microphone relative to the tube ends the same; keep the drive amplitude similar.
Analysis of data
Given
Rearrange to
- Calculate for each tube.
- Plot a graph of (y-axis) against (x-axis).
- A straight line supports the suggested relationship.
- From : gradient and intercept .
- Hence
and
Safety
- Keep sound level low; avoid prolonged exposure to loud sound / use ear protection if necessary.
- Secure tubes on stands to prevent rolling/falling; keep cables tidy to avoid trips.
See working
Background Concept
A stationary (standing) wave forms when waves reflect back and forth in a tube and superpose. In an open tube, the air at each open end can move freely, so each open end is a displacement antinode (and approximately a pressure node). For a given mode, the tube length fixes the wavelength pattern, and the resonant frequency is linked to the wave speed by
The question proposes an empirical relationship between frequency and tube diameter :
This has the form “wavelength-like quantity” on the left (since ) equals a term involving the tube length plus a correction proportional to diameter. The aim of the experiment is to see if the data follow this straight-line form and to determine the constants and from measurements.
Understanding the Question
You have multiple cylindrical tubes available (different diameters). The tube is open at both ends and you must excite the stationary wave pattern shown (antinodes at both ends and a node at the centre: the fundamental mode for an open-open tube).
You must:
- design a practical set-up to find the resonant frequency for each tube,
- measure (and ensure/measure ),
- control other variables so any change in can be attributed to ,
- analyse results in a way that lets you find numerical values for and .
Approach
- Choose variables: make the independent variable (pick different tubes), measure the dependent variable at resonance for the same mode, and keep (and temperature) constant.
- Collect data: for each tube, measure accurately with vernier calipers and determine the resonant frequency by sweeping the driving frequency and identifying a maximum response.
- Linearise: because is unknown, avoid plotting . Rearrange to a straight-line form that uses measurable quantities only:
Then a plot of against should be a straight line. The intercept gives and the gradient gives , so you can find then .
Step-by-Step Reasoning
- Apparatus choice
- A signal generator provides a variable frequency electrical signal.
- A loudspeaker converts this to a sound wave incident on the tube.
- A microphone + oscilloscope / sound level meter measures sound amplitude, so resonances appear as clear maxima.
- Vernier calipers measure internal diameter ; a metre rule measures .
-
Ensuring the correct resonance mode
The pattern shown corresponds to the fundamental for an open-open tube (one node near the centre). In practice, the fundamental is usually the lowest-frequency strong resonance. You must use the same mode for all tubes, otherwise the relationship between and geometry changes. -
Measurements for each tube
- Measure using vernier calipers. Because tubes may not be perfectly circular, take two readings at and average.
- Measure (or pre-select/cut tubes so is the same for all). If varies, the change in would be due to both and , so you would not be testing the suggested relationship cleanly.
- Sweep frequency slowly; record the frequency at maximum microphone amplitude (resonance). Repeat to reduce random error and average.
- Control variables (why they matter)
- Length constant: the formula contains , so changing would shift all results.
- Temperature constant: the speed of sound depends on temperature; if temperature drifts, the whole graph shifts, corrupting both gradient and intercept.
- Same end conditions and positions: keep both ends unobstructed and keep speaker/microphone positions fixed so the coupling to the tube is comparable.
- Same mode: ensures you are comparing like with like.
- Linearisation and graph
Start with
Divide by :
This matches the straight-line form if you let:
- ,
- ,
- intercept ,
- gradient .
So:
- Plot (y-axis) against (x-axis).
- If the points lie close to a straight line, the relationship is supported.
- Finding and
From the intercept :
Then from the gradient :
(Units check: has units of s and has units m, so gradient has units . Multiplying by () gives dimensionless , consistent with being a length.)
- Safety
- Avoid high sound levels and prolonged exposure (hearing risk).
- Secure tubes so they do not roll/fall; manage cables to reduce trip hazards.
Key Takeaways
- A Paper 5 planning answer must clearly state variables, a workable method, controls, and a graph-based analysis.
- When a constant (here ) is unknown, rearrange the equation into a straight-line form using only measurable quantities.
- Gradient and intercept can be used to determine multiple constants when the linear form is chosen well.
Common Mistakes
- Allowing to vary between tubes (then changes in are not solely due to ).
- Not stating how resonance is identified (must mention scanning frequency and using a maximum microphone signal).
- Using different harmonics for different tubes (mixes modes and ruins the comparison).
- Choosing a graph that needs (e.g. plotting without knowing ).
- Omitting how and are obtained from the graph (must link gradient/intercept to constants).
Things to Be Careful About
- Measure internal diameter (not external).
- Keep ends truly open (do not block with the microphone; hold it just outside the tube).
- Use enough different diameters to make a convincing straight line (at least 6) and repeat readings.
- Keep temperature steady or record it; large temperature change changes and alters results.
- Use consistent units (convert and to m if calculating in ).
The rest of this paper
1 more questions- Q2Analysis, Conclusions and Evaluation15M