Physics 9702/52 — May/June 2021
Cambridge A-Level · Planning, Analysis and Evaluation · worked solutions for every part, with the mark scheme
Topics Analysis, Conclusions and Evaluation · Planning
A student investigates the heating of a solid metal cylinder. Fig. 1.1 shows the cylinder of cross-sectional area and height .
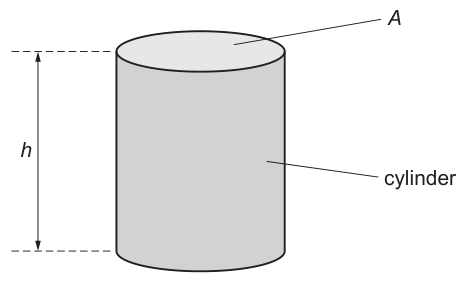
The student places the cylinder and an electrical heater in a beaker of water. The electrical heater is switched on and the student measures the time for the temperature of the water to increase by .
A number of cylinders of the same material but with different cross-sectional areas are available.
It is suggested that the relationship between and is
where is the power of the heater and and are constants.
Design a laboratory experiment to test the relationship between and .
Explain how your results could be used to determine values for and .
You should draw a diagram, on page 3, showing the arrangement of your equipment.
In your account you should pay particular attention to:
- the procedure to be followed
- the measurements to be taken
- the control of variables
- the analysis of the data
- any safety precautions to be taken.
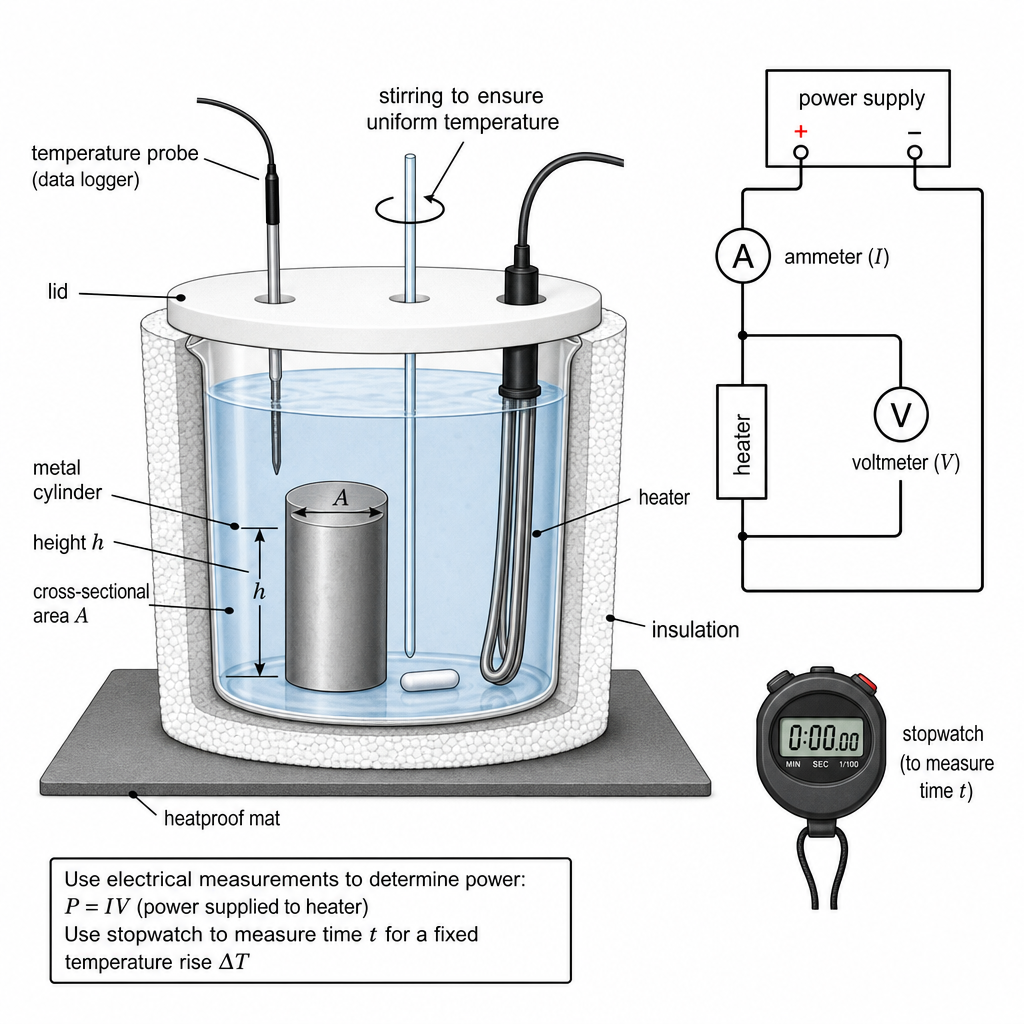
Diagram
Variables
- Independent variable: cross-sectional area of the metal cylinder.
- Dependent variable: time for the water temperature to rise by a fixed .
- Controlled variables (keep constant):
- mass (volume) of water in the beaker
- initial temperature of water
- chosen temperature rise
- heater power (same heater setting and measured)
- cylinder material (given same)
- cylinder height (use cylinders with same , or measure and account for it)
- placement of heater and cylinder, degree of stirring, heat losses (use insulation + lid)
Apparatus
Beaker, water, electrical immersion heater, power supply, ammeter, voltmeter, thermometer/temperature probe (data logger), stopwatch, stirrer, insulation (polystyrene cup or lagging), lid, set of metal cylinders with different (and same ), measuring device for (vernier calipers/micrometer to measure diameter and calculate ).
Procedure and measurements
- Measure cylinder diameter with vernier calipers (several positions) and calculate
Measure and select cylinders with the same (or record for each cylinder).
2. Put a fixed mass/volume of water in the beaker (e.g. measured with a balance/measuring cylinder). Add insulation and a lid.
3. Place the heater and the cylinder fully immersed in the water (same depth each time). Insert the temperature probe; stir gently throughout (or use a magnetic stirrer).
4. Switch on heater. Measure and and calculate
(keep constant, check is steady).
5. Choose a fixed temperature rise (e.g. ). Start timing when the water is at initial temperature and stop when it reaches ; record .
6. Repeat for each cylinder (different ) with the same water mass and same (allow cooling back or replace with fresh water). Take repeats and average .
Analysis (test of relationship and finding and )
Given
Divide by :
For constant , plot a graph of (y-axis) against (x-axis).
- Straight line expected.
- Gradient .
- y-intercept .
Control of variables (examples)
- Use the same beaker/insulation/lid and stir at the same rate to keep heat loss similar.
- Keep water mass constant and ensure cylinder and heater are fully submerged each time.
- Keep the same for all trials and start from the same .
- Use the same heater setting; measure and each run to ensure constant .
Safety
- Hot water and hot heater: risk of burns; handle with tongs/heatproof gloves and allow to cool.
- Electricity near water: use a low-voltage supply where possible, dry hands, keep connections away from spills, switch off before moving the heater.
- Glassware: take care to avoid breakage; wear eye protection.
See working
Background Concept
The heater supplies electrical energy to the system at a rate (power) .
If the heater is on for time , the electrical energy supplied is
The experiment is based on the idea that this supplied energy is used to raise the temperature of the water and also to warm the metal cylinder (and possibly other parts of the apparatus). In practice there will also be some energy lost to the surroundings, which is why good insulation, a lid, and consistent procedure matter.
The suggested model is
where:
- is the cross-sectional area of the cylinder,
- is its height,
- is the temperature rise of the water,
- and are constants.
This is already close to a straight-line form: it says that for a fixed (and fixed ), depends linearly on .
Understanding the Question
You must design an experiment where you:
- vary using different cylinders,
- measure the corresponding time for the water temperature to rise by a chosen fixed ,
- keep other variables controlled so that any change in is mainly due to changing ,
- process the data in a way that tests whether the suggested equation is correct, and
- use the straight-line graph to find numerical values of the constants and .
Because the equation contains , , and , your plan must include how these are measured or kept constant.
Approach
- Choose as the independent variable by selecting multiple cylinders of the same material but different diameters.
- Measure for a fixed, repeatable temperature rise (e.g. ). Fixing makes the timing definition consistent.
- Measure (do not assume it is constant unless you verify it): use .
- Control heat losses and other factors: same mass of water, same container/insulation, same immersion depth, constant stirring.
- Linearise the suggested equation by dividing through by to obtain a straight-line relationship of the form .
- Extract constants from gradient and intercept.
Step-by-Step Reasoning
1) Setting up the apparatus
A good arrangement is an insulated beaker (or polystyrene cup) containing water, with the heater and metal cylinder fully submerged. A temperature probe measures the water temperature and a stirrer keeps temperature uniform so the probe reading represents the whole beaker.
Stirring is important: without it, water near the heater becomes hotter than the bulk, so the probe might not record the true average temperature rise, and becomes inconsistent.
2) Measuring (and )
The cylinders differ in cross-sectional area, so measure diameter with vernier calipers (or micrometer) and compute
Measure at a few positions and average because cylinders may not be perfectly circular.
The equation includes . Ideally use cylinders with the same (then is controlled). If heights differ, measure for each cylinder and either:
- reject cylinders with different , or
- modify the analysis to plot against instead of .
Since the question asks to test a relationship between and , the cleanest plan is to keep constant.
3) Measuring power
Power supplied by the heater is
So include an ammeter in series with the heater and a voltmeter across the heater (or use a power supply with reliable digital readouts). Record and for each run; if they vary, use the measured value of for that run when calculating .
4) Measuring the time for a fixed
Choose an initial temperature (for example, room temperature) and a fixed temperature rise such as . Then:
- start the stopwatch when the probe reads ,
- stop it when it reads .
Repeat each measurement and take an average to reduce random timing and reading error.
5) Controlling variables
To ensure the model is being tested fairly, keep these constant:
- Water mass: measure the same volume or mass each time.
- Heat loss conditions: use the same insulation and lid; keep the beaker in the same environment.
- Starting temperature: cool back to the same between runs (or replace with fresh water at the same ).
- Geometry: keep heater and cylinder positions/depths the same.
- Stirring: same stirring method/rate each run.
- Heater power: same setting and monitor and .
Good control is essential because unwanted changes (e.g. different heat losses) could create apparent changes in that are not due to .
6) Linearising and finding and
Start from the given relationship:
Divide by :
Now compare with :
- Let ,
- Let ,
- Then the gradient is (if constant),
- The intercept is .
So after plotting the graph:
A straight line (within scatter) supports the proposed relationship.
Key Takeaways
- A planning question must clearly identify variables, method, and controls.
- Measuring electrical energy uses with .
- Linearisation is the key to extracting constants: rearrange into so gradient and intercept give the constants.
- Good experimental design focuses on reducing/controlling heat losses and ensuring uniform water temperature.
Common Mistakes
- Not measuring (assuming the heater power is exactly constant without checking and ).
- Forgetting to keep fixed; changing changes the timing definition and breaks the linear comparison.
- Poor control of starting temperature , causing inconsistent heat-loss rates and inconsistent .
- No stirring: temperature gradients make the probe reading unreliable.
- Plotting the wrong graph (e.g. plotting vs directly without accounting for and ), so you cannot obtain and cleanly.
Things to Be Careful About
- Electrical safety: water and live connections must be kept separate; switch off before adjusting the apparatus.
- Ensure the cylinder is fully submerged each time; partial exposure changes heat transfer.
- Decide how to handle : the simplest is to use cylinders with the same height. If not, you must incorporate into the analysis (otherwise the gradient no longer equals ).
- When drawing the best-fit line, use a wide range of values and repeat readings to reduce uncertainty in gradient and intercept.
- Use consistent units (e.g. in , in , in , in or as a temperature difference).
The rest of this paper
1 more questions- Q2Analysis, Conclusions and Evaluation15M