Physics 9702/53 — October/November 2020
Cambridge A-Level · Planning, Analysis and Evaluation · worked solutions for every part, with the mark scheme
Topics Planning · Analysis, Conclusions and Evaluation
A student investigates a spring of width made from a metal wire, as shown in Fig. 1.1.
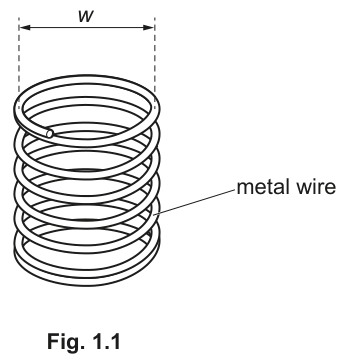
The student constructs several springs, each made from a metal wire of different cross-sectional area . The student investigates how the extension of each spring varies with when a load of mass is applied.
It is suggested that the relationship between and is
where is the acceleration of free fall, is the density of the metal, is the number of turns of wire in the spring and and are constants.
Design a laboratory experiment to test the relationship between and .
Explain how your results could be used to determine values for and .
You should draw a diagram, on page 3, showing the arrangement of your equipment. In your account you should pay particular attention to:
- the procedure to be followed
- the measurements to be taken
- the control of variables
- the analysis of the data
- any safety precautions to be taken.
Answer
Apparatus
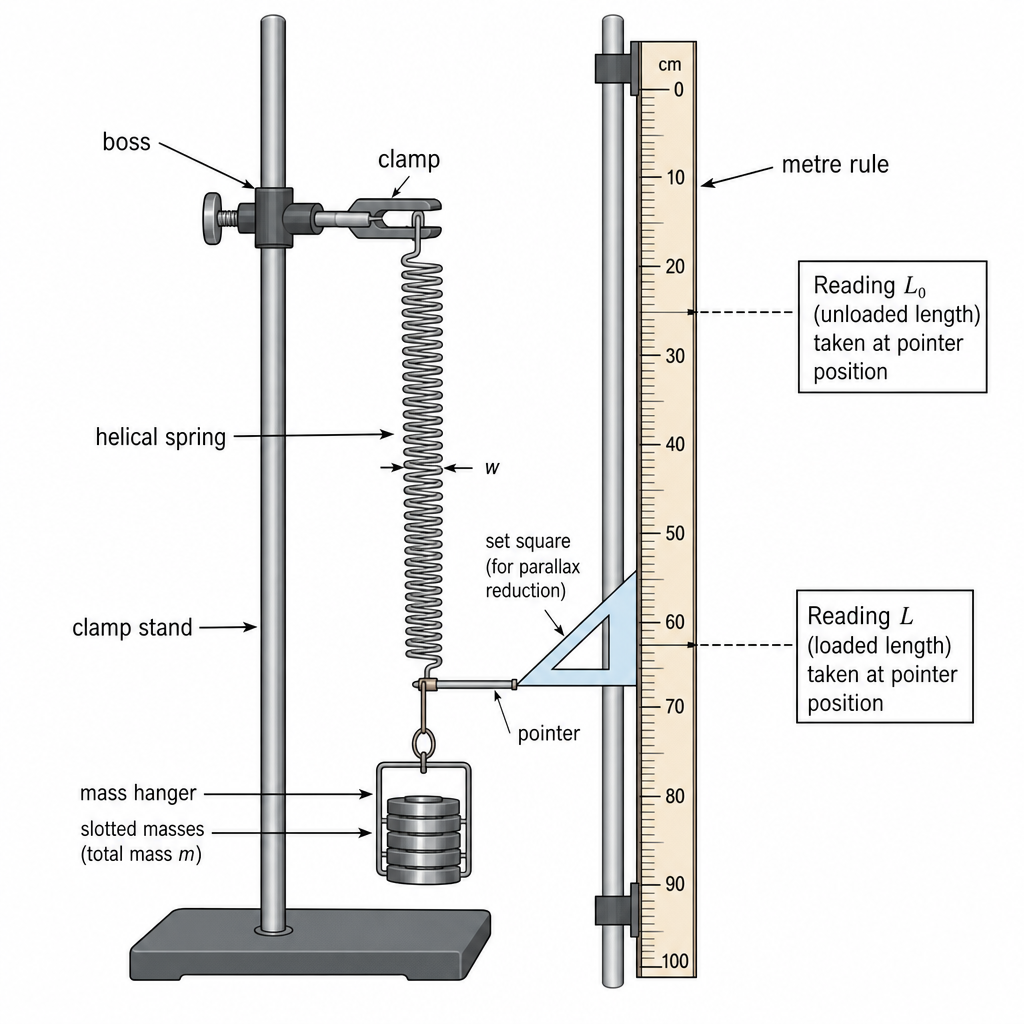
- Clamp stand, boss and clamp
- Metre rule fixed vertically beside spring + set square / pointer
- Mass hanger and masses (fixed total mass )
- Micrometer screw gauge (to measure wire diameter )
- Vernier calipers / ruler (to check spring width )
- Springs made from the same metal but with different wire diameters (hence different )
Variables
- Independent variable: cross-sectional area of the wire.
- Dependent variable: extension for a fixed load .
- Controlled variables: (same load each time), (same coil width), (same number of turns), same metal (so same ), same temperature; keep within elastic limit.
Procedure and measurements
For each spring:
- Measure wire diameter using a micrometer at several positions and two perpendicular orientations; take the mean.
- Calculate
- Hang spring from the clamp stand next to a vertical metre rule. Record the unstretched length (read using a pointer/set square to reduce parallax).
- Add the fixed load of mass gently. Allow oscillations to die away and record the new length .
- Determine extension
- Repeat the loading/unloading measurement at least twice and take the mean .
- Repeat for at least 5 different values of .
Analysis (to determine and )
Given
Take logarithms:
- Plot (y-axis) against (x-axis).
- Gradient of best-fit line .
- Intercept , hence
(Use measured/known values of .)
Safety
- Secure the clamp stand; keep feet clear of falling masses.
- Add/remove masses gently; do not exceed elastic limit (prevent spring snapping/recoil).
- Wear eye protection if large loads are used.
See working
Background Concept
The relationship suggested is a power law between extension and cross-sectional area :
Here and set the applied force , is the (coil) width, is the number of turns, is the density of the metal, and and are constants to be found from experiment. To test a power law experimentally, it is common to linearise it using logarithms:
This is of the straight-line form if we plot against . Then the gradient gives , and the intercept gives the remaining constant combination, allowing to be calculated.
Understanding the Question
You must design a practical to see how changes when you change for different springs, while keeping the other quantities in the formula the same. You are also asked how to use results to determine and .
So you need:
- A way to make (or obtain) springs of the same material but different wire thickness (different ).
- A consistent method to apply the same load to every spring.
- A consistent definition and measurement of extension .
- Control of and (and ensure the metal is the same so is constant).
- A graph-based analysis to extract and .
Approach
- Choose as the independent variable by using springs made from wires of different diameter.
- Measure accurately by measuring wire diameter with a micrometer and using .
- Measure extension as the difference between loaded and unloaded lengths (this cancels any zero error in the ruler position).
- Repeat measurements and use a range of at least 5 springs (good spread in ) to make a reliable graph.
- Linearise with logs: plot vs so the gradient is . Use the intercept plus known constants to calculate .
Step-by-Step Reasoning
(1) Preparing/choosing springs
- Use the same metal for all springs so is constant.
- Keep the number of turns the same by counting turns during winding.
- Keep the spring width the same by winding all springs on the same cylindrical former (mandrel) so the coil diameter stays fixed. Check with calipers.
(2) Measuring the independent variable
- For each spring, measure the wire diameter using a micrometer.
- Take multiple readings along the wire and in two perpendicular orientations (wires can be slightly non-circular). Average to get a better estimate of .
- Calculate
This is usually the biggest source of uncertainty because depends on , so careful micrometer use matters.
(3) Measuring the dependent variable
- Hang the spring vertically from a clamp stand.
- Place a metre rule beside it, fixed so it does not move.
- Attach a small horizontal pointer to the bottom end of the spring (or use the bottom coil as an indicator) and read the position using a set square to reduce parallax.
- Measure the unstretched length .
- Add the same load of mass (mass hanger + masses). Wait until it stops oscillating, then measure the loaded length .
- Extension is
Taking a difference is good practice because it reduces systematic errors from where you chose “zero” on the ruler.
(4) Repeats and quality of data
- Repeat the loading/unloading at least twice (or more) and take the mean extension.
- Use at least 5 (preferably 6–8) different values of to obtain a reliable best-fit line.
(5) Linearising and extracting
Start from
Take natural logs:
So if you plot against :
- The points should lie close to a straight line if the relationship is correct.
- The gradient of the best-fit line is .
(6) Determining from the intercept
Let the intercept be where
Then
so
Use measured , counted , known and , and the metal density (given or from data book). If using instead, the method is the same but you would use instead of .
Key Takeaways
- A power law is tested best by a log-log plot.
- vs gives a straight line with gradient .
- The y-intercept contains the remaining constants and can be rearranged to find .
- Good planning marks come from clear variables, realistic measurements, control of variables, and a correct graph-based analysis.
Common Mistakes
- Not keeping , or constant (then changes in cannot be attributed only to ).
- Measuring only one length and calling it “extension” instead of using .
- Plotting against directly and trying to read without linearising.
- Forgetting that depends on and not describing how is measured accurately.
- Not stating how is obtained from the intercept (many students stop after finding ).
Things to Be Careful About
- Elastic limit: loads must be small enough that the spring returns to its original length; otherwise the model is invalid.
- Parallax: always read the scale with a set square/pointer.
- Oscillations: take readings only when the spring is at rest (or gently damp it).
- Consistency of : define clearly what width means (e.g. coil diameter) and keep it the same using the same former.
- Density : it must be constant (same metal) and you should state the source (data book or separate measurement).
The rest of this paper
1 more questions- Q2Analysis, Conclusions and Evaluation15M