Physics 9702/52 — October/November 2020
Cambridge A-Level · Planning, Analysis and Evaluation · worked solutions for every part, with the mark scheme
Topics Planning · Analysis, Conclusions and Evaluation
A student investigates the motion of a trolley on a wooden surface, as shown in Fig. 1.1.
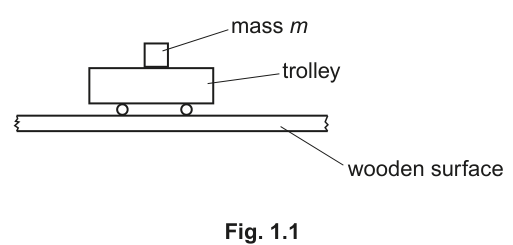
A mass is placed on the trolley.
A mass is attached to the trolley by string which passes over a pulley. When this mass falls, it pulls the trolley along the surface.
The trolley is initially at rest. The student investigates how the speed of the trolley at a distance from the initial position of the trolley varies with .
It is suggested that the relationship between and is
where is the acceleration of free fall and and are constants.
Design a laboratory experiment to test the relationship between and .
Explain how your results could be used to determine values for and .
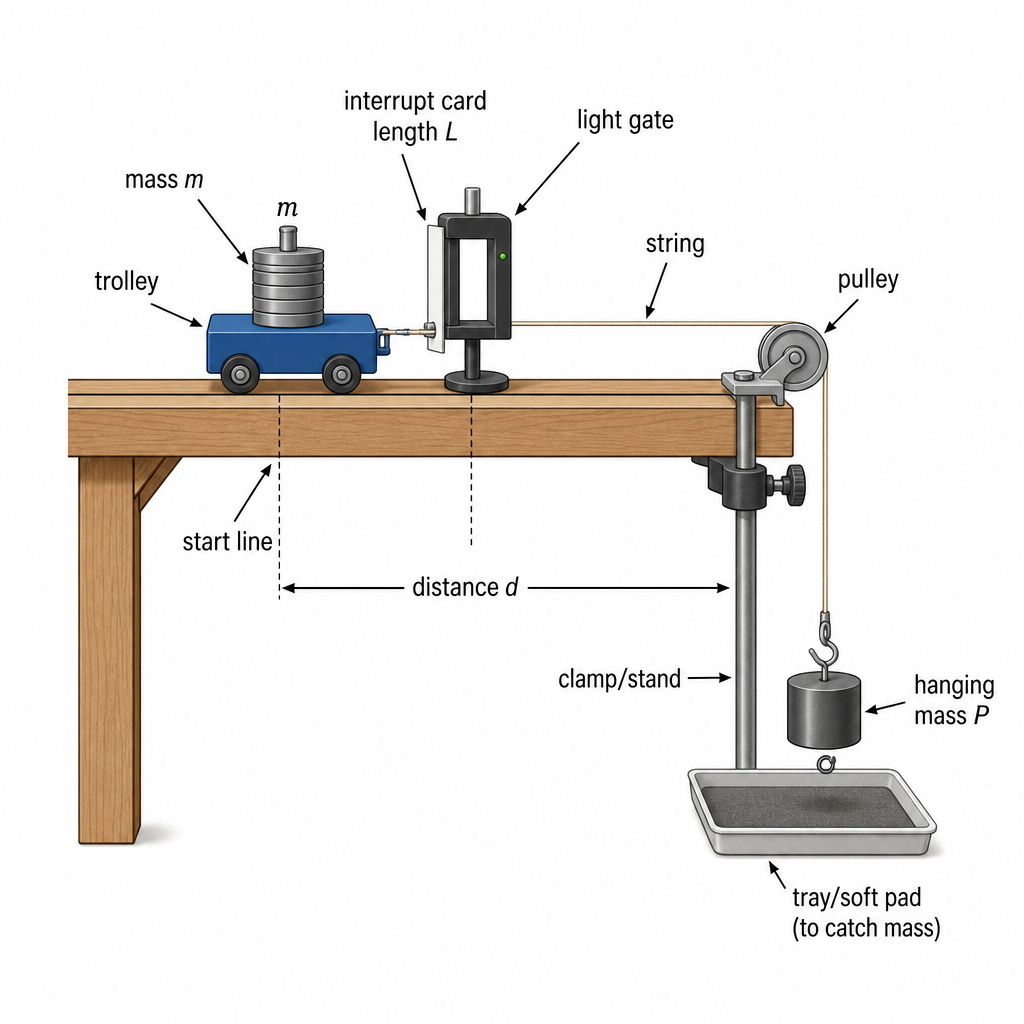
You should draw a diagram, on page 3, showing the arrangement of your equipment. In your account you should pay particular attention to:
- the procedure to be followed
- the measurements to be taken
- the control of variables
- the analysis of the data
- any safety precautions to be taken.
Procedure and measurements
- Independent variable: mass on the trolley (vary by adding known slotted masses).
- Dependent variable: speed of the trolley when it has travelled a fixed distance from the start.
- Keep constant: hanging mass , distance , trolley and runway (same wooden surface), pulley/string arrangement, release method (start from rest at the same line, release without push), and string kept taut.
- Set the trolley on the wooden surface. Attach a string from the trolley over a clamped pulley to a fixed hanging mass .
- Mark a start line and measure a fixed distance along the surface with a metre rule.
- Fit an interrupt card of known length to the trolley and place a light gate at the position .
- For a chosen value of , place the mass centrally on the trolley. Hold the trolley at the start line with the hanging mass just below the pulley (string taut).
- Release the system from rest. The data logger/light-gate timer measures the time for the card to pass the gate, so
- Repeat at least 3 times for each and take the mean .
- Change over at least 6 values and repeat steps 4–6.
Analysis (to test the relationship and find and )
For each , calculate and then calculate
Plot a graph of (vertical axis) against (horizontal axis).
From
the graph should be a straight line with:
Hence
and
Safety
- Ensure the pulley is firmly clamped to the bench.
- Prevent the hanging mass from striking the floor/feet (use a tray/soft landing and keep feet clear).
- Keep hands clear of the moving trolley and string; do not overload the trolley so it cannot run smoothly.
See working
Background Concept
The suggested relationship links the trolley’s speed after moving a distance to the mass placed on the trolley. If the system starts from rest and the acceleration is approximately constant for the short travel, then kinematics gives
Rearranging gives
So a quantity like behaves like the reciprocal of acceleration. In this experiment, the acceleration depends on the total inertia being accelerated (includes plus other effective masses) and the net driving force (weight of minus frictional effects, etc.), which is why the given model has constants and .
For finding constants experimentally, we aim to transform the equation into the straight-line form
so that the gradient and intercept can be used to calculate unknowns.
Understanding the Question
You must design a practical procedure that:
- varies (mass on the trolley),
- measures the speed of the trolley when it has moved a fixed distance from its start,
- keeps other variables (especially the hanging mass and the distance ) constant,
- uses the results to test whether the given equation is correct, and
- extracts numerical values of the constants and .
Because the question asks for speed at a particular position ( from the start), an instantaneous speed measurement at that point is ideal. A light gate + interrupt card provides that cleanly.
Approach
- Choose a reliable way to measure at a known position: place a light gate at distance and attach an interrupt card of known length to the trolley.
- For each chosen , release the trolley from rest at the same start line and record the time for the card to pass the light gate. Compute .
- Repeat to reduce random error and obtain mean for each .
- Compute for each and plot against .
- Compare the graph with the linearised form of the model to obtain and from the gradient and intercept.
Step-by-Step Reasoning
1) Variables
- Independent variable: (add/remove slotted masses on the trolley).
- Dependent variable: when the trolley reaches the position .
- Controlled variables (examples that matter for the model):
- (keep the hanging mass the same for all runs).
- (fixed light gate position relative to the start line).
- The surface/track and trolley (same wooden surface, same trolley wheels/condition).
- The string and pulley arrangement (same pulley, string taut, similar alignment).
- Release conditions: always start from rest at the same point; do not push.
2) Measuring at distance
Attach an interrupt card of measured length to the trolley. Place the light gate exactly at the point from the start line.
When the card passes through, the light gate measures the blocking time , giving the trolley’s instantaneous speed at that point:
This is better than using a stopwatch over because the stopwatch gives an average speed and has large reaction-time error.
3) Collecting sufficient data
Use at least 6 values of spanning a sensible range (large enough to see a trend but not so large that motion becomes slow/jerky). For each , repeat the run at least 3 times and average .
Measuring with a metre rule and keeping it fixed is important because is used directly in the plotted quantity .
4) Linearising and using the graph
Start from the given equation:
Rearrange into straight-line form by splitting the numerator:
So, if you define
- ,
- ,
then
with
From the best-fit straight line on the vs graph:
- find gradient and intercept ,
- calculate
and
(using since ).
A straight line (within scatter) supports the proposed relationship.
5) Safety
Main hazards are the falling mass and moving trolley:
- Clamp pulley securely so it cannot detach.
- Ensure the hanging mass cannot strike feet or bounce dangerously (use a tray/soft landing; keep clear).
- Keep fingers away from the string and trolley path.
Key Takeaways
- A good plan identifies variables clearly and explains how controls are maintained.
- Instantaneous speed at a point is best measured using a light gate and interrupt card.
- To determine constants, linearise the model and use a graph’s gradient/intercept.
- Repeats and averaging are essential for reducing random uncertainties.
Common Mistakes
- Measuring average speed over with a stopwatch and calling it at distance .
- Changing more than one variable (e.g. altering while varying ).
- Not keeping the start position the same, so is inconsistent.
- Plotting the wrong graph (e.g. vs ) which does not directly yield and .
- Forgetting to state how and are obtained from gradient and intercept.
Things to Be Careful About
- Ensure the light gate is positioned so the trolley has actually travelled distance from the same reference point each run.
- Keep the string taut at release; slack changes the initial motion.
- Keep the added mass securely on the trolley so it does not slide (which would change effective motion).
- Use a wide range of values and enough points to justify a straight-line conclusion.
- When calculating , use the measured value of (in ) and the given/known consistently in SI units.
The rest of this paper
1 more questions- Q2Analysis, Conclusions and Evaluation15M